
 ?Mathematical formulae have been encoded as MathML and are displayed in this HTML version using MathJax in order to improve their display. Uncheck the box to turn MathJax off. This feature requires Javascript. Click on a formula to zoom.
1. Introduction
The thoracic aorta can be prone to different vascular pathologies including aortic dissection (AD). AD results in a tearing of the aortic wall layers leading to dissection and creation of a false lumen (FL), adjacent to the true arterial lumen (TL). TL and FL are separated by a part of the dissected wall that is called the neointimal flap. Blood infiltration is then observed into the aortic wall layers. TL and FL can communicate through more than the only primary entry tear (E). According to Stanford classification, if the primary entry tear is localized in the ascending aorta, dissection is a type A dissection (TAAD) otherwise, it is a type B (TBAD). AD can evolve with complications on the long term, the most feared one being the rupture. Surgical intervention is required to replace the dissected segment of the ascending aorta in TAAD whereas a medical surveillance to stabilize pressure is required for TBAD and complemented later with TEVAR (Thoracic EndoVascular Aortic Repair) procedure if needed. The present work focuses more specifically on patients treated for TAAD and who still suffer from a residual TBAD in the descending thoracic aorta. Although the clinical situation may remain unchanged in several of these cases, an unfavorable evolution may lead to a TEVAR procedure on the descending aorta. This evolution, however, remains difficult to predict, which makes patient monitoring very challenging. Few biomechanical numerical studies have partially addressed the TBAD evolution questioning, however either only one patient was considered (Xu et al. Citation2018) or the patient-specific physiological conditions were not met (Cheng et al. Citation2015). The major concern of the present work is therefore to predict the long-term evolution at an early stage of patient monitoring. To tackle this question, 3 D numerical modeling including patient-specific geometries and boundary conditions, unsteady flow and a non-Newtonian fluid behavior was carried out. The aim was to correlate flow behavior and its related physical parameters assessed in early patient monitoring (T0) and clinical evolutions observed about one year later (T1).
2. Methods
2.1. Geometries
Two patients with residual TBAD were chosen retrospectively with clinicians to represent a typical case of favorable evolution (FEv) and unfavorable evolution (UFEv). 3 D geometries were reconstructed at T0 from Computed Tomography Angiography
(CTA-) scans including the entire aorta from the aortic root to the celiac trunk and the three branches on the aortic arch. Both cases show 3 entry tears (Ei, ). Geometries were meshed in similar way with 1.8 M (UFEv) and 1.7 M (FEv) mixed tetrahedral elements and 5 prismatic layers covering the unsteady boundary layer thickness.
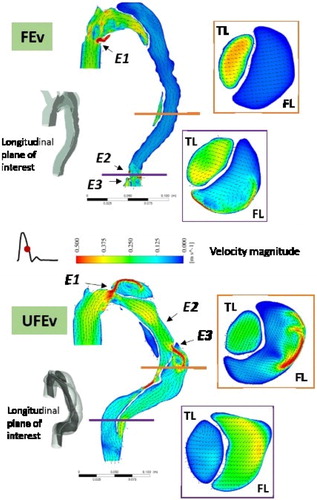
Figure 1. Velocity patterns during deceleration for FEv (top) and UFEv (bottom). Entry tear positions are identified by Ei (i = 1,2,3).
2.2. Boundary conditions and rheology
Unsteady velocity profile was assigned at the inlet from a flow rate curve taken from literature (Olufsen et al. Citation2000). All outlets, including branches on the aortic arch, were modeled with 3-element (R1, R2, C) Windkessel model. UFEv case has 4 outlets and FEv 5 because TBAD extends up to the downstream outlet. Windkessel parameters were tuned to fit physiological pressure, using coupled CFD modeling and geneticalgorithm-based optimization. The vessel wall and flap were considered rigid. Blood was modeled as an incompressible fluid with a shear-thinning behavior described by the Carreau-Yasuda model (Biasetti et al. Citation2011). Both simulations were carried out for 5 periods to achieve periodic solution and the results obtained from the last cycle are presented. Simulations were carried out with ANSYS Fluent.
3. Results and discussion
3.1. Morphological modifications
In one year, FL volume increased by 19% and 27% in FEv and UFEv respectively, whereas maximum diameter increased by 6.3% and 15.7%. Morphological modifications observed one year later cannot however easily discriminate FEv from UFEv case.
3.2. Flow behavior
In both cases, a fluid jet is observed at each entry tear, impinging on the wall directly opposite to it (). The sudden expansion of the downstream section leads to recirculation zones in FL. In UFEv case, flow in FL presents flow separation and recirculation zones due to presence of entry tears that supply the FL and to shrinking, widening and change of curves in the geometry. Velocity values are equivalent or higher than those found in TL. In FEv case, no recirculation nor separation zone is observed except near the entry tears. Flow is aligned with geometry, velocities are very low (<0.01 m/s) all along the FL.
3.3. Hemodynamic parameters and clinical events
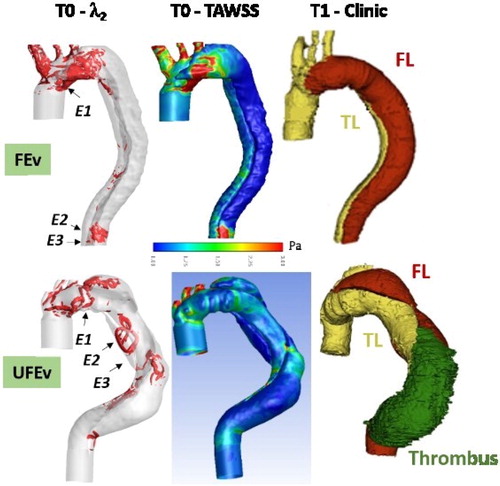
The λ2 criterion is quantified to identify vortical structures in TL and FL (). All along cardiac cycle, no vortex is identified in FEv case, except structures confined to the entry tears, mainly E1. In UFEv case, vortical structures are observed in FL in regards to all entry tears. Structures present near E2 and E3 are convected downstream during deceleration. Time average wall shear stress is also assessed (TAWSS = dt, with T the cardiac period and
the wall shear stress vector). Low TAWSS values (<0.3 Pa) are found in FL descending aorta in both cases (). Biasetti et al. (Citation2011) hypothesized that vortical structures can trap platelets and allow their activation on the vortex periphery due to high shear stress values encountered. Platelets, which are convected downstream with vortex, can then aggregate and/or adhere to the arterial wall at sites of low wall shear stress. This mechanism promotes thrombus formation. The combination of low wall TAWSS values and vortex occurrence is only present in UFEv case. In addition, it is worth noticing that clinical observations reveal thrombus formation at T1 downstream E2 and that E3 is completely occluded due to thrombus.
Figure 2. λ2 criterion during deceleration at T0, TAWSS at T0 and clinical events at T1, for FEv (top) and UFEv (bottom).
4. Conclusions
Morphological modifications, like diameters, are usually the main clinical criteria of unfavorable TBAD evolution. However, they are not sufficiently predictive. This work has brought out that numerical modeling of early patient monitoring allows to assess hemodynamic indexes that correlate with unfavorable future clinical events like thrombus. Evolution prediction thus seems possible. Fluid-structure interaction modeling is currently under process to give more precise information between flow dynamics and unfavorable patient evolutions.
References
- Biasetti J, Hussain F, Gasser TC. 2011. Blood flow and coherent vortices in the normal and aneurysmatic aortas: a fluid dynamical approach to intra-luminal thrombus formation. J R Soc Interface. 8(63):1449–1461.
- Cheng Z, Wood NB, Gibbs RGJ, Xu XY. 2015. Geometric and flow features of type B aortic dissection: initial findings and comparison of medically treated and stented cases. Ann Biomed Eng. 43(1):177–189.
- Olufsen MS, Peskin CS, Kim WY, Pedersen EM, Nadim A, Larsen J. 2000. Numerical simulation and experimental validation of blood flow in arteries with structured-tree outflow conditions. Ann Biomed Eng. 28(11):1281–1299.
- Xu H, Piccinelli M, Leshnower BG, Lefieux A, Taylor WR, Veneziani A. 2018. Coupled morphologicalhemodynamic computational analysis of type B aortic dissection: a longitudinal study. Ann Biomed Eng. 46(7):927–939.