
 ?Mathematical formulae have been encoded as MathML and are displayed in this HTML version using MathJax in order to improve their display. Uncheck the box to turn MathJax off. This feature requires Javascript. Click on a formula to zoom.
Keywords:
1. Introduction
Stenosis, defined by a partial or full obstruction of arteries is one of the most frequent anomalies in the cardiovascular system. In clinical studies, blood pressure drop across the stenosis gives significant indications regarding the severity of the pathology, and trained medical can find out clinical indications only knowing these specific data. Despite of continuous improvements in the field of medical imaging allowing access to instantaneous velocity field and geometry topology in the vascular network, pressure data cannot be assessed. Modelling has therefore been considered as a relevant option for computing blood flow in stenosed vessels, and to extract pressure data directly or indirectly. In the early detection of pathologies the pressure drop across a stenosis is a powerful marker, some works on Navier-Stokes inversion from 4D data have been made (i.e. Bley et al. Citation2011 and references therein) but the approach is computationally complex and the actual spatial resolution is not enough to an accurate computing of the spatial gradients.
In collaboration with the Hospital Necker (Team Centre de référence Malformations Cardiaques Congénitales Complexes) we propose the evaluation of the blood pressure drop across the stenosis using different models starting from the basic 0D model to more complicated ones.
2. Methods
Inside of the stenosis, blood flow and then blood pressure are highly controlled by the geometric properties and wall rheology. Geometric properties can be reduced to the arterial diameter ratio and stenosis length
and on the other hand wall rheology is a more complicated parameter to evaluate. Changes in the geometric properties, wall rheology and input flow lead to changes in the flow hemodynamic and therefore in the blood pressure drop across the stenosis. As stated above using 4D magnetic resonance (MR) flow measurements, we can extract the pressure gradient
from the Navier-Stokes equation
where
is the velocity vector, μ the viscosity, ρ and
the density and gravity vector respectively. In addition to the computational complexity, the velocity field is poorly resolved by the MR device to get out precise estimations of the spatial derivatives.
Starting from the Navier-Stokes equation we proposed an exhaustive numerical study involving different reduced models: 2D axisymmetric Navier-Stokes model, steady RNSP model (Lagrée and Lorthois Citation2005) with rigid arterial walls, 2D multi-ring model (Ghigo et al. Citation2017) to study the influence of models parameters. Finally, we compared the numerical results against a common 1D model (Stergiopulos et al. Citation1992) and a classical 0D model frequently used by physicians (Seeley and Young Citation1976).
3. Results and discussion
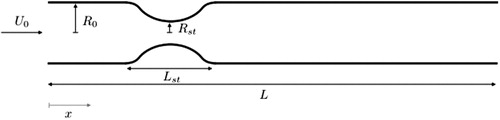
presents the stenosis configuration. Diameter ratio and stenosis length
determine the geometric characteristic. The input velocity is the dynamical control parameter.
Figure 1. Stenosis configuration. Geometric properties are the arterial diameter ratio and stenosis length.
presents a typical normalized pressure drop across the stenosis on the central line along the normalized axial direction using different models: RNSP, Multi-ring, 1D. The analytical pressure drop from a Poiseuille flow as well as the artery radius are given for reference.
Figure 2. Centerline pressure as function of the axial coordinate in a rigid stenosed artery using 1 D, Multi-ring and RNSP models.
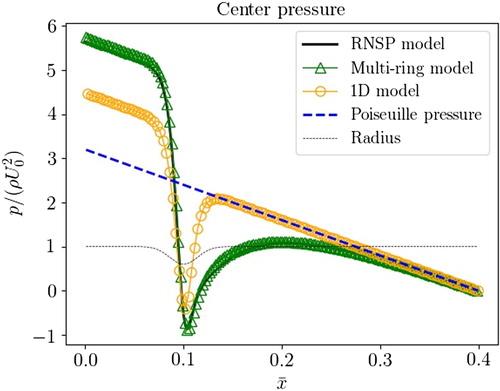
We observe that the pressure peak at the throat of the stenosis is well evaluated by all approaches (even for the 0D approach not shown in ). However, the pressure drop evaluated between the beginning and the end of the stenosis, used in clinical diagnostic, can be different. In this communication, we will present also a complete comparison against experimental data. Experimental data come from 4D magnetic resonance flow measurements and in exceptional situations they are completed by invasive measurements obtained from endovascular pressure catheter.
4. Conclusions
When we compare the numerical results to an invasive catheter measurement of transstenotic pressure we can observe that in general 0D model overestimates the pressure drop, but the 1D model underestimate it, finally we found that multi-ring model gives a good agreement with the measured pressure drop.
Acknowledgements
We thank the “Centre de référence Malformations Cardiaques Congénitales Complexes” of Hospital Necker for the experimental data.
References
- Bley TA, Johnson KM, François CJ, Reeder SB, Schiebler ML, R. Landgraf B, Consigny D, Grist TM, Wieben O. 2011. Non-invasive assessment of transstenotic pressure gradients in porcine renal artery stenoses by using vastly under sampled phase-contrast MR angiography. Radiology. 261(1):266–273.
- Ghigo AR, Fullana J-M, Lagrée P-Y. 2017. A 2D nonlinear multi-ring model for blood flow in large elastic arteries. Comput Phys. 350:136–165.
- Lagrée P-Y, Lorthois S. 2005. The RNS/prandtl equations and their link with other asymptotic descriptions: application to the wall shear stress scaling in a constricted pipe. Int J Eng Sci. 43(3–4):352–378.
- Seeley BD, Young DF. 1976. Effect of geometry on pressure losses across models of arterial stenoses. J Biomech. 9(7):439–448.
- Stergiopulos N, Young DF, Rogge TR. 1992. Computer simulation of arterial flow with applications to arterial and aortic stenosis. J Biomech. 25(12):1477–1488.