
Keywords:
1. Introduction
Since the Summer Youth Olympic Games (YOG) 2018, hosted in Buenos Aires, Argentina, sport climbing is an official event of the Olympic Games program as a combine event. The climbers have to perform three events, i.e., speed, boulder and lead. Speed event consists on, after a starting beep, climbing as quick as possible an internationally standardized wall of 15.5 m with 31 holds (20 hand holds and 11 feet holds) and a touch pad to stop the timer. Climbers competing side by side, and whoever reaches the top first wins. World records are 5.48 s in men and 7.32 s in women.
The performance of a climber can be characterized by the fluency of its body center of mass (BMC) assimilated most of the time to a point of the pelvis. Indeed, 3 D studies are difficult to implement because of the proximity between the climber and the wall. The fluency could be quantified either by the geometric entropy of the BMC (Cordier et al. Citation1994, Sibella et al. Citation2007, Watts et al. Citation2016) or its jerk (Seifert et al. Citation2014, Citation2017).
The geometric index of entropy (H) is calculated by recording the distance path covered by the pelvis (L) and the perimeter of the convex hull around that path (c) according to the following equation: H = log(2L/C)
The purpose of this study was to characterize the performance of climbers during the speed climbing event of the YOG 2018 regarding to the kinematics of the trajectory of their pelvis.
2. Methods
2.1. Population
42 sport climbers (21 males and 21 females) from 26 different nations and aged between 14 and 18 take part to the combine event.
2.2. Data acquisition
Digital video images were acquired at 30 Hz using a camera (Sony RX10 III) fixed on a 3 D axis stabilization platform (DJI Ronin-M). The system was placed in front of the speed wall at a height of 4.5 m and at a distance of 14.0 m so that both climbers could be filmed at the same time. The whole was controlled remotely by cables (video feedback and control of the movements of the platform).
2.3. Data analysis
As climbers used many methods for climbing the route, we considered 4 locomotor phases for analyzing the route, i.e., (i) from the start to the middle of the first acceleration phase (hold 09), (ii) from hold 09 to the end of the first dyno (hold 18), (iii) from hold 18 to the end of the second dyno (hold 29) and (iv) the end of the route.
All the tests for which the entire route could not be filmed were excluded from the study, i.e., climbers did not reach the top of the track or the velocities differences between the two climbers during a run were too important to hold them together in the camera field. Finally, 93 over 140 trials (66.4%) were analyzed during the male and female qualifications and final phases.
The back center of each climber’s waist harne was digitalized frame by frame using Kinovea software (www.kinovea.org. . . . . . . . . . ) and interpreted as an estimate of the BMC position. In order to correct the perspective, a bilinear interpolation was applied at each frame. All numeric calculations have been performed using GNU Octave 4.2.2 software (Eaton et al. Citation2016). Raw kinematic data were fitted using a second-order Butterworth filter (cutoff frequency: 6 Hz). Statistical analysis was performed using R (R Core Team Citation2014).
3. Results and discussion
Geometric index of entropy was significantly lower in males than in females, indicating that the length of the path was lower and fluency greater in males (). Note that female athlete climbs higher than the males. That is related to the last movement of the route that is a dyno. As females have shorter arms, they have to jump higher than males to attain the final pad ().
Figure 1. Average pelvis trajectories in males and females.
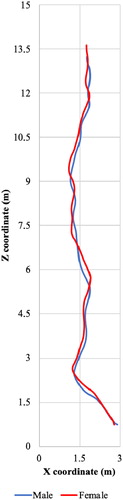
Table 1. Mean performance data in male and female.
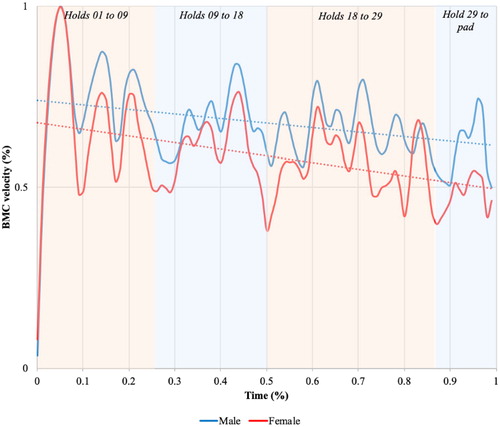
BMC velocity decreased all along the route. This decreasing was significantly greater in females (0.53 ± 0.18) than in males (-0.39 ± 0.23). Moreover, decreasing peaks were observed for all climbers after hold 9 and the both dynos (). This indicates a great difficulty to perform an acceleration when arriving on the dyno’s final holds.
Figure 2. Normalized relationships between BMC velocity in males and female and its displacement.
4. Conclusions
Performance differences in males and females were essentially explained by their ability to (i) minimize lateral displacements for increasing fluency, (ii) maintain high velocity levels all along the acceleration phases and (iii) minimize velocity decreasing after dynos.
Acknowledgements
The authors thank the International Federation of Sport Climbing (IFSC) for their financial contribution to the study and in particular Marco Scolaris, IFSC President and Jérôme Meyer, in charge of the Olympic climbing event. We also thank the IOC and its partners for obtaining accreditations and access to the entire field of play. This study was also supported by a grant of the INSEP 17r12.
References
- Cordier P, Mendès-France M, Pailhous J, Bolon P. 1994. Entropy as a global variable of learning process. Hum Mov Sci. 13(6):745–763.
- Eaton JW, Bateman D, Hauberg S, Wehbring R. 2016. GNU Octave version 4.2.0 manual: a highlevel interactive language for numerical computations. http://www.gnu.org/software/octave/doc/interpreter/.
- R Core Team. 2014. R: A language and environment for statistical computing. Vienna, Austria: R Foundation for Statistical Computing. http://www.R-project.org/.
- Seifert L, Cordier R, Orth D, Courtine Y, Croft J.L. 2017. Role of route previewing strategies on climbing fluency and exploratory movements. Plos One. 12(4):e0176306.
- Seifert L, Orth D, Boulanger J, Dovgalecs V, Héeault R, Davids K. 2014. climbing skill and complexity of climbing wall design: assessment of jerk as a novel indicator of performance fluency. J Appl Biom. 30(5):619625.
- Sibella F, Frosio I, Schena F, Borghese N.A. 2007. 3D analysis of the body center of mass in rock climbing. Hum Mov Sci. 26(6):841–852.
- Watts PB, Drum SN, Kilgas MA, Phillips KC. 2016. Geometric entropy for lead vs top-rope rock climbing. Int J Exerc Sci. 9:168–174.