
1. Introduction
Aortic Smooth Muscle Cells (AoSMC), through mechanosensitivity and mechanotransduction, play a keyrole in growth, remodeling, and homeostasis (Humphrey et al. Citation2015). AoSMC are highly sensitive to biochemical and mechanical stimuli from the surrounding extracellular matrix (ECM) (Sazonova et al. Citation2015). Their cytoskeleton presents a highly developed contractile apparatus that includes a special actin isoform, the Alpha Smooth Muscle Actin (α- SMA), expressed and recruited to enhance the cell traction force (Goffin et al. Citation2006). The active mechanical role of AoSMC in the aorta constitutes an emerging subject of interest, notably for the characterization of their basal tone in order to quantify their contribution to the aortic wall response to blood pressure variations (Matsumoto et al. Citation1996). Consequently, there is a pressing need to investigate the mechanical response of AoSMC at the subcellular scale.
If the Atomic Force Microscopy (AFM) technique has already proved is efficiency for high resolution mapping of cell mechanical properties (Braunsmann et al. Citation2014), few work focused on smooth muscle cells. The outlines from previous work involving vascular smooth muscle cells showed an increasing stiffness under pathological conditions (Crosas-Molist et al. Citation2015) or under the influence of a vasoconstrictor agonist (Hong et al. Citation2015). This provided hints about the link relating AoSMC contractility and AoSMC stiffness using AFM nanoindentation.
In the present study, we present a method using AFM on individual living AoSMC and show original results of subcellular stiffness distributions.
2. Methods
2.1. Cell culture and sample preparation
AoSMC, from a human lineage from Lonza, were stored in liquid nitrogen at passage 5. After thawing, cells were transferred into a T-75 flask for an entire week in growth medium (SmGM-2, Lonza). The cells were incubated at 37 °C and 5% CO2 to maintain the pH at 7.2-7.4. Then, the SMC were cultured one week more in a basal medium (SmBM, Lonza), containing low (2%) FBS and 0.04% heparin, according to the manufacturer’s instructions. Once they reached 50- 70% confluence, we used standard cell detachment protocol using a trypsin treatment. An amount of 50 000 cells were seeded in a 35 mm Petri dish containing an hydrogel with adhesive collagen I coating (Matrigen Petrisoft 35, collagen pre-coated, 4 kPa). Then, the sample was incubated for two days before the experiment. We also fixed AoSMCs adhering on a fibronectin substrate and stained their actin cytoskeleton and their nucleus. We used a Zeiss Axio Observer.Z1 fluorescent microscope for the characterization of the AoSMC’s internal architecture.
2.2. Atomic force microscopy
We used a JPK Nanowizard® 3 AFM, equipped with a heating stage (HTHSTM) that is set at 37 °C, and JPK Data Processing software (V.6.1.118). We calibrated a HQ:CSC17/Cr-Au tip with k = 0.12N/m and f = 13 kHz thanks to the thermal noise method. Because of the limited scan size (30*30µm) and vertical course of the piezoelectric scanner (6.5 µm), we had to select a suitable area of the whole SMC. We chose the QITM mode for obtaining both the sample morphology and the mechanical properties mapping, by recording the whole force curves on the specified scan area. The setpoint parameter was 2nN in order to correctly follow the cell morphology and characterize the cell components under the membrane. Since the applied force remained under this value, we avoided the effect of the underlying substrate (Dimitriadis et al. Citation2002). A batch processing of the whole force curves permitted mapping the Young’s modulus of the scanned area, by applying a mechanical model of contact.
3. Results and discussion
The dense actin fibrous network of AoSMCs clearly appeared on AFM morphology images (). The obtained network organization was similar to the one observed with fluorescence microscopy on similar AoSMCs (). The maps of Young’s moduli showed an unequal tensional state depending on the location of the actin fibers and of the focal adhesion sites (). In we report the mean Young’s moduli and standard deviations across the scanned area for N = 3 cells. Regional variations can be explained by the subcellular dynamics of cytoskeletal remodelling involved in cell adhesion and contraction (Goffin et al. Citation2006).
Figure 1. Morphology of the selected cell area (A) and distribution of the Young’s modulus values obtained for an AoSMC. (16.8*24.6 µm, 200*292 points, 2nN).
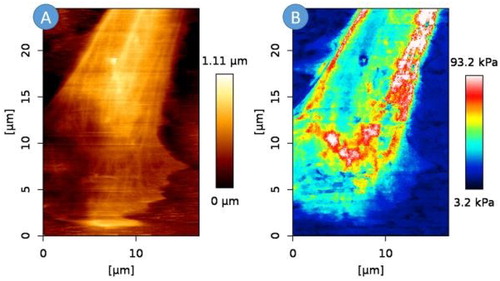
Figure 2. Images of the cell cytoskeleton and nucleus obtained with fluorescence microscopy, F-actin is stained in red (Objective Plan-Neofluar x10).
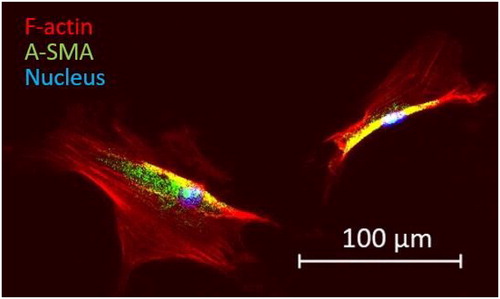
Table 1. Mean and standard deviations of Young’s modulus values obtained for N = 3 cells.
4. Conclusions
AFM nanoindentation is capable of mapping quantitatively the subcellular stiffness under the membrane of an isolated AoSMC. This shows that the cell contractility does not involve homogeneously all the actin fibers. Future work will consist in linking the local cell stiffness with traction force measurements (Petit et al. Citation2019) in order to develop a biomechanical model of the AoSMC’s cytoskeletal dynamics.
Additional information
Funding
References
- Braunsmann C, Seifert J, Rheinlaender J, Schäffer TE. 2014. High-speed force mapping on living cells with a small cantilever atomic force microscope. Rev Sci Instrum. 85(7):073703.
- Crosas-Molist E, Meirelles T, López-Luque J, Serra Peinado C, Selva J, Caja L, Gorbenko del Blanco D, Uriarte JJ, Bertran E, Mendizábal Y, et al. 2015. Vascular smooth muscle cell phenotypic changes in patients with marfan syndrome. Arterioscler Thromb Vasc Biol. 35(4):960–972.
- Dimitriadis EK, Horkay F, Maresca J, Kachar B, Chadwick RS. 2002. Determination of elastic moduli of thin layers of soft material using the atomic force microscope. Biophys J. 82(5):2798– 2810.
- Goffin JM, Pittet P, Csucs G, Lussi JW, Meister J-J, Hinz B. 2006. Focal adhesion size controls tension-dependent recruitment of α-smooth muscle actin to stress fibers. J Cell Biol. 172(2):259–268.
- Hong Z, Reeves KJ, Sun Z, Li Z, Brown NJ, Meininger GA. 2015. Vascular smooth muscle cell stiffness and adhesion to collagen I modified by vasoactive agonists. Plos One. 10(3):e0119533.
- Humphrey JD, Schwartz MA, Tellides G, Milewicz DM. 2015. Role of mechanotransduction in vascular biology: focus on thoracic aortic aneurysms and dissections. Circ Res. 116(8):1448–1461.
- Matsumoto T, Tsuchida M, Sato M. 1996. Change in intramural strain distribution in rat aorta due to smooth muscle contraction and relaxation. Am J Physiol. 271(4 Pt 2):H1711–1716.
- Petit C, Guignandon A, Avril S. 2019. Traction force measurements of human aortic smooth muscle cells reveal a motor-clutch behavior. Mol Cell Biomech. 16(2):87–108.
- Sazonova OV, Isenberg BC, Herrmann J, Lee KL, Purwada A, Valentine AD, Buczek-Thomas JA, Wong JY, Nugent MA. 2015. Extracellular matrix presentation modulates vascular smooth muscle cell mechanotransduction. Matrix Biol. 41:36–43.