
Keywords:
1. Introduction
A bad fitted saddle may hurt or injure the horse’s back. It is an important challenge for saddle designers to understand how a saddle interacts with different back shapes. Fitting is usually assessed by subjective observations, and if some rules exist, they remain subject to interpretations and mistakes. The use of electronic pressure mats to assess saddle fitting has started 25 years ago (Harman Citation1994). It enables to provide objective measurements. It was first used to link pressure data and horse’s back health problems (1, ), then to evaluate the influence of saddle parameters on the pressure distributions (6-12).
Table 1. Studies selected. Analysed gaits: standing (S), walk (W), sitting (ST) or rising (RT) trot, undefined trot (T), canter (C).
The purpose of the current study is to review how pressure mat measurements were used in the literature to assess the influence of different saddle parameters, and thus suggest some general guidelines.
2. Methods
2.1. Search strategy
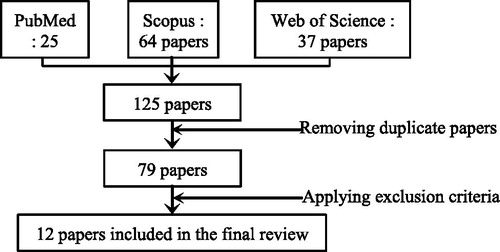
The electronic search was performed in February 2019 in the SCOPUS, PubMed, and Web of Science databases. The keywords used were ‘horse*’, ‘saddle’, ‘pressure’ and ‘electronic or mat* or pad* or distribution or measurement or computerized’.
Exclusion criteria were: conference proceeding, review, not an English saddle studied, no pressure mat/pad used, studies focusing on rider position, gait or saddle pad, and without dynamic recording. There was no language restriction.
3. Results and discussion
3.1. Search yield
The search returned 125 results. After removing duplicates and applying exclusion criteria, 12 articles were selected ().
Figure 1. Flow chart of the literature search.
3.2. Topic
First, several studies focused on the link between saddle models and potential back health problems, comparing clinical signs to pressure (1, 4-5, ) and trying to establish a pain threshold. Nyikos et al. (Citation2005) proposed two thresholds (a 11 kPa-mean pressure and a 30 kPa-maximal pressure) that are still widely used in the literature. Some studies compared the pressure distribution from saddles of varying brands (2, 3, 12).
Another group of studies focused on comparing different saddle design parameters (generally for a same saddle model) based on pressure distributions. They observed the influence of the saddle tree (6, 810, 12), panels size (11), panels flocking and position of girthing (7).
3.3. Material
Harman (Citation1997) worked with a SaddleTech systemFootnote1 which includes a 22-meter wire connection compelling the subject to move on a circle around it. All the others used the Pliance systemFootnote2 (Novel GmbH,), allowing the horse to freely move by integrating all electronic devices in the rider’s belt. That system includes 256 pressure sensors with a 10 cm2 area for each sensor.
3.4. Experimental protocols
Nine of out of the 12 studies (4, 5, 8-12) recorded data while the horse moved along straight line, following Werner et al. (Citation2002) who were not able to show pressure differences when the horse walked along a circle or a straight path. Meschan et al. (Citation2007) were the only one to use a treadmill. As for the rider, 6 studies (2, 6, 8-11) used only one rider for each horse, following the conclusions of Peham et al. (Citation2001), stating that riding skills influence rider stability. 5 studies (1, 3-5, 12) used the horse owner and his own saddle. Only Byström et al. (Citation2010) mixed 3 riders with 6 horses in order to obtain 18 couples. In addition, many other differences exist in those protocols (). As for recording conditions: four were recorded using time-based protocols (6, 8-10), four were distanced-based (5, 7, 11, 12), and the other four did not provide any information (1-4).
3.5. Variables
Each sensor records pressure on its surface. This enables to determine the total force and contact surface at any time. Authors have chosen between 1 and 9 related variables, considering possible subdivisions of the pressure mat (summarized in ). The chosen variables could be different for studying the same part: for instance (7) and (11), focusing on panels, used distinctive variables (e.g., peak pressure vs mean pressure). One of the most useful method was to determine the surface above a specific pressure value (e.g., 11 kPa (4)). This threshold was used in four studies (7-10), but (7) also included other thresholds (i.e., 4.67 kPa (1) and 30 kPa).
4. Conclusions
Saddle-fitting is a difficult task taking into account both the saddle design and equine back geometry. Pressure mat measurements have been used since 1994 to help in this task. While, most studies rely on a similar type of material, the protocols as well as the analysed parameters varied largely over the studies. A couple of methods can be drawn from this review as reliable (i.e., ensuring repeatability of the measurements): use of a wireless system, trotting along a straight path with a single expert rider performing at least at sitting trot, recording conditions based on a defined time or distance, and pressure analyses based on the variables proposed by (8-10). As a perspective, future research could try to determine what is the best pressure threshold enabling to avoid horse discomfort.
Notes
1 Equi tech, Woodside, CA 94062, USA
2 NOVEL GmbH, Munich, Germany
References
- Belock B, Kaiser LJ, Lavagnino M, Clayton HM. 2012. Comparison of pressure distribution under a conventional saddle and a treeless saddle at sitting trot. Vet J. 193(1):87–91.
- Byström A, Stalfelt A, Egenvall A, von Peinen K, Morgan K, Roepstorff L. 2010. Influence of girth strap placement and panel flocking material on the saddle pressure pattern during riding of horses. Equine Vet J. 42:502–509.
- Clayton HM, O’Connor KA, Kaiser LJ. 2014. Force and pressure distribution beneath a conventional dressage saddle and a treeless dressage saddle with panels. Vet J. 199(1):44–48.
- Harman JC. 1994. Practical use of computerized saddle pressure measuring device to determine the effects of saddle pads on the horse’s back. J Equine Vet Sci. 14(11):606–611.
- Harman JC. 1997. Measurement of the pressures exerted by saddles on the horse’s back using a computerized pressure measuring device. Pferdeheilkunde . 13(2):129–134.
- Martin P, et al. 2017. Effects of large saddle panels on the biomechanics of the equine back during rising trot: Preliminary results. J Equine Vet Sci. 48:15–22.
- Meschan EM, Peham C, Schobesberger H, Licka T. 2007. The influence of the width of the saddle tree on the forces and the pressure distribution under the saddle. Vet J. 173(3):578–584.
- Mönkemöller S, Keel R, Hambsch D, Müller J A, Kalpen A, Geuder M, Auer J A, von Rechenberg B. 2005. Pliance Mobile–16HE: Eine Folgestudie über elektronische Satteldruckmessungen nach Anpassung der Sattelsituation. Pferdeheilkunde. 21(2):102–114.
- Murray R, Guire R, Fisher M, Fairfax V. 2017. Reducing peak pressures under the saddle panel at the level of the 10th to 13th thoracic vertebrae may be associated with improved gait features. J Equine Vet Sci. 54:60–69.
- Nyikos S, von Rechenberg B, Werner D, Müller J A, Buess C, Keel R, Kalpen A, Vontobel H-D, von Plocki K A, Auer J A, et al. 2005. Elektronische Satteldruckmessungen im Zusammenhang mit Rückenproblemen bei Pferden. PHK. 21(3):187–198.
- Peham C, Licka T, Kapaun M, Scheidl M. 2001. A new method to quantify harmony of the horserider system in dressage. Sports Eng. 4(2):95–101.
- von Peinen K, Wiestner T, von Rechenberg B, Weishaupt MA. 2010. Relationship between saddle pressure measurements and clinical signs of saddle soreness at the withers. Equine Vet J. 42:650–653.
- Werner D, Nyikos S, Kalpen A, Geuder M, Haas C, Vontobel H-D, Auer J A, von Rechenberg B. 2002. Druckmessungen unter dem Sattel: Eine Studie mit einem elektronischen Sattel-Messsystem (Novel GmbH). PHK. 18(2):125–140.