
1. Introduction
BMX Race is a sprint discipline with a race time between 30 to 40 s and a track of approximately 400 m. Because of the difficulties to overtake an opponent during the race, the start and the first straight line are crucial and have been shown to be directly correlated with rider’s final position (Rylands and Roberts, Citation2014). The start of the race includes 2.5-3 pedal strokes and race analysis has revealed that riders achieve to be at the end of the bottom ramp at an average speed of 15.2 ± 0.4 m.s−1 within 2.47 ± 0.04 s (Gross et al, Citation2017). For this reason, the ability to successfully propel the bike forward and reach a high velocity as quick as possible is crucial. Some research already concentrated on the dynamic aspect of the BMX start (Gross et al, Citation2017). They showed that torque and cadence of the first pedal stroke were more determinant than further down the ramp. Janssen and Cornelissen (Citation2017) reported that track cyclists generate a greater effective force (Fe) in the first push phase than BMX riders. The effective force is the component of the force generated tangentially to the crank that is responsible for bike propulsion. However, pedalling effectiveness remains to be studied as the lateral component of the force, which is supposedly important, could not be measured in their study. The contribution of upper body dynamics to the bike velocity during the start phase is also unknown.
The aim on this study was to analyse the interaction between the riders and their bike during the first slope of the race. More precisely, this study analyses the pedals and handlebar forces of elite riders during the first three pedal strokes of the start.
2. Methods
A total of 10 BMX elite riders, 9 men and 1 female, from the French national team participated in the study. This abstract report preliminary results based on two participants (similar level) only. Riders performed six starts on an Olympic supercross ramp (Saint-Quentin-en-Yvelines, France). Starts were performed with the electronic device, start command and gate used in international competition. Three-dimensional kinematic data were collected via a 19-camera optoelectronic system (Oqus, Qualisys).
A 3 force components sensor was integrated within each pedal (Sensix, Poitiers, France) in order to assess the 3D force exerted by the foot at the pedal. Cadence was obtained from the optoelectronic system.
Both systems were synchronized and data sampled at a 300 Hz frequency. Kinematics and forces data were low-pass (20 Hz) filtered with a fourth-order Butterworth filter. Data processing was conducted using custom Matlab (Matworks Inc, Novi, USA) routines and Opensim. The force applied to the handlebar (Fh) was estimated based on the fundamental principle of the dynamic using the forces measured on each pedal and the rider’s centre of mass acceleration. The computation of the centre of mass position resulted from the following calculations: Scaling, Inverse Kinematics and Analyse Bodykinematics. The model (Rajagopal et al, Citation2016) was scaled to match rider’s anthropometry based on a homemade markerset, in which markers were placed on anatomical landmarks and clusters on each segment.
Total force (Ft) and effective force (Fe) applied to the pedal were calculated for each pedal stroke. The index of force effectiveness (IFE) is calculated as the ratio of Fe and Ft. An IFE close to 1 means that Fe is close to Ft while an IFE of −1 means that Fe is directed oppositely to the crank rotation and is therefore resistive. The ratio between the force applied to the handlebar (Fh) and the total force applied to each pedal was calculated to compare the intensity of each force and the upper body contribution. The rate of force development (RFD) was calculated as the difference between peak effective force (of the leading leg) and resting force (before the start signal) divided by the time to achieve peak force. All forces data were normalised to body weight.
3. Results and discussion
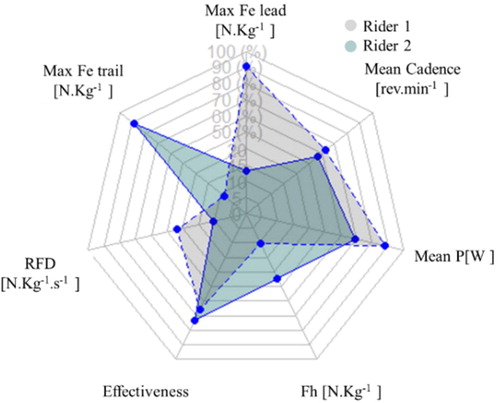
Mean pedalling cadence (62.1 ± 0.6 vs. 61.5 ± 0.7 rev.min−1), power (1488 ± 55 vs. 1369 ± 36 W), handlebar force (20.7 ± 0.7 vs. 21.9 ± 1.4 N/Kg), effectiveness (0.65 ± 0.03 vs. 0.63 ± 0.01) and RFD (50.1 ± 11.8 vs. 36.5 ± 11.8 N.Kg−1.s−1) are somewhat equivalent (.). However, rider 1 is more effective (28.1 ± 0.5 vs. 20.7 ± 0.9 N.Kg−1) on the lead leg, corresponding to the first push phase, while rider 2 is more effective (22.5 ± 0.4 vs. 16.8 ± 1.1 N.Kg−1) on the trail leg, the push phase of the second pedal stroke.
Figure 1. Comparison of dynamic parameters averaged from the six starts of two riders. 100% and 0%, refers to the maximal and minimal value observed from all the starts of the ten riders respectively.
The following step was to break down the analysis stroke by stroke. illustrates that, overall, the pedal force applied by the lead leg during the first cycle is similar for both rider in terms of magnitude and pattern.
Figure 2. Normalised total force (N.Kg−1) of the lead leg during the first pedal cycle. The chart-colour refers to the effectiveness (red = IFE of 1, blue = IFE of −1). Representative trials of two participants.
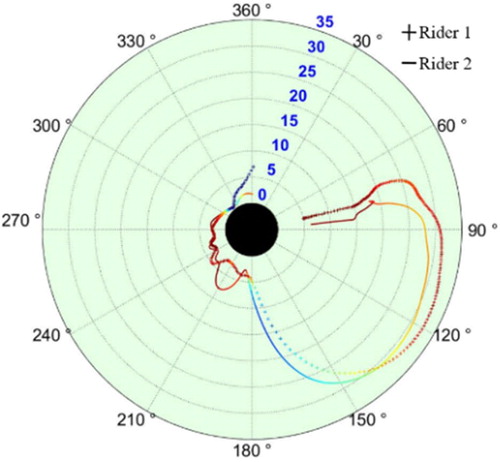
However, during the push phase [60°–180°] rider 1 is more effective than rider 2 (0.84 ± 0.05 vs. 0.74 ± 0.02). To compare our results with Janssen and Cronelissen (2017) the IFE was calculated in 2D (0.88 ± 0.01 vs. 0.86 ± 0.01).
These results are similar compared with Janssen and Cronelissen’s IFE on the lead leg during the first pedal stroke for track sprint cyclist (0.82 ± 0.04). However, the comparison between the IFE in 2D versus 3D showed that an error is made when effectiveness is calculated in 2D; the effectiveness is overestimated.
Regarding our results, the IFE in 2D from both riders are equivalent. However, regarding the IFE in 3D it is not the case. The IFE for rider 2 is raised by 0.12 ± 0.01 from the 3D computation to 2D one. This difference can be explained by looking closely at the orientation of the force. Indeed, the lateral component accounts for ∼40 and ∼26% of the total force for rider 2 and rider 1 respectively. Therefore, it is important to take into account this lateral component and its effect in generating possible error in IFE 2D so that the interpretation can be true regarding rider’s effectiveness and pedalling technique.
4. Conclusions
These preliminary results provide insights into the dynamic aspect of a BMX start. This study provides understanding into how each rider generates pedal force and a first comparison between the index of force effectiveness computation in 2D versus in 3D. This study also provides a first estimation of the force applied at the handlebar (∼ 2000 N), which corresponds to 65% of the force applied to the pedal.
Additional information
Funding
References
- Gross MAD, Schellenberg F, Lüthi G, Baker M, Lorenzetti S. 2017. Performance determinants and leg kinematics in the BMX supercross start. J Sci Cycl. 6:3–12.
- Janssen I, Cornelissen J. 2017. Pedal forces during the BMX and track sprint cycling start. Paper presented at 35th Conference of the International Society of Biomechanics in Sport, June 14–18, At Cologne, Germany.
- Rajagopal A, Dembia C L, DeMers M S, Delp D D, Hicks J L, Delp S L. 2016. Full body musculoskeletal model for muscle-driven simulation of humain gait. IEEE Trans Biomed Eng. 63(10):2068–2079.
- Rylands LP, Roberts SJ. 2014. Relationship between starting position and finishing position on World Cup BMX racing. Int J Perform Anal Sport. 14(1):14–23.