
 ?Mathematical formulae have been encoded as MathML and are displayed in this HTML version using MathJax in order to improve their display. Uncheck the box to turn MathJax off. This feature requires Javascript. Click on a formula to zoom.
1. Introduction
Brain Magnetic Resonance Elastography is usually performed in humans with 3 mm isotropic voxels at low mechanical excitation frequency, between 40 Hz and 60 Hz, to ease wave propagation deep inside the organ. Reported overall mean shear elasticity modulus expectedly increased from 2 kPa at 40 Hz to 2.5 kPa at 60 Hz (Sack et al. Citation2011; Pepin et al. Citation2018). Yet, MRE quantitation is highly conditioned by data quality and sampling as 6 to 9 voxels per wavelength were found optimal in isotropic and homogeneous media to produce valid mechanical parameters (Yue et al. Citation2017). Here, comparative low and high frequency whole-brain MRE was investigated voxelby-voxel to explicit the relationship between data quality, data sampling, excitation frequency (or mechanical wavelength), and some pitfalls of the technique.
2. Methods
Shear waves were generated in the brain at 45 Hz and 113 Hz by pressure waves guided into the buccal cavity (Tardieu Citation2014). Displacement fields were acquired for the same volunteer in a 1.5 T Achieva system (Philips, Best, Netherlands) with parameters reported in .
Table 1. Acquisition parameters.
Maps of shear dynamic and loss moduli, Gd and Gl, were extracted from the three motion-encoding directions by inversion of the Helmoltz equation of the rotational displacement field, q. T1-weighted image was used as anatomical reference and was segmented with SPM12 (UCL, United-Kingdom) to infer masks of grey and white matters after removal of CSF, bone and background tissue.
Computed maps were spatially-normalized. Data quality maps, Q = q/Δq, were calculated according to (Yue et al. Citation2017). Correlation coefficients, R45 Hz and R113 Hz, between Q and Gd, were calculated to quantify the influence of data quality onto the mechanical outcomes.
3. Results and discussion
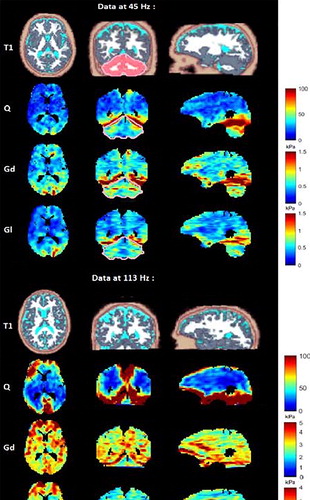
MRE SNR are 7 at 45 Hz and 14 at 113 Hz. Q, Gd, and Gl maps are represented for one of the slices along the three directions on . Mean Gd and Gl increase with the frequency excitation in the cerebrum (Cb): from
Figure 1. Brain MRE at 45 Hz (top part) and at 113 Hz (bottom part); In each part, from top to bottom: Segmented-T1 (white matter in white, grey matter in grey, CSF in cyan-color and cerebellum in red segmented from T1 map by SPM12 for data at 45 Hz (Diedrichsen Citation2006)), Q maps, Gd maps and Gl maps of the full brain in axial (1st column), coronal (2nd column), and sagittal (3rd column) view.
kPa to
kPa and from
kPa to
kPa.
These values encompass the ones found in the literature for excitation frequencies of 50 Hz () (Johnson et al. Citation2014). Mean stiffness was also calculated from the mean shear velocity according to the formula
Hz and 113 Hz for comparison with the stiffness values at 60 Hz reported in the literature (Fattahi et al. Citation2016; Huston et al. Citation2016). Mean shear stiffness values in the cerebrum were three times higher at 113 Hz than at 45 Hz (
kPa and
kPa) and
was 1.5 lower than
from the literature (). Voxel-wise, no significant mechanical differences between white and grey matters were found. Besides, we found that
and
are slightly higher in the cerebellum than in the cerebrum contrarily to most studies as summarized on . At 45 Hz, mean values of (0.8 ± 0.2) kPa and (0.6 ± 0.2) kPa were found in the cerebellum for Gd and Gl respectively. At both frequencies, maximal values were found at the 2 mm thick (Castel Citation2006) tentorial surface of the cerebellum (where Q values also reach maximal values). Elsewhere, Q is rather homogenous at 45 Hz whereas at 113, despite much higher values at the periphery of the cerebral hemispheres and cerebellum, Q falls down deep inside the brain. However, at 45 Hz, except in the cerebellum where Q > 100, Gd and Gl appear highly correlated to Q (R45Hz=0.70), whereas, at 113 Hz, they remain rather immune to Q inhomogeneity (R113Hz=0.26).
Table 2. MRE studies investigating brain regions in the cerebrum and cerebellum of healthy participants.
4. Conclusions
Q maps essentially reflect the displacement field amplitude. At 113 Hz, they are higher in the grey matter than in the white matter as mechanical waves get attenuated inside the brain. They reach higher values at 113 Hz than at 45 Hz because the SNR is twofold. Precision and accuracy of MRE data are degraded at 45 Hz by poorer shear wave sampling with about 10 voxels per wavelength whereas it is 6 at 113 Hz. Thus, lower frequency data require higher Q value, which is partly achieved, exemplarily in the cerebellum here. Higher frequency data, despite larger Q inhomogeneity, present patterns that depart from Q and therefore brain viscoelasticity is effectively provided nearly everywhere with optimal precision and accuracy.
Acknowledgements
MRE experiments were performed on the 1.5 T MRI platform of CEA/SHFJ, affiliated to the France Life Imaging network (grant ANR-11-INBS-0006).
References
- Castel J-P. 2006. L’enveloppe ostéo-durale(pdf). Campus Numérique de Neurochirurgie. Available from https://www.unilim.fr/campus-neurochirurgie/IMG/pdf/Cr_one_Rachis_LCS_-_G_R_n_R_ralit_R_s.pdf.
- Diedrichsen J. 2006. A spatially unbiased atlas template of the human cerebellum. NeuroImage. 33(1):127–138.
- Fattahi N, Arani A, Perry A, Meyer F, Manduca A, Glaser K, Senjem ML, Ehman RL, Huston J. 2016. MR elastography demonstrates increased brain stiffness in normal pressure hydrocephalus. Am J Neuroradiol. 37(3):462–467.
- Huston J, Murphy MC, Boeve BF, Fattahi N, Arani A, Glaser KJ, Manduca A, Jones DT, Ehman RL. 2016. Magnetic resonance elastography of frontotemporal dementia: MRE of frontotemporal dementia. J Magn Reson Imaging. 43(2):474–478.
- Johnson CL, Holtrop JL, McGarry MDJ, Weaver JB, Paulsen KD, Georgiadis JG, Sutton BP. 2014. 3D multislab, multishot acquisition for fast, whole-brain MR elastography with high signal-to-noise efficiency: 3D multislab, multishot whole-brain MRE. Magn Reson Med. 71(2):477–485.
- Pepin KM, McGee KP, Arani A, Lake DS, Glaser KJ, Manduca A, Parney IF, Ehman RL, Huston J. 2018. Magnetic resonance elastography analysis of glioma stiffness and IDH1 mutation status. AJNR Am J Neuroradiol. 39(1):31–36.
- Sack I, Streitberger K-J, Krefting D, Paul F, Braun J. 2011. The influence of physiological aging and atrophy on brain viscoelastic properties in humans. PLoS One. 6(9):e23451.
- Tardieu M. 2014. Élastographie par résonance magnétique et onde de pression guidée. Physique Médicale [physics.med-ph]. Université Paris Sud - Paris XI. Français. Available from: https://tel.archives-ouvertes.fr/tel-01059105/document.
- Yue JL, Tardieu M, Julea F, Boucneau T, Sinkus R, PellotBarakat C, Maître X. 2017. Acquisition and reconstruction conditions in silico for accurate and precise magnetic resonance elastography. Phys Med Biol. 62(22):8655–8670.