
1. Introduction
Running is become a social phenomenon. Consequently, numerous studies investigated the properties of running shoes, of the field, as well as the running speed or the footfall pattern in the light of performance, fatigue or injury (Horvais and Samozino Citation2013; Boey et al. Citation2017). Undoubtedly, the stance phase (i.e., the period between the initial-contact and the toe-off events) has been widely studied because it has been shown representative of the landing impact absorption and the energy restitution required to propel the runner’s center of mass (Dugan and Bhat Citation2005). The stance phase has been analyzed through different information extract from running kinematics, force reaction and acceleration (Mo and Chow Citation2018). Although recent studies were performed in real conditions, most of the knowledge has been carried out by conducting experiments in a motion analysis laboratory (Derrick et al. Citation2002). However, the analysis of running in the environment of a laboratory could be highly questionable, especially in terms of repeatability and reproducibility of the measure (Schache et al. Citation2001). The present study aims therefore at quantifying the repeatability and the reproducibility of stance phase during laboratory running.
2. Materials and methods
One healthy man was recruited (29 years, 1.83 m, 70 kg). The volunteer was casual runner, rear-foot striker and equipped with a pair of running shoes (Gel-contend 5, UE size 42.5, Asics, Kobe, Japan).
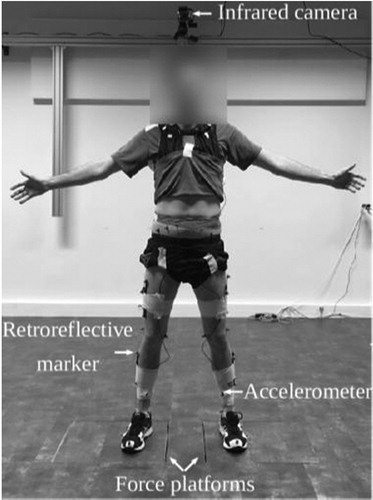
A picture of the experimental setup is presented in . In order to study the lower-limb kinematics, a 12cameras optoelectronic motion capture system (Vicon, Oxford Metrics, Yarnton, UK) was used. Motion acquisition was realized using 28 reflective markers placed on the lower-limbs. Ground reaction forces were recorded through a tri-axial force platform (OR6, AMTI, Watertown, USA). Accelerations signals were collected using a tri-axial accelerometer with an embedded datalogger (S3-1000G-HA & MWX8, Biometrics Ltd, Ynysddu, UK). The accelerometer was mounted on the distal extremity of the medial surface of the tibia with one axis following the longitudinal axis of the segment and directed upward. Motion analysis system, force platform and accelerometer were synchronized in order to record all data simultaneously. The acceleration signals, the kinematics database, and the ground reaction forces were recorded at 20000 Hz, 200 Hz, and 1000 Hz, respectively. The participant was asked to run at a constant and comfortable speed along a straight line of 10 m, and to hit the force platform with his right foot. The force platform was fixed at 5 m from the beginning of the running path. Before the measurement session, an unlimited warm-up period was provided to get familiarized to the experimental context. The participant conducted as many trials as required in order to collect ten successful trials, according to the task realization criterion (constant running speed, and visually unperturbed running pattern). The entire protocol has been reproduced once a week during six weeks.
Figure 1. Experimental setup.
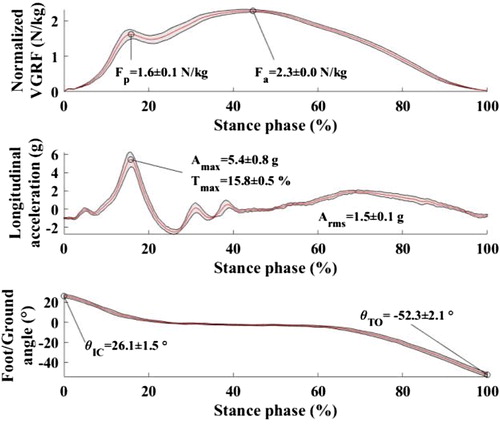
In this study, the stance phase was extracted from the dataset when the right foot vertical ground reaction force (VGRF) exceeded a threshold of 0 N. (Lee et al. Citation2010). In order to investigate the stance phase repeatability and reproducibility, discrete parameters have been extracted from the collected database. From the VGRF normalized by the participant’s mass, the values of the passive (Fp) and active (Fa) peaks were collected. From the longitudinal acceleration at the tibia, the root mean square (Arms) and the maximal (Amax) values as well as the instant were the maximal value was reached relatively to the entire the stance phase duration (Tmax) were collected. From the kinematic data, the foot/ground angle at the initial-contact (θIC) and the toe-off (θTO) instants were collected. For each parameter, a two-way analysis of variance measurements were carried out (level of significance set at p < 0.05) to highlight the effects of the trial repetitions during a session (repeatability), and the effect of the session repetition (reproducibility).
3. Results and discussions
present the averages and standard deviations of the normalized VGRF, the longitudinal acceleration, and the foot/ground angle during the stance phase computed over one measurement session. showed reasonably low standard-deviation during the stance phase regarding the three signals, conveying that the collected database was consistent. Regarding specifically the repeatability of discrete parameters across the measurements, no main effect of the trial repetition during a session was outlined for any of the parameters. However, regarding the reproducibility of measurement over the session, a significant difference was observed for the parameters Fa (F(5,69) = 10.3, p < 0.01), Arms (F(5,69) = 10.3, p < 0.01), Amax (F(5,69) = 8.6, p < 0.01), Tmax (F(5,69) = 2.5, p = 0.04), and θTO (F(5,69) = 11.7, p < 0.01), while no significant effect was observed for Fp, and θIC.
Figure 2. Average (red line) and standard deviation (black line) of the normalized VGRF, longitudinal acceleration and foot/ground angle during the ten stance phases collected during one measurement session. Gated parameters were reported on the curves.
A noticeable result was that the entire set of stance phase parameters did not vary significantly across ten consecutive trials, suggesting that they were repeatable. However, most of the stance phase parameters did vary significantly across the six measurement session, suggesting that they were not reproducible. All accelerometer descriptors seem to be impacted by the session reproduction. These results, for Arms, are contradictory to the work of Provot et al. (Citation2016) on a treadmill. These results can be explained by the fact that it is difficult to achieve, stabilize and reproduce the running speed over a short distance in a laboratory.
4. Conclusion
This study has addressed the repeatability and the reproducibility of parameters usually analyzed to investigate the biomechanics of running. The usual methods to analyze the biomechanics of running in a laboratory appeared to be consistent for a given session. However, for a given participant, this analysis was not consistent across several identical measurement sessions. As a result, although the classical running analysis performed in laboratory are relevant to point out the effect of a running condition such as the shoes or the field, it may be disputable when focusing on the human body and the risk of fatigue and injury.
References
- Boey H, Aeles J, Schütte K, Vanwanseele B. 2017. The effect of three surface conditions, speed and running experience on vertical acceleration of the tibia during running. Sport Biomech. 16(2):166–176.
- Derrick TR, Dereu D, McLean SP. 2002. Impacts and kinematic adjustments during an exhaustive run. Med Sport Sci. 34(6):998–1002.
- Dugan SA, Bhat KP. 2005. Biomechanics and analysis of running gait. Phys Med Rehabil Clin N Am. 16(3):603–621.
- Horvais N, Samozino P. 2013. Effect of midsole geometry on foot-strike pattern and running kinematics. Footwear Sc. 5(2):81–89.
- Lee JB, Mellifont RB, Burkett BJ. 2010. The use of a single inertial sensor to identify stride, step, and stance durations of running gait. J Sci Med Sport. 13(2):270–273.
- Mo S, Chow D. 2018. Accuracy of three methods in gait event detection during overground running. Gait Posture. 59:93–98.
- Schache AG, Blanch PD, Rath DA, Wrigley TV, Starr R, Bennell KL. 2001. A comparison of overground and treadmill running for measuring the threedimensional kinematics of the lumbo-pelvic-hip complex. Clin Biomech. 16(8):667–680.
- Provot T, Munera M, Bolaers F, Vitry G, Chiementin X. 2016. Intra and inter test repeatability of accelerometric indicators measured while running. Proc Eng. 147:573–577.