
 ?Mathematical formulae have been encoded as MathML and are displayed in this HTML version using MathJax in order to improve their display. Uncheck the box to turn MathJax off. This feature requires Javascript. Click on a formula to zoom.
1. Introduction
Cycling competitions take place all year round in different parts of the world. The temperatures experienced by cyclists are sometimes below zero degrees and at other times above 40 degrees. Consequences of extreme temperatures are multiple and several physiological and biomechanical factors have been identified as influencing sports performance. First of all, temperature can alter or improve physical performance by acting on the athlete’s metabolism (Launay Citation2002). Secondly, the temperature of the environment influences the aerodynamic resistance of the bicycle and the cyclist. The total resistance opposed to the movement of the cyclist and bicycle setup is therefore composed of two terms and can be written as follows:
(1)
(1)
The first term Rr corresponds to rolling resistance, the second term Ra represents the aerodynamic drag of the cyclist and bicycle setup. When the bicycle is moving in an air mass, the air layers move relative to each other in the vicinity of the moving body surface. As a result, the aerodynamic drag of the bicycle will depend on the relative speed and properties of the air (density, viscosity, compressibility) which are a function of its pressure and temperature. A lower density reduces the aerodynamic drag of the cyclist, so that the cyclist will potentially go faster for the same physical effort. Although it has been demonstrated that an increase in ambient temperature can potentially result in a gain in aerodynamic drag, studying the flow structure around a bicycle may be a real technological challenge. In this study, we have used a numerical approach which is an interesting alternative to expensive experimental methods such as wind tunnels. The aim of the study is to evaluate the effects of air temperature on the aerodynamic passive drag of the cyclist and bicycle setup. This study was performed using a commercial CFD code based on the finite volume method. The temperature range studied (-10 °C to 40 °C) is based on the temperatures recorded during international cycling competitions.
2. Methods
2.1. Geometry and meshing
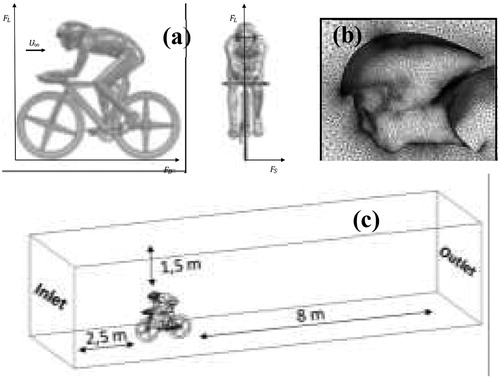
The CAD model of the cyclist was created with a high resolution laser scanner (ROMER®) that provided all the dimensional characteristics of a world-class cyclist in a time trial position. Afterwards, the cyclist was assembled with the time trial bike previously designed using CAD software. The mesh was generated using the ANSYS® Worbench Meshing software and consists of approximately 8 × 10⁶ tetrahedral and hexahedral elements of small size in the vicinity of the wall and of larger size as they approach the boundaries of the domain.
2.2. Boundary conditions
At the entrance to the computational domain, we applied a speed equivalent to that of a world-class cyclist in a time trial event (11.1 m/s or 40 km/h). At the output, we used a pressure outlet condition with a mass conservation law. On the upper and lateral surfaces of the computational domain, a symmetry condition was imposed whereas no slip condition was used on the floor and on the cyclist’s body surface. Calculations were performed in the temperature range [-10 °C; 40 °C] by increments of 10 °C. The values of density and dynamic air viscosity in the relevant temperature range are summarized in .
Table 1. Evolution of air density and dynamic viscosity at atmospheric pressure (1013 Hpa) as a function of temperature.
2.3. Computational methods
The ANSYS Fluent 18.2® commercial CFD code was used to solve the three-dimensional flow around the cyclist and bicycle setup. The flow around the cyclist being fully turbulent (9 × 10⁵ ≥ Re ≥ 1.2 × 10⁶), the Reynolds averaged Navier-Stokes (RANS) equations were solved with the standard turbulence model k-ω SST. Convergence of the results was achieved when the value of the drag coefficients no longer changed over time.
3. Results and discussion
When cyclists ride on a flat surface, aerodynamic drag has been shown to represent up to 96% of their available power (Martin et al. Citation1998). The aerodynamic forces (Lift, drag and side forces) acting on a cyclist can be divided into 3 components associated with a Cartesian coordinate system connected to the cyclist, as shown in . At racing speeds (about 15 m/s), drag, i.e., the aerodynamic resistance opposite to cyclist motion, is about 90% of the total resistance.
Figure 1. Diagram showing the aerodynamic forces (FL, FD, and FS) acting on the cyclist and the bicycle (a), Detail of the mesh around the cyclist’s head (b), Computational domain (c).
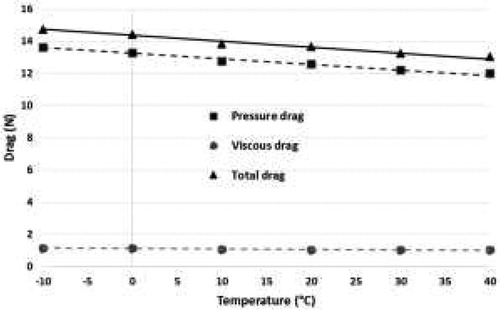
The flow around a cyclist is most often turbulent, with separate flow regions and wakes leading to increased pressure drag. shows the evolution of the viscous drag, the pressure drag and the total drag as a function of temperature. Our results confirm the preponderance of pressure drag in turbulent flow, which alone represents about 92% of the total drag. The results also suggest that the total drag decreases linearly by about 2.8% in 10 °C steps. These results are relatively close to those of Di Prampero et al. (Citation1979), which suggest that a temperature change of 3 °C will cause a 1% change in drag. As a result, we can notice a decrease in pressure drag and total drag () as the air temperature increases. Thus, the braking effect of the bicycle due to the aerodynamic drag will be less when the air temperature is high. Finally, a lower air density results in a reduction in aerodynamic drag on the cyclist, which is confirmed by our numerical results presented in .
Figure 2. Evolution of the viscous drag, pressure drag and total drag of the cyclist and bicycle setup as a function of air temperature.
4. Conclusions
The main goal of this study was to assess the influence of ambient air temperature on the aerodynamic passive drag of the cyclist and bicycle setup. The results showed that the thermophysical properties of air, intrinsic to temperature, had a significant impact on the aerodynamic performance of the cyclist and bicycle setup. It has been shown that the total drag value decreases by approximately 2.8% in 10 °C steps, which is the first analytical proof that aerodynamic drag decreases with increasing temperature. In addition, we found that the pressure drag is greater than the viscous drag, the latter accounting for about 92% of the total drag. The main finding of this study suggests that riding in a warmer environment reduces aerodynamic drag forces, which could improve performance by increasing the cyclist’s speed.
References
- Di Prampero PE, Cortili G, Mognoni P, Saibene F. 1979. Equation of motion of a cyclist. J Appl Physiol. 47(1):201–206.
- Launay J.C, Besnard Y, Guinet A, Hanniquet A.M, Bittel J, Savourey G. 2002. Thermoregulation in the cold after physical training at different ambient air temperatures. Can J Physiol Pharmacol. 80(9):857–864.
- Martin J.C, Milliken D.L, Cobb J.E, McFadden K.L, Coggan A.R. 1998. Validation of a mathematical model for road-cycling power. J Appl Biomech. 14(3):276–291.