
1. Introduction
With aging of the global population, the number of aortic flow related cardiovascular diseases (CVD) as aneurysm, dissection and atherosclerosis are increasing (Craiem et al. Citation2017). In such pathologies the part of the flow in the physio-pathological mechanism has still to be described and proven. In aneurysm, wall shear stress changes have been shown to be related to occurrence of burst (Vorp Citation2007). Additionally, wall shear stress has also been proven to be correlated with the changes in aortic tissue in ascending aorta (van Ooij et al. Citation2015; Lantz et al. Citation2011). In dissection, a study has revealed that the increase in WSS was related to alterations of the aortic morphology (Chi et al. Citation2017). The morphology of aorta as well as material properties of the wall changes with gender, age and body Surface Area (Biaggi et al. Citation2009). However the current aortic flow simulations rarely take into account the changes in the morphology (van Ooij et al. Citation2016). Additionally in vascular and thoracic surgery, description of the aortic morphology through a centreline has enable to describe a normal morphology according with the patient data. Aortic shapes description has also involved architectural concept as Gothic arch (Ou et al. Citation2006).
Thus the aim of this work is to 1) develop a simplified model of the aorta flow, 2) to parametrised the geometry of the aorta based on clinical description, 3) to assess the influence of the aortic morphology on the aortic flow and on the physio-pathological mechanism.
2. Methods
2.1. Simulations
The blood flow behaviour is analysed by Radioss CFD solver Acusolve. The surfaces were meshed using a 2D automatic meshing method with 1 mm element size and trias as mesh type. The 3D CFD tetramesh volume of the blood flow was generated with 5 boundary layers of 0.1 thicknesses in the wall and a growth rate of 1.2. This resulted in models of 149889 nodes and 471947 elements. The meshing sensitivity analysis was performed varying the mesh size of 0.5, 1 and 2 mm.
As a first step, one systolic cardiac cycle was analysed by setting the velocity of the inlet at systolic peak velocity of 1.2 m/s.
The first range of simulations was performed a transient analysis. For the boundary conditions, the inlet was defined as a peak initial velocity of 1.2 m/s distributed as an average velocity on the surface. The outlets were set as outflow, the wall was considered as rigid. The blood flow is governed by the Navier-stokes equations. The fluid was set to resemble to the blood (Newtonian fluid) with constant viscosity of 0.0045 Pa/s and a density of 1050 kg/m3 (Wei et al. Citation2019; Tokuda et al. Citation2008).
2.2. Morphology of the aorta and parametrization
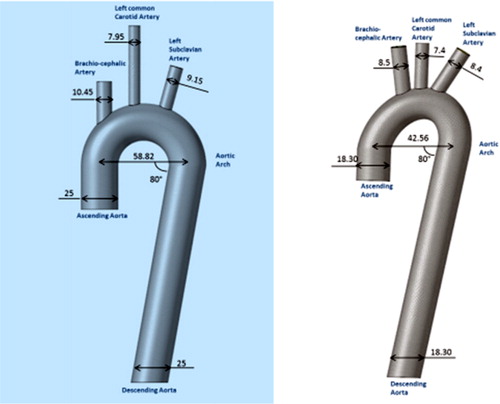
Three simplified 3 D models of the aorta were created using FreeCAD using dimensions based on articles of the literature. Identical diameters were fixed in all aortas’ segments: Ascending Aorta, Descending Aorta and the Aortic Arch (25 and 18.3 mm, ). In the first geometry, the 50 percentile of the range of geometry data was used from literature, in the second, the minimal values of the geometry data were used. In the third model, the different curvature differ as simulated by an ellipsoid as described in the article (Huetter et al. Citation2015).
Figure 1. A) Model of the Aorta with the 50 percentile dimensions of geometry data. B) Model of the Aorta with the minimal dimensions of geometry data and ellipsoidal curvature of the aortic Arch.
2.3. Data analysis and statistics
The description of the flow pattern is performed as peak systole describing the flow in the different carotids as well as in the descending aorta is developing. Wilcoxon test is used to compare velocity distributions between simulations.
3. Results and discussion
The sensitivity analysis performed on the mesh size resulted in similar results when focusing on the peak velocity between mesh size of 0.5 and 1 mm whereas the 2 mm mesh size simulation differ from those two.
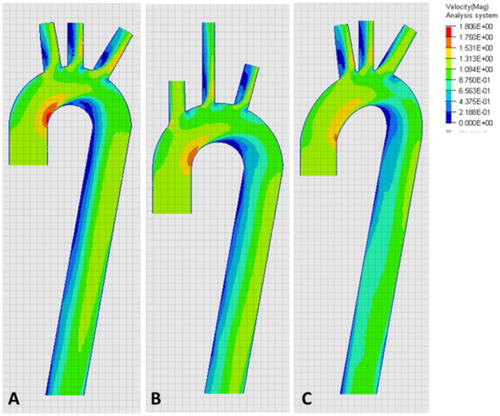
Peak velocity occurs at the maximum curvature of the aorta and developed more or less quickly on the descending aorta depending of its orientation (). Thus, a zone of lower velocities could be seen at the inner curvature of the aorta. Additionally, the flow pattern changed with the orientation of the carotid when compared to the center line of the aorta.
Figure 2. Velocity pattern. A) 50th per centile, B) minimal and C) ellipsoidal anatomy.
Results should be analysed carefully as pulsatile inlet condition and simulation of several cardiac cycle will change the flow organisation in both ascending and descending aorta. Additionally, pressure level and boundary conditions set as pressure profiles will change the depicted results.
Cardiac cycle sensitivity analysis should be performed together with fluid structure interaction simulations, patient specific anatomy taking into account the curvature in the sagittal plane and non–Newtonian study should be done in the future.
4. Conclusions
While highly preliminary, this work highlights the feasibility to simulate aortic flow depending of the aortic flow anatomy. Indeed pulsatile blood flow in developing in a detailed realistic geometry could result in a more complex flow pattern.
References
- Biaggi P, Matthews F, Braun J, Rousson V, Kaufmann PA, Jenni R. 2009. Gender, age, and body surface area are the major determinants of ascending aorta dimensions in subjects with apparently normal echocardiograms. J Am Soc Echo. 22(6):720–725.
- Chi Q, He Y, Luan Y, Qin K, Mu L. 2017. Numerical analysis of wall shear stress in ascending aorta before tearing in type A aortic dissection. Comp in Bio and Med. 89:236–247.
- Craiem D, El Batti S, Casciaro ME, Mousseaux E, Sirieix M-E, Simon A, Alsac J-M. 2017. Age-related changes of thoracic aorta geometry used to predict the risk for acute type B dissection. Int J of Cardiol. 228 :654–660.
- Huetter L, Geoghegan PH, Docherty PD, Lazarjan MS, Clucas D, Jermy M. 2015. Application of a meta-analysis of aortic geometry to the generation of a compliant phantom for use in particle image velocimetry experimentation. IFAC Online. 48(20):407–412.
- Lantz J, Renner J, Karlsson M. 2011. Wall shear stress in a subject specific human aorta: influence of fluid-structure interaction. Int J Appl Mech. 3(4):759–778.
- Ou P, Mousseaux E, Celermajer DS, Pedroni E, Vouhe P, Sidi D, Bonnet D. 2006. Aortic arch shape deformation after coarctation surgery: effect on blood pressure response. J Thorac Cardiovasc Surg. 132(5):1105–1111.
- Tokuda Y, Song M-H, Ueda Y, Usui A, Akita T, Yoneyama S, Maruyama S. 2008. Three-dimensional numerical simulation of blood flow in the aortic arch during cardiopulmonary bypass. Eur J Cardiothorac Surg. 33(2) :164–167.
- van Ooij P, Garcia J, Potters WV, Malaisrie SC, Collins JD, Carr JC, Markl M, Barker AJ. 2016. Age-related changes in aortic 3D blood flow velocities and wall shear stress: implications for the identification of altered hemodynamics in patients with aortic valve disease. J Magn Reson Imag. 43(5):1239–1249.
- van Ooij P, Potters WV, Nederveen AJ, Allen BD, Collins J, Carr J, Malaisrie SC, Markl M, Barker AJ. 2015. A methodology to detect abnormal relative wall shear stress on the full surface of the thoracic aorta using 4D flow MRI. Magn Reson Med. 73(3):1216–1227.
- Vorp DA. 2007. Biomechanics of abdominal aortic aneurysm. J Biomech. 40(9):1887–1902.
- Wei W, Evin M, Rapacchi S, Kober F, Bernard M, Jacquier A, Kahn CJF, Behr M. 2019. Investigating heartbeat-related in-plane motion and stress levels induced at the aortic root. Biomed Eng Online. 18(1):19.