
1. Introduction
Physiotherapy is a health care profession based on movement assessment and treatment. Mechanical Diagnosis and Therapy (MDT) is a reliable and efficient system using repeated end-range movement to modify signs and symptoms among patients with musculoskeletal disorders (McKenzie and May Citation2003). The effect of repeated end-range exercise on pain has been widely reported for low back pain subjects (May et al. Citation2018). However, visible changes in the range of motion, movement pattern, or static position (e.g. spine lordosis) accompany pain improvement. These changes have never been studied.
Epionics SPINE (ES) is a measurement system using strain gauges to assess sagittal spinal movement. It is a reliable (Taylor et al. Citation2010), valid (Consmüller et al. Citation2012), and frequently used way of getting quantitative data on the spine mechanical function.
Motion Capture Analysis (MCA) is another system of movement analysis based on camera and reflective markers located on the experimental subject.
We aim to use ES and MCA to assess the change in the range of motion, movement pattern, or static position of patient suffering from low back pain treated with a MDT approach. We also aim to link these changes to the pain variation measured with a specialized pain mapping software (Rigoard et al. Citation2015).
This work will present the data gathered during the first feasibility experience.
2. Methods
2.1. Population
For this first pilot study, we included 2 subjects, one pain-free subject (subject 1) and one low back pain subject (subject 2, 2 months of symptom duration).
2.2. Movement protocol
We assessed static lordosis, maximal flexion, extension, left and right lateral gliding, and walking on 10 m (3 way and back) before and after each MDT session.
We had two sessions of repeated end-range movements based on the following protocol:
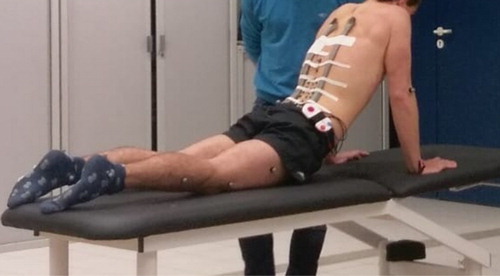
Extension test: the patient lied on the stomach and pushed on his arms to extend the low back at the end range. During the second set, the subject added a deep breath to sag into the end range. Both sets were repeated 20 times (they could be broken into two sessions because of arm fatigue) ().
Figure 1. Position of markers and measurement systems during extension test.
Flexion test: the patient was sitting on the edge of a chair and flexed the trunk forward, under the chair, for 20 repetitions. During the second set, the patient grabbed the feet of the chair to accentuate the flexion.
2.3. Measurement system
ES device consists of two bands in which 12-train gauges are assembled in series. We fixed this system using deformable plastic tube and tape band. We also placed reflective markers of the MCA (Qualisys system) on the subjects’ low back and lower limbs following the Conventional Gait Model and the model proposed by Ben Mansour et al. (Citation2012).
The analysis was performed using R language through a Rstudio interface (version 1.1.463).
3. Results and discussion
The lumbar curves obtained during the three maximal flexion assessments for the pain-free subject are plotted on . For the three trials, the flexion and extension phase present a velocity of 27, 35, 43 for flexion and −58, −72, −66; for the extension, in °/s, respectively for flexion before test, after extension and flexion. The angular velocities were calculating based on a linear model function of the five values surrounding the 0-degree landmark. The lumbar curve by itself was similar to those published in previous study using Epionics SPINE (Taylor et al. Citation2010; Consmüller et al. Citation2012).
Figure 2. Lumbar curves during the 3 maximal flexion trials for the pain-free subject.
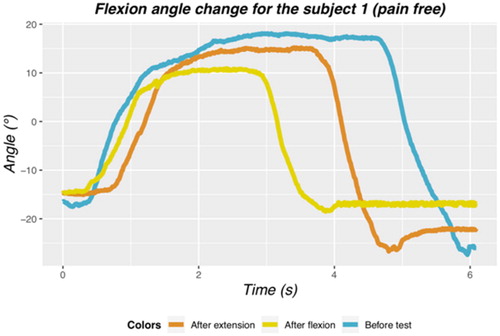
The maximum flexion angle was calculated by averaging the values of the plateau. The maximal angle slightly decreased from 17° to 15° after the extension test, to 10.4° after the flexion test. These results are surprising for a pain-free subject, we would expect either a stable angle or a small increase with movement due to tissue warming. These results could be imputable to the measurement device fixation.
Unfortunately, we had some aberrant data into the assessment and reassessment process (before and after repeated movement). This made the analysis and interpretation very hazardous. We had several hypotheses to explain this phenomenon:
The way we used the device was suboptimal. With the swelling and the movement, the tape did not stare during the whole experience. Therefore, sensors moved a lot during and between the session.
We did not standardize enough the protocol especially regarding the instruction given to the subject and the encouragement provided by the observer…
The MCA data will be fully described in another publication.
The pain mapping of the subject with back pain reveals a clear directional preference pattern. The pain decreases from a 149cm2 surface and a 2/10 intensity to 24cm2 and 0.5/10 after the extension test. The pain increases to 70cm2 while intensity stays the same after the flexion test. ES measurement for this subject was of too low quality for an interpretation because of sensors fixation issues. The low level of pain of the subject was another limitation. Pain mapping method has been fully described elsewhere (Rigoard et al. Citation2015).
4. Conclusions
Both MCA and EPS are relevant in the measurement of low back pain movement before and after physiotherapy assessment and treatment. Nonetheless the experimental process should be more standardized, and devices used with better fixation system. This process needs to be confirmed with another higher cohort of pain-free subjects, to validate its reliability, before this protocol to be applied to low back pain patients.
References
- Ben Mansour K, Dao T.T, Ho Ba Tho M-C, Marin F. 2012. A non invasive protocol for the estimation of 3d lumbar spine shape in standing position. J Biomech. 45(S1):S598.
- Consmüller T, Rohlmann A, Weinland D, Druschel C, Duda G.N, Taylor W.R. 2012. Comparative evaluation of a novel measurement tool to assess lumbar spine posture and range of motion. Eur Spine J. 21(11):2170–2180.
- May S, Runge N, Aina A. 2018. Centralization and directional preference: an updated systematic review with synthesis of previous evidence. Musculoskelet Sci Pract. 38:53–62.
- McKenzie R, May S. 2003. The lumbar spine: mechanical diagnosis and therapy. Auckland, NZ: Spinal Publications.
- Rigoard P, Nivole K, Blouin P, Monlezun O, Roulaud M, Lorgeoux B, Bataille B, Guetarni F. 2015. A novel, objective, quantitative method of evaluation of the back pain component using comparative computerized multi-parametric tactile mapping before/after spinal cord stimulation and database analysis: The “Neuro-Pain’t” software. Neurochirurgie. 61:S99–S108.
- Taylor W.R, Consmüller T, Rohlmann A. 2010. A novel system for the dynamic assessment of back shape. Med Eng Phys. 32:1080–1083.