
 ?Mathematical formulae have been encoded as MathML and are displayed in this HTML version using MathJax in order to improve their display. Uncheck the box to turn MathJax off. This feature requires Javascript. Click on a formula to zoom.
Abstract
Subject-specific musculoskeletal model use in clinical settings is limited due to development-associated time and effort burdens together with potential medical imaging unavailability. As an alternative, this study investigated consistency in estimating longitudinal changes in joint contact forces (JCF) between scaled generic and subject-specific models. For 11 children, joint kinematics and JCF were calculated using subject-specific and scaled generic models. JCF changes estimated by both models were strongly correlated for the hip and knee although JCF estimates varied between models. Findings suggest that within specified limits of accuracy, scaled generic models are sensitive enough to detect JCF changes consistent with subject-specific models.
Introduction
Three-dimensional gait analysis (3DGA), based on optoelectronic and force platform data, has become a mainstay in the study of human movement musculoskeletal disorders, providing useful information to guide treatment planning and rehabilitation (Baker et al. Citation2016; Wesseling et al. Citation2017). Most recent literature has shown that the utility of conventional 3DGA can be further augmented with musculoskeletal models (MSK)( Kainz et al. Citation2019; Montefiori et al. Citation2019b). These are mathematical representations of the body as a system of rigid bodies linked in a chain by joints and constraints and actuated by muscle forces. This formulation lends itself to rigid multibody dynamics and simulation that provides information such as estimates of changes in muscle length, muscle force and joint contact force that are not available using conventional 3DGA or would require the use of some instrumented prosthesis.
Most commonly used MSK models, typically referred to as scaled generic models, are based on data extrapolated from cadaveric specimens of healthy adults (Delp et al. Citation1990; Arnold et al. Citation2010; Modenese et al. Citation2011) which are scaled based on markers or anthropometry to match a subject. This poses a challenge when dealing with different populations, such as children and those with pathologic conditions (Duda et al. Citation1996; Bosmans et al. Citation2015, Citation2016). Imaging modalities such as Computed Tomography (CT) and Magnetic Resonance Imaging (MRI) have been used to address this challenge by allowing for the increase in personalisation of these models through the inclusion of subject-specific details like bone geometry (Lenaerts et al. Citation2009), muscle paths and attachment (Scheys et al. Citation2008; Bosmans et al. Citation2015), as well as estimates of musculotendon parameters (Correa and Pandy Citation2011; Hainisch et al. Citation2012). This personalisation has been proven to increase the accuracy and reliability of these MSK models (Blemker et al. Citation2007; Lenaerts et al. Citation2009). Nonetheless, subject-specific models created in this way have cost and time burdens which limit their use in clinical settings (Valente et al. Citation2014). In addition, medical imaging may not be feasible or available, especially when conducting retrospective studies. In such instances, if sensitive enough to detect changes that are bigger than their expected limits of accuracy, generic models might represent a relatively easily implementable substitute.
A number of studies have compared the performance between generic models and image-based subject-specific models and concur that differences exist between the biomechanical measures estimated. When investigating a normal and a pathologic gait condition, Scheys et al. (Citation2008) found that differences existed between the moment arms and muscle-lengths estimated by the two types of models for 16 major muscles of the lower limb for each gait condition. For most of the muscles however, the changes in muscle length and moment arm estimates was found to be similar for the two approaches, for both normal and pathologic gait. Similarly, Correa et al. (Citation2011) found significant differences in muscle moment arms when comparing generic and subject-specific models but also reported that both models were consistent in their predictions of muscle action. Muscle forces contribute to the magnitude of joint contact forces (JCFs) and differences are therefore expected to be observed in JCF estimates between the two models. However, it remains unclear to what extent these differences impact on longitudinal estimates of changes in the biomechanical variables predicted by generic models and how they differ from those predicted from subject-specific models. The aim of this study was to examine the suitability of using scaled generic models to predict longitudinal changes in biomechanical measures and how these predictions differ from those obtained from subject-specific models in a juvenile population. We hypothesised that despite differences in instantaneous estimates of JCFs, there would be no difference in the change in calculated JCF over time between models. If this hypothesis holds true, scaled generic models could be used to infer clinically meaningful information where interest is in change over time as opposed to absolute estimates such as in predicting or evaluating surgical outcomes, hence suggesting the feasibility of using them as alternative to the more accurate subject-specific models.
Materials and methods
Data collection
Data from 11 participants (age at initial observation: mean 11.5 (SD 3.2) years) were extracted from a dataset collected during the MD-PAEDIGREE project, which aimed at investigating disease progression in children with Juvenile Idiopathic Arthritis (JIA)(Montefiori et al. Citation2019b). Subject anthropometry was recorded at an initial observation (mass: 46.5 ± 18.0 kg, height: 1.4 ± 0.2 m) and at twelve months follow-up (mass: 51.4 ± 20.5 kg, height: 1.5 ± 0.2 m). Approval was obtained from the research ethics committees of the hospitals from which the data was collected. Gait data were collected over two observations (M0 and M12, 12 months apart) and across two laboratories, one using a 6-camera setup (BTS, SmartDX, 100 Hz) with two force plates (Kistler, 1 kHz) and the other, an 8-camera system (Vicon, MX, 200 Hz) with two force plates (AMTI, OR6, 1 kHz). The Vicon PlugIn gait protocol (Vicon Motion Systems) augmented with the modified Oxford Foot Model (Stebbins et al. Citation2006) formed the set of forty-four markers used. Regional MRI of the foot and ankle was acquired for each participant at the two observations (M0 and M12) using a multi-slice multi-echo 3 D Gradient Echo (mFFE) with water only selection (0.5 mm in plane resolution and 1 mm slice thickness). MRI was also used to acquire entire lower limb images at an intermediate timepoint (six months from initial observation) using a 3 D T1-weighted fat-suppression sequence. In-plane resolution was 1 mm with a slice thickness of 1 mm. These images were used to clinically evaluate bone erosion and cartilage damage (Montefiori et al. Citation2019a).
Modelling approaches
Subject-specific bone geometries for the two timepoints were obtained by a single expert operator segmenting MRI images of the full lower-limb together with the regional foot and ankle images from each observation point, respectively. The full lower-limb geometries for each participant were subsequently coupled with the regional geometries to build subject-specific models (SubS) for each observation using NMSBuilder (Valente et al. Citation2017). For each SubS model, the hip was modelled as an ideal ball-and-socket joint, with ideal hinges for the knee, ankle and subtalar joints. The joint axes were defined by morphological fitting of articular surfaces isolated from the bone geometries, using a least square difference minimization approach. A supervised atlas registration procedure with a reference model (Delp et al. Citation1990) was used to estimate muscle attachments and via points, with manual adjustment against the MRI when needed. The maximum isometric force for each muscle in the SubS model were linearly scaled using the ratio of participant lower-limb mass, calculated as the product of the soft tissue volume and bone volume and their respective densities from the literature (White et al. Citation1987), and the lower limb mass of a generic model (Delp et al. Citation1990). Further details for generating the SubS are provided in Modenese et al. (Citation2018) and Montefiori et al. (Citation2019a).
The cadaver-based generic gait2392 model (Delp et al. Citation1990) formed the basis of the scaled generic models (Gen). The gait2392 model was scaled by each subject’s mass and anthropometry based on experimental markers placed on anatomical landmarks and estimated joint centres using the Scale tool in OpenSim 3.3 (Delp et al. Citation1990; Citation2007). Scaling was based on literature recommendations (Hicks et al. Citation2015; Kainz et al. Citation2017) using Harrington regression equation estimates of the hip joint centre (Harrington et al. Citation2007), midpoint of medial and lateral epicondyle and malleolus markers for the knee and ankle joint centres, respectively. Maximum isometric force of each muscle was scaled by the mass of the subject divided by the mass of the gait2392 model. Optimal fibre length was scaled to preserve the muscle-tendon length ratio in the gait2392 model. The Gen models consisted of a single lower limb model with 12 degrees of freedom (DoF) for consistency with the SubS which were unilateral.
Simulations were subsequently performed in OpenSim 3.3 using a minimum of three collected experimental gait trials for each participant. The OpenSim simulation pipeline included inverse kinematics, inverse dynamics, static optimisation and joint reaction analysis (Steele et al. Citation2012). For each model and observation, joint angles, joint moments, muscle forces and JCFs were obtained. In line with best practice, maximum root mean square tracking error and peak marker tracking error between experimental marker trajectories and virtual markers for each model were kept below the recommended 20 mm and 40 mm thresholds (Hicks et al. Citation2015), respectively for inverse kinematics. Static posture joint angles were considered as a zero reference in comparing kinematic outputs between the two models. Joint powers were calculated as the product of joint moment and angular velocity. The muscle force-length-velocity relationship was ignored for both models during the estimation of muscle activation and force during static optimisation. Simulated joint moments and JCFs were normalised by participant body weight (BW). The dynamic consistency of the simulations was assessed for both models as recommended (Steele et al. Citation2012; Hicks et al. Citation2015) with the values of residual moments applied at the pelvis which were less than 10% of the product of BW and height for all subjects. Residual forces were similarly less than 10% of BW with the exception of Fy. This was due to the lack of general actuators in the model to provide an equilibrating effect of force and moment on the pelvis in the absence of a torso and contralateral leg (Modenese and Phillips Citation2012).
Differences between Gen and SubS models
Group mean and standard deviation for each estimated variable were determined as the average of ensemble means of subject trials for all subjects for both models. Joint angles, joint moments, joint power, JCF and differences in JCF (ΔJCF) at the hip, knee and ankle were compared between models and observations using the nonparametric one sample paired t-tests from the spm1d statistical parametric mapping (SPM) package (Pataky Citation2012) in MATLAB (v9.5.0, R2018b, MathWorks, USA). Significance was evaluated at α < 0.05.
For the JCFs, total waveform variability or goodness of fit was assessed using the Root Mean Square Deviation (RMSD) (Picerno et al. Citation2008) between Gen and SubS for each subject at each observation. The percentage difference (%Diff) in JCF estimates was calculated as the ratio of RMSD to range of JCF predicted by the SubS model for each participant.
The coefficient of determination (R2) was calculated using the Linear Fit Method to assess waveform shape similarity (Iosa et al. Citation2014) of JCF estimates over the gait cycle between Gen and SubS for each participant. This method can be used as a robust measure of curve similarity in the analysis of gait data (Di Marco et al. Citation2018). Peak values of JCF during the loading response (P1, indicated as occurring within the first 20% of the gait cycle) and push off (P2, indicated as occurring between 40 to 60% of the gait cycle) for both models were extracted for each participant and analysed. Area under the JCF curves (AUC) were also calculated as measures of overall loading of the joint throughout the gait cycle and compared between the two models. A graphical representation of the different indices used is presented in the supplementary materials.
Consistency in longitudinal predictions
Inter-observation differences (Δt) between the values of JCFs, AUC and JCF P1 and P2 were calculated for each participant’s Gen and SubS model to assess their agreement in estimating longitudinal changes. Inter-model differences (Δm) for these metrics at each observation were similarly calculated for each participant. Gen and SubS were judged as in agreement in predicting longitudinal changes in JCFs if the coefficient of determination R2 calculated between Δt(JCFGen) and Δt(JCFSubS) was greater than or equal to 0.6.
It has been previously reported that SubS output is affected by repeatability errors associated to operator input (Montefiori et al. Citation2019b). In order to account for this when assessing the differences between the two models, ad-hoc thresholds were calculated for hip (H), knee (K) and ankle (A) joints using publicly available data (Montefiori et al. Citation2019b): Δm(AUCH) = 29.17, Δm(AUCK) = 7.88, Δm(AUCA) = 4.42, Δm(P1H) = 0.45 BW, Δm(P2H) = 1.27 BW, Δm(P1K) = 0.36 BW, Δm(P2K) = 0.64 BW and Δm(P1A) = 0.94 BW. If corresponding Δm(JCF peaks) and Δm(AUC) were lower than these thresholds at both observations, then the longitudinal output from the two models were considered to be in agreement for that participant. If the differences between the two models were bigger than these thresholds for at least one of the observations, then the differences (Δt) obtained for the two models were considered as being in agreement if consistent in signs.
Finally, significance of inter-model and inter-observation differences in estimates of RMSD, JCF peak values and area under JCF curve were assessed with the Wilcoxon signed-rank test in MATLAB. Effect size statistics for these estimates was also calculated using Cohen’s d estimate with a pooled standard deviation from SubS and Gen. All statistical tests were conducted at α < 0.05.
Results
Assessment of MRI images did not highlight any clinically meaningful changes in bone erosion and cartilage damage between the two time points.
Estimates of joint kinematics, moments and power in the sagittal plane at all observations and for all participants are presented as supplementary figures. Profile shapes of these estimates over the whole gait cycle were overall similar between the models, although there existed significant (P < 0.05) differences at instances in the gait cycle. The JCFs estimated by the two models showed similar waveform profile ().
Figure 1. Comparison between Gen (red) and SubS (blue) model estimations of joint contact forces at observations M0 and M12. Black bars indicate region of gait cycle with significant statistical difference between the two models at P < 0.01.
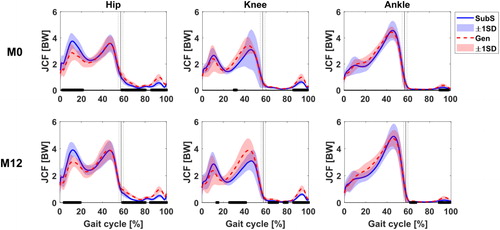
The Gen tended to have lower estimates (average difference of 0.8 BW) of hip JCF during the loading response. This difference was found to be significant at both observed timepoints (P < 0.001 at both M0 and M12). JCF estimates were generally similar at the ankle with some significant differences reported during the stance phase of the gait cycle. The Gen also estimated higher JCF at the knee during push off (P2); this was however found to be not significant. The higher P2 prediction at the knee by the Gen was coincident with the prediction of a higher gastrocnemius medialis muscle force (see supplementary material) by the Gen in the same phase of the gait cycle.
Differences in JCF between the Gen and SubS were then analysed for each of the three joints (). Group median RMSD results ranged from 0.30 to 0.60. These values were similar for M0 and M12 with no statistical difference between RMSD values recorded at the two timepoints. The largest mean RMSD was recorded at the knee with a value of 0.59. The knee also had the largest variability between participants’ RMSD as indicated by its standard deviation. Similar trends were observed when looking at %Diff, where the knee values doubled those at the ankle.
Table 1. Inter-model analysis of gait waveform profile at M0 and M12.
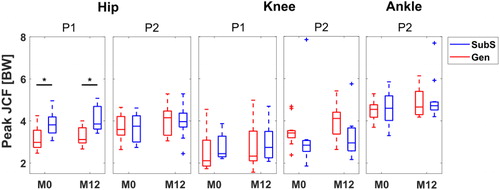
The coefficient of determination values () were greater than 0.7 for all participants, with the highest correlations observed at the ankle (higher than 0.9) indicating a very strong linear relationship between JCF predictions between the Gen and SubS. Again, estimates at the knee showed the widest range of values. The comparison of selected peaks highlighted a large inter-subject variability in differences between the two models, however the hip loading response peak, P1, was consistently and significantly lower in the Gen than in the SubS (P(M0) = 0.006, P(M12) = 0.002, ). Further, Cohen’s d values (-1.31 and -1.48 for P1 and P2, respectively) suggested a high relevance of this difference.
Figure 2. Boxplot distribution of P1 and P2 JCF estimates for scaled generic and subject-specific models at two observations, M0 and M12. * indicates significant difference at P < 0.05.
Comparison of longitudinal differences in JCF, Δt(JCF) estimates for each model revealed that the Gen reported higher mean differences than the SubS for the hip and ankle joint although this did not reach significance. Peak Δt(JCF) was lower at the hip for the Gen compared to the SubS. Both models showed an overall increase going from M0 to M12 in maximum values of Δt(JCF) for all joints (hip: 0.9 (0.3) BW, 1.0 (0.3) BW; knee: 0.8 (0.3) BW, 0.7 (0.3) BW; ankle: 1.0 (0.8) BW, 0.9 (0.6) BW for Gen and SubS, respectively).
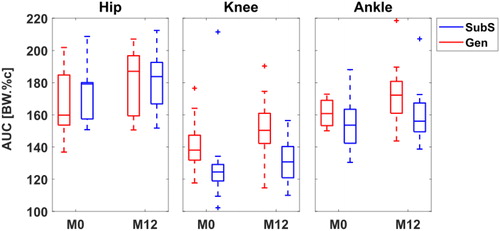
A large within group variability (maximum SD: 28.5 BW.%c) was observed for the overall joint loading (AUC, ) measures, particularly at the hip and at the ankle, for both Gen and SubS. No group differences were found for these values, even if a tendency was observed at the knee, where SubS predictions of JCF at both time points tended to be on average, 10% lower than that of Gen, with higher estimates (>40%) from SubS observed only for one subject (still true at both time points).
Figure 3. Boxplot distribution of overall joint loading estimates calculated as area under BW-normalised JCF curve. AUC expressed as BW*%Gait Cycle (BW.%c).
Inter-model differences (Δm) at the knee were observed for the majority of participants at both time points when considering the AUC and JCF peaks whereas the opposite was true for all joints, looking at the waveform correlation between model predictions of JCF ( and ).
Table 2. Inter-model differences in participant estimates at M0.
The matrix in shows an overall good agreement between predictions from the two models for most of the subjects, except for the R2 that at the ankle showed a disagreement for about half of the participants.
Table 3. Inter-model differences in participant estimates at M12.
Table 4. Agreement in longitudinal changes (M12 - M0) in selected metrics between Gen and SubS predictions of JCF for each of 11 participants.
Discussion
The aim of this study was to evaluate the consistency in measures of JCF and JCF changes over time, using subject-specific (SubS) and scaled generic (Gen) MSK models applied to 3 D gait data from a group of children with Juvenile Idiopathic Arthritis.
Several indices have been used by different authors to analyse the temporal curves usually obtained from gait data, with some looking into distinct parameters such as the mean value at a specified event, while others look at how a parameter of interest changes over the whole cycle (Kadaba et al. Citation1989; Chau Citation2001; Picerno et al. Citation2008; Di Marco et al. Citation2018). These different approaches yield complementary information associated to changes in peak values, amplitudes and phases of the curves which can all be of interest, depending on the outcome (e.g., maximum force vs impulse). For this reason, in this study indices from both groups were used to capture the salient features of the subject gait as well as any time-dependent patterns in the data.
Within sessions, the outputs of the two models were similar in terms of range of motion and waveform profiles of joint angles, net joint moments and powers, despite the significant differences observed when looking at individual time instances between models over the gait cycle. Kainz et al. (Citation2018) also found similarities when comparing joint kinematics and kinetics between scaled generic and MRI-based models of typically developing children. As expected in this study, differences were likewise observed in the JCF profiles and estimates between the two models, in line with what has generally been reported in the literature (Lenaerts et al. Citation2008; Scheys et al. Citation2008; Valente et al. Citation2014; Song et al. Citation2019). In particular, the range of JCF estimates observed for both models were comparable to values reported by other studies for the hip (Carriero et al. Citation2014), knee (Valente et al. Citation2014) and ankle (Prinold et al. Citation2016). The mean JCF peaks were also comparable to previous independent work conducted on a subset of children from the same cohort at a different time point observation (Modenese et al. Citation2018). Differences observed between the models likely originate from the personalisation of muscle origin and insertion points as well as joint centre and axis locations, both in children (Kainz et al. Citation2018) and adults (Scheys et al. Citation2008). An assessment of some selected muscle forces estimated by both models showed a general concurrence in timing of activity and magnitude during the gait cycle for most muscles (see supplementary data). As per the JCFs, the differences in calculated muscle forces between the two models remained similar across observations for all muscles, which was unsurprising, since muscle forces are known to be the main contributors to JCF (Correa et al. Citation2010) predictions.
When looking at specific points on the JCF loading profiles (), lower hip loading response peaks (P1) were predicted by the Gen compared to the SubS. This is in contrast with what was reported by Wesseling et al. (Citation2016), in a sample of adult subjects. An explanation for this disagreement could be the different methods used to calculate the maximal isometric force for Gen and SubS models in this study, this was kept the same for both models by Wesseling et al. However, it has been previously suggested that this should not have a significant influence on output muscle force and JCF estimates (Valente et al. Citation2014; Wesseling et al. Citation2016; Modenese et al. Citation2018). Further study would be needed to further explore this specific aspect.
A large variability between subjects was observed for the JCFs at all the joints, particularly at the knee when using SubS models. This high between-subject variability was in line with what was previously found when looking at joint kinematics, moments and knee JCF in a larger group from the same cohort (Montefiori et al. Citation2019a, Citation2019b). This may be attributable to participants adopting a variety of loading strategies to attenuate pain or discomfort resulting from swelling or inflammation of their joints (Montefiori et al. Citation2019b). This variability was partially masked by the scaled model with a reduced between subject variability indicating its less sensitive inter-subject nature. We similarly observed larger between model differences in AUC at the knee ( and ), but these were expected since the SubS was implemented to have a simplified knee joint (extension/flexion) compared to the Gen which had an additional prescription of tibial translation as a function of knee joint angle. Nonetheless, the latter was able to capture longitudinal changes at individual level consistently with the subject specific model for the hip and knee especially, as suggested by the results of the agreement matrix (). Taking the knee for example, although predictions of AUC were different between models at each observation, a majority of participants had Δt(AUC) in agreement in terms of whether there was an increase or decrease.
Comparing the differences between the JCF profiles estimated at the two time points for each of the models, it was observed that Gen and SubS provided consistent information in terms of increased or decreased JCFs between different phases of the gait cycle going from M0 to M12, even if these changes were of different magnitude. The difference in magnitude was particularly prominent at the ankle, which also explains why the number of participants with between model agreement (Totg) for R2[Δt(JCF)] () was the lowest for this joint. This was despite the observation that predictions of JCFs at the ankle had the most highly correlated waveforms between models at each observation. At group level, no statistically significant difference in longitudinal change in JCFs between Gen and SubS was observed. Overall, these results indicate that both models were able to account for changes in the JCFs likely attributable to changes in the patient’s pathological condition.
The sample size involved in this study is small, although larger than other studies comparing generic and image-based subject-specific models (Correa et al. Citation2011; Bosmans et al. Citation2015; Wesseling et al. Citation2016; Kainz et al. Citation2018). Moreover, the investigated group is a good representation of a very heterogeneous patient population (Montefiori et al. Citation2019b), as also indicated by the reported between subject variability in calculated JCF, which may be considered an advantage in terms of applicability of the reported results. It must be acknowledged, however, that even if Juvenile Idiopathic Arthritis might cause bone deformities, these were not evident in the investigated group of children and no clinically meaningful longitudinal changes emerged from the analysis of their MRIs. This does of course limit the generalisability of the reported results to populations with large bony deformities. The inability of scaled generic models to account for significant anatomical alterations, such as increased femoral anteversion or tibial torsion, have been reported to impact significantly on predictions of moment arm lengths (Scheys et al. Citation2008).
The SubS was considered as the gold standard in this study as it is assumed to be more representative of the subject’s anatomy than the generic models. This assumption of course has its limitations such as errors in operator input but was the only one possible due to the unavailability of longitudinal data from instrumented prosthesis, especially for children.
Conclusion
In conclusion, this study evaluated the consistency between scaled generic and subject-specific model estimates of longitudinal changes in JCF for a population of children with JIA. By using different metrics for reporting JCF, it was shown that even if the estimates of JCF can be highly different at a single timepoint, the two models showed agreement when calculating the longitudinal difference in joint contact forces, particularly at the hip. It is hence suggested, albeit with caution, that scaled generic models can be used as an initial and easily implementable modelling approach when interest is in trends rather than exact estimates.
Acknowledgement
Claude Fiifi Hayford is a Commonwealth Scholar, funded by the UK government.
Disclosure statement
No potential conflict of interest was reported by the author(s).
Additional information
Funding
References
- Arnold EM, Ward SR, Lieber RL, Delp SL. 2010. A model of the lower limb for analysis of human movement. Ann Biomed Eng. 38(2):269–279.
- Baker R, Esquenazi A, Benedetti MG, Desloovere K. 2016. Gait analysis: clinical facts. Eur J Phys Rehabil Med. 52(4):560–574.
- Blemker SS, Asakawa DS, Gold GE, Delp SL. 2007. Image-based musculoskeletal modeling: applications, advances, and future opportunities. J Magn Reson Imaging. 25(2):441–451.
- Bosmans L, Jansen K, Wesseling M, Molenaers G, Scheys L, Jonkers I. 2016. The role of altered proximal femoral geometry in impaired pelvis stability and hip control during CP gait: a simulation study. Gait Posture. 44:61–67.
- Bosmans L, Valente G, Wesseling M, Van Campen A, De Groote F, De Schutter J, Jonkers I. 2015. Sensitivity of predicted muscle forces during gait to anatomical variability in musculotendon geometry. J Biomech. 48(10):2116–2123.
- Carriero A, Zavatsky A, Stebbins J, Theologis T, Lenaerts G, Jonkers I, Shefelbine SJ. 2014. Influence of altered gait patterns on the hip joint contact forces. Comput Methods Biomech Biomed Engin. 17(4):352–359.
- Chau T. 2001. A review of analytical techniques for gait data. Part 1: Fuzzy, statistical and fractal methods. Gait Posture. 13(1):49–66.
- Correa TA, Baker R, Graham HK, Pandy MG. 2011. Accuracy of generic musculoskeletal models in predicting the functional roles of muscles in human gait. J Biomech. 44(11):2096–2105.
- Correa TA, Crossley KM, Kim HJ, Pandy MG. 2010. Contributions of individual muscles to hip joint contact force in normal walking. J Biomech. 43(8):1618–1622.
- Correa TA, Pandy MG. 2011. A mass-length scaling law for modeling muscle strength in the lower limb. J Biomech. 44(16):2782–2789.
- Delp SL, Anderson FC, Arnold AS, Loan P, Habib A, John CT, Guendelman E, Thelen DG. 2007. OpenSim: open-source software to create and analyze dynamic simulations of movement. IEEE Trans Biomed Eng. 54(11):1940–1950.
- Delp SL, Loan JP, Hoy MG, Zajac FE, Topp EL, Rosen JM. 1990. An interactive graphics-based model of the lower extremity to study orthopaedic surgical procedures. IEEE Trans Biomed Eng. 37(8):757–767.
- Di Marco R, Scalona E, Pacilli A, Cappa P, Mazzà C, Rossi S. 2018. How to choose and interpret similarity indices to quantify the variability in gait joint kinematics. Int Biomech. 5(1):1–8.
- Duda GN, Brand D, Freitag S, Lierse W, Schneider E. 1996. Variability of femoral muscle attachments. J Biomech. 29(9):1185–1190.
- Hainisch R, Gfoehler M, Zubayer-Ul-Karim M, Pandy MG. 2012. Method for determining musculotendon parameters in subject-specific musculoskeletal models of children developed from MRI data. Multibody Syst Dyn. 28(1–2):143–156.
- Harrington ME, Zavatsky AB, Lawson SE, Yuan Z, Theologis TN. 2007. Prediction of the hip joint centre in adults, children, and patients with cerebral palsy based on magnetic resonance imaging. J Biomech. 40(3):595–602.
- Hicks JL, Uchida TK, Seth A, Rajagopal A, Delp SL. 2015. Is my model good enough? Best practices for verification and validation of musculoskeletal models and simulations of movement. J Biomech Eng. 137(2):020905.
- Iosa M, Cereatti A, Merlo A, Campanini I, Paolucci S, Cappozzo A. 2014. Assessment of waveform similarity in clinical gait data: the linear fit method. Biomed Res Int. 2014:214156.
- Kadaba MP, Ramakrishnan HK, Wootten ME, Gainey J, Gorton G, Cochran GV. 1989. Repeatability of kinematic, kinetic, and electromyographic data in normal adult gait. J Orthop Res. 7(6):849–860.
- Kainz H, Hoang H, Pitto L, Wesseling M, Van Rossom S, Van Campenhout A, Molenaers G, De Groote F, Desloovere K, Jonkers I. 2019. Selective dorsal rhizotomy improves muscle forces during walking in children with spastic cerebral palsy. Clin Biomech (Bristol, Avon)). 65:26–33.
- Kainz H, Hoang HX, Stockton C, Boyd RR, Lloyd DG, Carty CP. 2017. Accuracy and reliability of marker-based approaches to scale the pelvis, thigh, and shank segments in musculoskeletal models. J Appl Biomech. 33(5):354–360.
- Kainz H, Wesseling M, Pitto L, Falisse A, Van Rossom S, Van Campenhout A, De Groote F, Desloovere K, Carty C, Jonkers I. 2018. O 107 – Impact of subject-specific musculoskeletal geometry on estimated joint kinematics, joint kinetics and muscle forces in typically developing children. Gait Posture. 65:223–225.
- Lenaerts G, Bartels W, Gelaude F, Mulier M, Spaepen A, Van der Perre G, Jonkers I. 2009. Subject-specific hip geometry and hip joint centre location affects calculated contact forces at the hip during gait. J Biomech. 42(9):1246–1251.
- Lenaerts G, De Groote F, Demeulenaere B, Mulier M, Van der Perre G, Spaepen A, Jonkers I. 2008. Subject-specific hip geometry affects predicted hip joint contact forces during gait. J Biomech. 41(6):1243–1252.
- Modenese L, Montefiori E, Wang A, Wesarg S, Viceconti M, Mazza C. 2018. Investigation of the dependence of joint contact forces on musculotendon parameters using a codified workflow for image-based modelling. J Biomech. 73:108–118.
- Modenese L, Phillips A. 2012. Prediction of hip contact forces and muscle activations during walking at different speeds. Multibody Syst Dyn. 28(1–2):157–168.
- Modenese L, Phillips AT, Bull AM. 2011. An open source lower limb model: Hip joint validation. J Biomech. 44(12):2185–2193.
- Montefiori E, Modenese L, Di Marco R, Magni-Manzoni S, Malattia C, Petrarca M, Ronchetti A, de Horatio LT, van Dijkhuizen P, Wang A, et al. 2019a. An image-based kinematic model of the tibiotalar and subtalar joints and its application to gait analysis in children with Juvenile Idiopathic Arthritis. J Biomech. 85:27–36.
- Montefiori E, Modenese L, Di Marco R, Magni-Manzoni S, Malattia C, Petrarca M, Ronchetti A, de Horatio LT, van Dijkhuizen P, Wang A, et al. 2019b. Linking joint impairment and gait biomechanics in patients with juvenile idiopathic arthritis. Ann Biomed Eng. 47(11):2155–2167.
- Pataky TC. 2012. One-dimensional statistical parametric mapping in Python. Comput Methods Biomech Biomed Eng. 15(3):295–301.
- Picerno P, Cereatti A, Cappozzo A. 2008. Joint kinematics estimate using wearable inertial and magnetic sensing modules. Gait Posture. 28(4):588–595.
- Prinold JA, Mazza C, Di Marco R, Hannah I, Malattia C, Magni-Manzoni S, Petrarca M, Ronchetti AB, Tanturri de Horatio L, van Dijkhuizen EH, et al. 2016. A patient-specific foot model for the estimate of ankle joint forces in patients with juvenile idiopathic arthritis. Ann Biomed Eng. 44(1):247–257.
- Scheys L, Spaepen A, Suetens P, Jonkers I. 2008. Calculated moment-arm and muscle-tendon lengths during gait differ substantially using MR based versus rescaled generic lower-limb musculoskeletal models. Gait Posture. 28(4):640–648.
- Scheys L, Van Campenhout A, Spaepen A, Suetens P, Jonkers I. 2008. Personalized MR-based musculoskeletal models compared to rescaled generic models in the presence of increased femoral anteversion: effect on hip moment arm lengths. Gait Posture. 28(3):358–365.
- Song K, Anderson AE, Weiss JA, Harris MD. 2019. Musculoskeletal models with generic and subject-specific geometry estimate different joint biomechanics in dysplastic hips. Comput Methods Biomech Biomed Eng. 22(3):259–270.
- Stebbins J, Harrington M, Thompson N, Zavatsky A, Theologis T. 2006. Repeatability of a model for measuring multi-segment foot kinematics in children. Gait Posture. 23(4):401–410.
- Steele KM, Demers MS, Schwartz MH, Delp SL. 2012. Compressive tibiofemoral force during crouch gait. Gait Posture. 35(4):556–560.
- Steele KM, van der Krogt MM, Schwartz MH, Delp SL. 2012. How much muscle strength is required to walk in a crouch gait? J Biomech. 45(15):2564–2569.
- Valente G, Crimi G, Vanella N, Schileo E, Taddei F. 2017. nmsBuilder: Freeware to create subject-specific musculoskeletal models for OpenSim. Comput Methods Programs Biomed. 152:85–92.
- Valente G, Pitto L, Testi D, Seth A, Delp SL, Stagni R, Viceconti M, Taddei F. 2014. Are subject-specific musculoskeletal models robust to the uncertainties in parameter identification? Plos One. 9(11):e112625.
- Wesseling M, De Groote F, Bosmans L, Bartels W, Meyer C, Desloovere K, Jonkers I. 2016. Subject-specific geometrical detail rather than cost function formulation affects hip loading calculation. Comput Methods Biomech Biomed Eng. 19(14):1475–1488.
- Wesseling M, De Groote F, Meyer C, Corten K, Simon JP, Desloovere K, Jonkers I. 2016. Subject-specific musculoskeletal modelling in patients before and after total hip arthroplasty. Comput Methods Biomech Biomed Eng. 19(15):1683–1691.
- Wesseling M, Ranz EC, Jonkers I, et al. 2017. Objectifying treatment outcomes using musculoskeletal modelling-based simulations of motion. In: Müller B, Wolf SI, Brueggemann G-P, editors. Handbook of human motion. Cham: Springer International Publishing; p. 1–25.
- White DR, Woodard HQ, Hammond SM. 1987. Average soft-tissue and bone models for use in radiation dosimetry. Br J Radiol. 60(717):907–913.
Appendix
Figure A1 Different indices for the description and analysis of the simulation results. A: Goodness of fit was assessed with the RMSD. B: Joint loading during the loading response (P1) and push off (P2) phases were analysed using the peak values and overall joint loading by the area under JCF/BW curve.
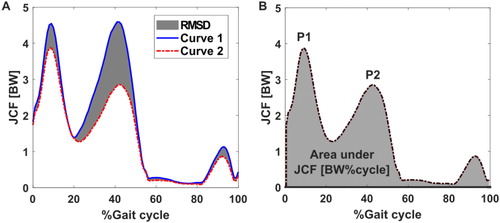
Figure A2 Comparison between Gen (red) and SubS (blue) model estimations of sagittal plane joint angles, moments and powers at all observations for 11 juvenile participants. Joint moments and powers normalised by body mass. Black bars indicate significance at P < 0.05 according to the non-parametric one-sample paired t-test. Extension/Flexion (Ext/Flex), Plantarflexion/Dorsiflexion (PF/DF) and Absorption/Generation (Abs/Gen).
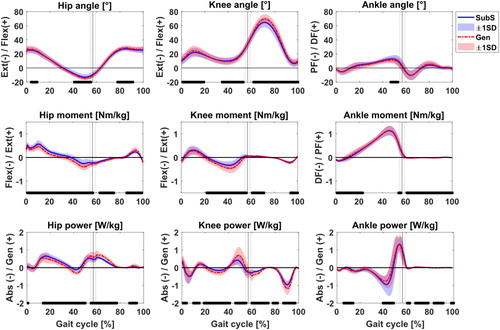
Figure A3. Muscle forces estimated by the Gen (red) and SubS (blue) models for 12 selected muscles at M0 and M12. Black bars indicate statistical significance at P < 0.05 between models. Selected muscles are biceps femoris long head, biceps femoris short head, gastrocnemius lateralis, gastrocnemius medialis, rectus femoris, semimembranosus, soleus, tibialis anterior, tibialis posterior, vastus intermedius, vastus lateralis and vastus medialis.
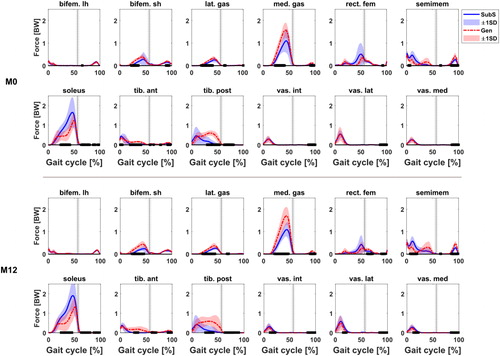
Table A1. p-values for Wilcoxon sign ranked test between M0 and M12 for Δm(RMSD).
Table A2. P-values for Wilcoxon sign ranked test between Gen and SubS for Δt(RMSD).
Table A3. p-values for Wilcoxon sign ranked test between Gen and SubS estimates of AUC(JCF).