
Keywords:
1. Introduction
Cellphones have transformed how people live, work, and communicate. Similarly, they are becoming excessively popular in reshaping the healthcare system because of their accessibility, affordability, and capacity. Inside cellphones are integrated MEMS-designed Inertial Measurement Units (IMU). These MEMS provide a practical and cheap way to collect user’s motion data. They are mainly used in the area of sports (i.e., step count) and clinical applications (assessment of the user’s physical function, fall detection, etc.…). Moreover, gait analysis relying on inertial data acquired by cellphones has been a subject of many recent studies (Pepa et al. Citation2017; Roeing et al. Citation2017). Cellphones offer an easy and non-obtrusive way for ambulatory gait analysis.
A famous parameter known for its ability to reflect underlying neural control of gait, physiology of gait, and age-related and pathological alterations in locomotor regulations is gait variability (Hausdorff Citation2005). Several dedicated devices have been used to measure gait variability in clinical settings. However, the possibility of assessing gait variability with a cellphone in an uncontrolled and natural environment is hardly mentioned in the literature. Several intriguing research questions arise when trying to treat this matter. Most importantly is what algorithm can be used to calculate gait variability from cellphone IMU data, and how much can the cellphone algorithm-position influence gait variability interpretation.
The objective of this feasibility study is to assess the feasibility and limitations of using a simple approach (peak detection algorithms) to detect steps and segment the walking motion into gait cycles or strides and thus compute gait variability as the standard deviation of stride time.
2. Methods
2.1. Protocol
Two volunteers participated in this study. Their characteristics are given in . The first participant was asked to perform three simple 9 min walking tasks on an instrumented treadmill at three different speeds: comfortable speed (C), low (L) and high (H) speed (70% and 130% of C, resp.). During each task, the participant carried the cellphone in three different ways for two minutes each: attached at the waist (W), in the side pocket (S) and held in the hand (H). The second participant reproduced a similar experiment but only at her comfortable speed.
Table 1. Subject characteristics.
Subject comfortable speeds were adjusted by an iterative process at the beginning of the experiment. Both subjects had a familiarization phase before the experiment. The first and last minutes are not considered in the analysis. Moreover, to synchronize the cellphone and treadmill data, the participant was asked to jump at the beginning and end of the task.
2.2. Data acquisition
The cellphone data is recorded using an iPhone 6 s at a sampling frequency of 100 Hz with the aid of a commercial application called “sensor play”.
The treadmill is an instrumented split-belt system from which we recorded the ground reaction forces for each foot, at a sampling frequency of 600 Hz.
2.3. Assessment of temporal gait parameters
The treadmill force data were filtered using a 4th order Butterworth filter at 15 Hz cutoff frequency. Heel strike events were detected using the vertical force (threshold set at 40% of body weight).
Cellphone data sampling frequency is not constant. Thus, it was first resampled and interpolated at 100 Hz. Then, the data is filtered using a 10th order Butterworth low-pass filter at 3 Hz cut-off to extract the signal’s fundamental frequency that results from step events only (Susi et al. Citation2013). Steps were detected using peaks on the signal of the norm of the acceleration (hand and waist) or the angular velocity (pocket), see . The choice of signal, acceleration or angular velocity, depends on how clear the step event can appear in the signal.
Figure 1. Time normalized corridors of the signals used to detect steps (Accelerometer or Gyroscope) for the three carrying condition (W, H, P). Red boxes show left (LHS) or right (RHS) heel strikes.
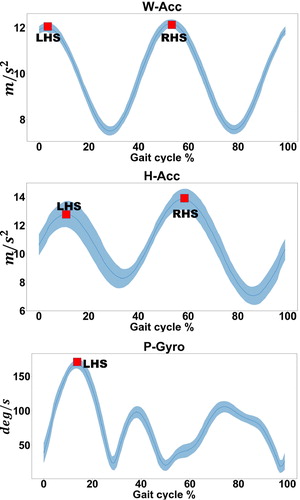
Finally, stride time is calculated as the time duration between the same foot consecutive heel strikes and gait variability is calculated as the standard deviation of the stride time series.
3. Results and discussion
The comfortable speed for the two participants were 1.2 m/s and 0.9 m/s, respectively. displays the standard deviation of stride time calculated with the cellphone and treadmill data for both subjects (S1 and S2) and the different experimental conditions (speed and cellphone carriage).
Figure 2. The SD of stride time calculated with the cellphone and treadmill for the different speeds (L, C, H) and carriage conditions (W, H, P) for both subjects (hatched bars for S2).
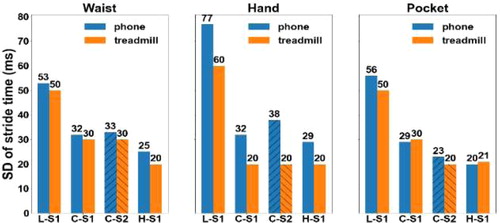
Regarding S1: for pocket-cellphone or waist-cellphone, the estimated gait variability is similar to reference gait variability obtained from the treadmill (maximum difference: 6 ms). However, for hand-cellphone, gait variability was overestimated by a range of 17 ms-9ms. Such errors should be compared to relevant changes that one may want to observe between two situations/persons: typically, the minimum difference between fallers and non-fallers stride time standard deviation is about 20 ms (Hausdorff Citation2005). The obtained results seem thus very promising. Moreover, it is important to notice that the influence of speed on gait variability – a classical result (e.g.,; (Beauchet et al. Citation2009)) not surprisingly observable on the reference (treadmill) data – is also observed with the cellphone data for the three carrying conditions. Last, results show that the accuracy of the proposed approach is not affected by the gait speed.
Considering the results of both subjects (C-S1, C-S2): although relatively large errors between cellphone and treadmill data could be seen on the H condition, both devices seem to provide the same trend: similar variability for both handheld and waist-mounted trials, and a smaller variability for the second subject in the pocket trial. We conclude that the proposed approach is relatively robust against inter-subjects’ variability.
This study is limited because of the low number of subjects. More data will be acquired and processed to generalize and draw more conclusions.
4. Conclusions
These results show that the use of cellphone sensors holds great potential for assessing gait variability. It was found to be relevant for two of the three handling cases, and robust against gait speed variations and inter-subject variability. Further research will be conducted to obtain more accurate results, especially for the handheld case, and to assess the robustness of the method through larger data collections including more subjects and less controlled situations.
Acknowledgments
We thank the subjects who participated in the study.
References
- Beauchet O, Annweiler C, Lecordroch Y, Allali G, Dubost V, Herrmann FR, Kressig RW. 2009. Walking speed-related changes in stride time variability: effects of decreased speed. J NeuroEngineering Rehabil. 6(1):32.
- Hausdorff JM. 2005. Gait variability: methods, modeling and meaning. J NeuroEngineering Rehabil. 2(1):19.
- Pepa L, Verdini F, Spalazzi L. 2017. Gait parameter and event estimation using smartphones. Gait Posture. 57:217–223.
- Roeing KL, Hsieh KL, Sosnoff JJ. 2017. A systematic review of balance and fall risk assessments with mobile phone technology. Arch Gerontol Geriatr. 73:222–226.
- Susi M, Renaudin V, Lachapelle G. 2013. Motion mode recognition and step detection algorithms for mobile phone users. Sensors (Basel). 13(2):1539–1562.