
 ?Mathematical formulae have been encoded as MathML and are displayed in this HTML version using MathJax in order to improve their display. Uncheck the box to turn MathJax off. This feature requires Javascript. Click on a formula to zoom.
1. Introduction
Articular cartilage is a highly specialized tissue located at the periphery of bones ends. This type of cartilage forms during embryogenesis at the interface between two bones of a joint. The cartilage grows in four stages during the postnatal period with the activity of chondrocyte cells that produce or destroy collagen and proteoglycan. In adulthood, the chondrocytes become inactive. The cartilage has then a three-layer structure: the superficial layer (S), the transitional layer (T) and the deep layer which rests on calcified cartilage (Cal), the deep layer subdivided into two sublayers (D1 and D2) (Hunziker et al. Citation2002). However, in the pathology of osteoarthritis, under the effect of a mechanical stimulus that exceeds a given threshold, the chondrocytes reactivate, proliferate, thereby producing the abnormal collagen X. Based on this postulate, our study proposes a kinetic model of the proliferation of chondrocytes during chondrogenesis, as a basis for a future model of osteoarthritis. This kinetic model will be the same for each layer and will be integrated into a more global model allowing to calculate the mechanical properties of the cartilage according to the activities of the cells. This mechanical model will provide the answer to the coupling of chondrocyte activity, microstructures and links with mechanics as it occurs in degenerative diseases such as osteoarthritis.
2. Kinetic model
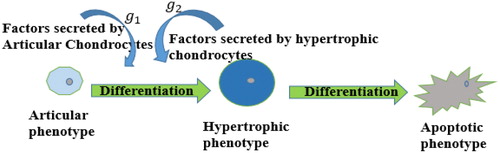
Three chondrocyte phenotypes are considered in the model: the articular phenotype – also the less active one – the hypertrophic phenotype (more voluminous and more active) and the apoptotic phenotype corresponding to the dying chondrocyte. The numbers of chondrocytes of articular phenotype, hypertrophic phenotype and apoptotic phenotype are denoted by and
respectively. Chondrocytes are modelled as producers of enzymes regulating the differentiation from the articular phenotype to the hypertrophic one.
The effectors produced by the articular chondrocytes to regulate their differentiation into hypertrophic phenotype are called autocrine factors (TGF-β, BMP, IGF). The effectors produced by the hypertrophic chondrocytes to influence the differentiation of articular chondrocytes into hypertrophic ones are the paracrine factors (IL-1, TNF; ). Chondrocytes also secrete chemical factors influencing the production or destruction of the cartilage matrix (anabolic and catabolic factors, respectively). The inhibitory effects of anabolic factors on catabolic factors were neglected in the model and vice versa.
Figure 1. Representative diagram of chondrocyte differentiation.
The concentration of a factor depends on the number of cells secreting it. Power law models seem to be good estimators in such a case as it was shown for other biological systems (Komarova et al. Citation2003). We then assume that the rate of production of hypertrophic chondrocytes depends on the number of hypertrophic chondrocytes and articular chondrocytes in the form were
and
express the effect of anabolic and catabolic factors on chondrocyte differentiation. We neglected the effect of factors that influence chondrocyte death by apoptosis. The number of apoptotic chondrocytes is, therefore, assumed to be directly proportional to the number of hypertrophic chondrocytes (with a constant
). We finally obtain considering the underlying assumptions the following differential equation for the dynamics of hypertrophic chondrocytes in articular cartilage as:
(1)
(1)
The temporal variation of the number of articular chondrocytes and apoptotic phenotype is modeled by the differential EquationEquation (2)(2)
(2) :
(2)
(2)
3. Application to cartilage genesis
In the case of the genesis of healthy cartilage, the articular chondrocytes being less active, the action of the factors they secrete is negligible () compared to that of hypertrophic chondrocytes. We can then put EquationEquation (1)
(1)
(1) in the form:
(3)
(3)
It is recognized that the superficial and transitional layers do not contain hypertrophic chondrocytes. The number of hypertrophic chondrocytes in each layer is extracted from (Hunziker et al. Citation2002). We chose initial values of that result in behavior similar to that of the cartilage genesis:
a solution of (4) in this case takes the form:
(4)
(4)
4. Results and discussion
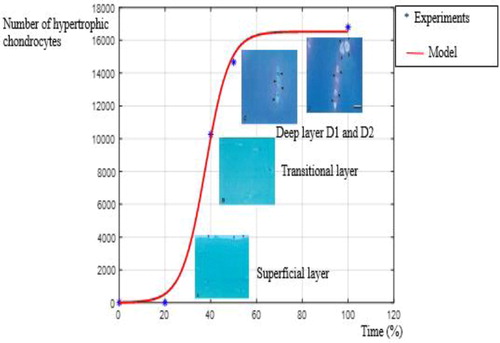
Hunziker et al. (Citation2002) described the spatial distribution of chondrocytes in the different cartilage layers of human adult sound cartilage. By considering that this distribution is the result of the cartilage genesis (phenomenon related to the time), we convert the spatial distribution into a time-related production of chondrocytes. We have associated a percentage time scale based on the width of each layer considering that the total thickness corresponds to a scale of 100. The superficial zone corresponds to 20% of the time, the transitional zone to 40%. In the 50% of the time upper half of the lower radial zone is formed. The lower half of the lower radial and the calcified zone are finally formed (Akkiraju and Nohe Citation2015).
A sigmoidal adjustement fitted well these data and is consistent with the previous equation with The parameters
of a sigmoidal model have been adjusted with MATLAB and the resulting values were:
and
is obtained by:
and
shows the result of smoothing the number of hypertrophic chondrocytes, the blue asterisks indicate the estimated number of chondrocytes, the continuous red line represents the function calculated from MATLAB. The inserts inside show the histological sections in the different layers of the cartilage The model realistically predicts the low value of The experimentally observed rate of apoptotic chondrocytes in human cartilage is 1% to 5% (Hwang and Kim Citation2015).
Figure 2. Evolution with time of the number of hypertrophic chondrocytes in healthy cartilage.
5. Conclusion
The developed model of the kinetics of hypertrophic chondrocytes enables to represent their temporal evolution and to trace back the evolution of the relative thickness of cartilage sublayers over time during embryogenesis. This model, based on the biological aspects, will be the basis of future development to model the chondrocytes activity in case of arthrosis and the resulting effects on the cartilage mechanical properties. Such a model can then be used to study how the cartilage microstructure has evolved and how the mechanical environment of the cells can influence the biological response of the cells, thus, providing a possible insight into how articular cartilage develops, adapts and degenerates.
Disclsoure statement
No potential conflict of interest was reported by the authors.
References
- Akkiraju H, Nohe A. 2015. Role of chondrocytes in cartilage formation, progression of osteoarthritis and cartilage regeneration. J Dev Biol. 3(4):177–192.
- Hunziker EB, Quinn TM, Häuselmann H-J. 2002. Quantitative structural organization of normal adult human articular cartilage. Osteoarthr Cartil. 10(7):564–572.
- Hwang H, Kim H. 2015. Chondrocyte apoptosis in the pathogenesis of osteoarthritis. Int J Mol Sci. 16(11):26035–26054.
- Komarova SV, Smith RJ, Dixon SJ, Sims SM, Wahl LM. 2003. Mathematical model predicts a critical role for osteoclast autocrine regulation in the control of bone remodeling. Bone. 33(2):206–215.