
 ?Mathematical formulae have been encoded as MathML and are displayed in this HTML version using MathJax in order to improve their display. Uncheck the box to turn MathJax off. This feature requires Javascript. Click on a formula to zoom.
1. Introduction
Adolescence is a crucial period for bone growth, and many factors during this period can influence bone quality and the intensity of peak bone mass, e.g., nutritional intakes and physical activity (Chevalley et al. Citation2011). Carrying out studies in this specific population may help to improve our knowledge of the evolution of bone quantity, quality and biomechanical parameters during puberty, and to better understand the mechanisms of fractures.
HR-pQCT (XtremeCT, Scanco Medical AG, Switzerland) is a scanner used in research to assess in vivo densities, bone microarchitecture and biomechanical properties with a High Resolution (isotropic voxel: 82µm3). HR-pQCT-based micro Finite Element Analysis (FEA) predicts accurately the mechanical properties and risk of fracture (Laib et al. Citation1998; Varga et al. Citation2010; Pistoia et al. Citation2002), even with a linear homogenized FEA (Hosseini et al. Citation2017). However, these simulations suffer from discontinuities, are time consuming and device dependent.
The aim of this study is then to validate a continuum FE model by comparison with the micro FEA from HR-pQCT on adolescent cohort.
2. Materials and methods
The VITADOS cohort (NCT01832623) is composed of 100 healthy teenagers (50 boys, and 50 girls) from 10 to 18 years of age with five pubertal Tanner stages.
2.1. Hr-pQCT based evaluation and µFE
Volumetric bone mineral densities and micro-architecture were measured at both distal radius and tibia from a stack of 110 slices corresponding to ∼9mm length of bone.
Micro-FE (µFE) models of the radius and tibia were created directly from the segmented images using the software dedicated (IPL). Briefly, a voxel-based model converts each voxel of bone tissue into an equally sized hexahedral element (8 nodes 1 integration point) leading to 2 million elements for the radius, 5 million elements for the tibia. A semi-automatic segmentation was used to differentiate cortical from trabecular bone. Material properties were chosen isotropic and elastic. Young's modulus of 20 GPa and 17 GPa were assigned to cortical and trabecular bone elements respectively, with a Poisson's ratio of 0.3 (Vilayphiou et al. Citation2010). A compression test was simulated with a uniaxial displacement of 1% of bone length applied on the distal face of the bone while the nodes located at the proximal face were fully constrained (Pistoia et al. Citation2002).
The failure load (F.ult) is calculated using Pistoia criterion, adapted by (Vilayphiou et al. Citation2010; Boutroy et al. Citation2007) with 2% of the bone tissue exceeding the yield strain of 3500 µ strain to assess the failure load. The µFE models were the same for radius and tibia analysis.
2.2. cFE modelling
The continuum FE model is built, using the raw dicom, using 3 D-Slicer (stl data), then the model is meshed using commercial software (Ansys) with quadratic tetrahedral elements (10 nodes, 4 integration points). After a first parametric study, the size of the elements varied between 0.4 and 0.6 mm and the number of elements is approximately 300000 for radius and 600000 for tibia. represents the difference between continuum FE model (cFE) and micro FE model (μFE).
Figure 1. (A) µFE: only bone was meshed. (B) cFE: all the section was meshed, including bone marrow.
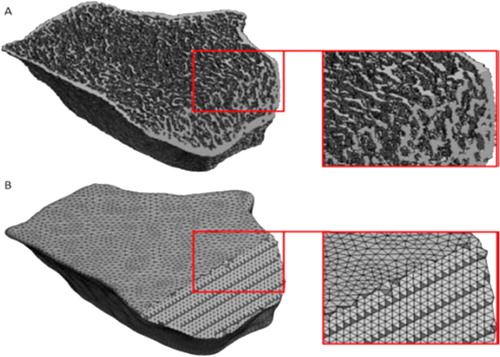
In order to retrieve bone structure a material mapping was performed, i.e., the assignment of Young’s modulus to each element using the grey levels of the images. To do so, a calibration phantom with calcium hydroxyapatite equivalent concentrations of 0, 100, 200, 400, and 800 mg/cm3 was used to establish the following linear relationship between CT Hounsfield units (HU) and calcium hydroxyapatite equivalent density (ρQCT) in g/cm3: ρQCT= 0.041623 + 0.0003555 HU.
Several density-elasticity laws were tested; however, their results were either overestimated (Keyak et al. Citation1994; Morgan et al. Citation2003) or underestimated (Keller Citation1994; Carter et al. Citation1977). Then, two previously established density–elasticity relationships (Eqs. (1)–(2)) were combined to assign inhomogeneous linearly isotropic material properties to the finite element models, where Kaneko is assigned to the trabecular bone and Carter affected to the cortical bone.
(1)
(1)
(2)
(2)
where E is the elastic modulus (MPa) and ρ is the density (g/cm3). ρQCT was converted to ρash using
The ratio ρash/ρapp was considered equal to 0.6 (Schileo et al. Citation2008).
The passage from one law to another is defined by a density threshold, obtained by the ratio of Cortical Area over Total Area. The percentage of the cortical compartment in the whole bone allows separating the densities of the elements of the cortical from the trabecular densities.
This value was calculated from 4 adolescents in each puberty tanner stage group (3 Tanner groups for boys and 2 Tanner groups for girls). Three categories of threshold density were calculated: (A) mean threshold, (B) threshold-gender and (C) threshold-tanner-gender.
The boundary conditions are the same used for µFE.
2.3. Statistical analysis
Non parametric Spearman correlation coefficients (ρ) were used to evaluate the correlation. Accuracy between the two methods was expressed by the root mean square error (RMSE).
3. Results and discussion
The cFE and µFE were carried out for 20 adolescents whose density thresholds were calculated. The cFE were ten-times faster than µFE.
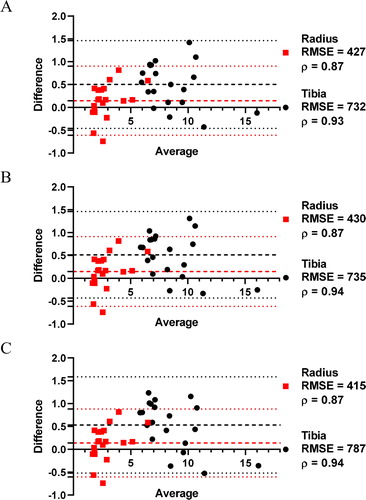
The results were roughly equivalent for all the three density thresholds (Bland-Altman graphs, ). The failure load by cFE and µFE was significantly correlated for radius (ρ = 0.87) and tibia (ρ = [0.93-0.94]), and no statistical difference in RMSE values for all the thresholds. Differences were within the mean of difference (tibia: [0.50 − 0.53], radius: [0.14 − 0.15]) ±1.96 SD (tibia: [–0.52 − 1.58], radius: [-0.61 − 0.91]). The mean threshold is then preferred, as no requirement of differentiation by Tanner stage or gender. To use the combination of two laws (one for cortical, one for trabecular bone), those results required the microarchitecture analysis (%cortical bone).
Figure 2. Bland Altman of µFE and cFE methods using (A) mean threshold, (B) gender threshold, and (C) Tanner-gender threshold of 20 radius and tibia.
4. Conclusion
The cFE models, which do not suffers from discontinuities, showed satisfactory agreement with µFE results. Using the mean threshold obtained on 20 adolescents (radius: 0.581 g/cm3, tibia: 0.657 g/cm3), the methodology will be validated on 80 remaining subjects of the cohort. HR-pQCT remains useful to assess bone micro-architecture and compartmental densities, but the cFE analysis open to new investigations on adaptive behaviour law.
Acknowledgements
An institutional funding for the VITADOS cohort was provided by the Programme Hospitalier de Recherche Clinique Inter-régional (PHRCi).
References
- Boutroy S, Van Rietbergen B, Sornay-Rendu E, Munoz F, Bouxsein ML, Delmas PD. 2007. Finite element analysis based on in vivo HR-pQCT images of the distal radius is associated with wrist fracture inpostmenopausal women. J Bone Miner Res. 23(3):392–399.
- Carter D, Hayes W. 1977. The compressive behavior of bone as a two-phase porous structure. J Bone Joint Surg Am. 59(7):954–962.
- Chevalley T, Bonjour JP, Ferrari S, Rizzoli R. 2011. Pubertal timing and body mass index gain from birth to maturity in relation with femoral neck BMD and distal tibia microstructure in healthy female subjects. Osteoporos Int. 22(10):2689–2698.
- Hosseini HS, Dünki A, Fabech J, Stauber M, Vilayphiou N, Pahr D, Pretterklieber M, Wandel J, Rietbergen B. v, Zysset PK, et al. 2017. Fast estimation of Colles' fracture load of the distal section of the radius by homogenized finite element analysis based on HR-pQCT. Bone. 97:65–75.
- Kaneko TS, Bell JS, Pejcic MR, Tehranzadeh J, Keyak JH. 2004. Mechanical properties, density and quantitative CT scan data of trabecular bone with and without metastases. J. Biomech. 37(4):523–530.
- Keller TS. 1994. Predicting the compressive mechanical behavior of bone. J. Biomech. 27(9):1159–1168.
- Keyak JH, Lee IY, Skinner HB. 1994. Correlations between orthogonal mechanical properties and density of trabecular bone: use of different densitometric measures. J Biomed Mater Res. 28(11):1329–1336.
- Laib A, Häuselmann HJ, Rüegsegger P. 1998. In vivo high resolution 3D-QCT of the human forearm. Technol Health Care. 6(5-6):329–337.
- Morgan EF, Bayraktar HH, Keaveny TM. 2003. Trabecular bone modulus–density relationships depend on anatomic site. J. Biomech. 36(7):897–904.
- Pistoia W, van Rietbergen B, Lochmüller E-M, Lill CA, Eckstein F, Rüegsegger P. 2002. Estimation of distal radius failure load with micro-finite element analysis models based on three-dimensionalperipheral quantitative computed tomography images. Bone. 30(6):842–848.
- Schileo E, Dall’Ara E, Taddei F, Malandrino A, Schotkamp T, Baleani M, Viceconti M. 2008. An accurate estimation of bone density improves the accuracy of subject-specific finite element models. J.Biomech. 41(11):2483–2491.
- Varga P, Pahr DH, Baumbach S, Zysset PK. 2010. HR-pQCT based FE analysis of the most distal radius section provides an improved prediction of Colles' fracture load in vitro. Bone. 47(5):982–988.
- Vilayphiou N, Boutroy S, Sornay-Rendu E, Van Rietbergen B, Munoz F, Delmas PD, Chapurlat R. 2010. Finite element analysis performed on radius and tibia HR-pQCT images and fragility fractures at all sites in postmenopausal women. Bone. 46(4):1030–1037.