
1. Introduction
Running is a popular activity. Amateur runners are now showing great interest in monitoring their personal performance. Motivated by this phenomenon, a large number of light and portable connected tools are appearing on the market and allow to gather a lot of information on running. In parallel, the scientific community is also seeking to free itself from internal laboratory measurements by turning to solutions adapted to in situ measurement (Benson et al. Citation2018). Among these solutions are inertial measurement units (IMU). Composed of several sensors, and particularly accelerometers, the latter have already demonstrated their ability to give a lot of relevant information on the practice of running (Giandolini et al. Citation2014). Previous studies have shown that it is possible to extract repeatable and reproducible acceleration signals in running (Lariviere et al. Citation2020). If these signals nevertheless seem extremely sensitive to the quality of the cushioning and may differ from one runner to another, the longitudinal axis of the leg seems to present signals with significant similarities within a same group of amateur runners.
However, the shape of the acceleration signals is often studied under constant conditions and few studies have observed the influence of the exhaustion level on the acceleration signatures. This step remains nevertheless important in order to understand in real condition how the state of fatigue of a runner impacts the measures of these new technologies. The objective of this study is to be able to observe the impact of the exhaustion level of amateur runners on the accelerometric signature in running.
2. Materials and methods
Ten healthy runners were recruited (five male and five female, 38.0 ± 11.6 years, 1.73 ± 0.10 m, 66.3 ± 12.6 kg, training frequency of two sessions per week).The participants were casual runners, equipped with similar running shoes with appropriate size (Kalenji, Ekiden One, Villeneuve d’Ascq, France). Accelerations were collected using the tri-axial accelerometer of an IMU with a sampling frequency of 1344 Hz and a full range of ±24 g (Hikob Fox, Villeurbanne, France). The IMU was mounted in the middle of the medial surface of the tibia, with one axis aligned with the longitudinal axis of the segment and directed upward. The device was secured with an elastic band. The study was performed on treadmill (NordicTrack C300, Logan, UT, USA). After 10 min warm-up at 10 km/h speed the participant performed the test at a constant speed of 13.5 km/h until exhaustion. This speed was defined before the test and was considered appropriate to generate exhaustion to the population studied based on their own personal record. Exhaustion was defined as the moment the participants were in incapacity to maintain the imposed speed. Exhaustion level was followed and quantified by Borg’s subjective scale (Borg Citation1982) asked to the participant each 5 min. This scale presents a linear variation with exercise time considering a constant condition. This method ensures that exhaustion is reached at the end of the protocol and allow to present exhaustion level as a percentage of the maximal duration (e.g. 50% of exhaustion at half of the maximal duration).
The study of the exhaustion impact was carried out on the acceleration signal along the longitudinal axis of the leg only. First, for each subject, 10 portions of 40 seconds were extracted from the complete signal for moments representing respectively 5 to 95% of the exhaustion level. Then, in order to study a steady state, for each exhaustion level, the first 30 strides of the signals were extracted based on the zero crossings of the filtered signal at the stride frequency. As the duration of each stride was different the signals were standardized to one to a uniform length of 5000 points (representing 100% of the stride). In order to limit the impact of the specific characteristics of each participant, the strides were standardized by subtracting the mean value of the signal and dividing by its standard deviation. For each subject and for each exhaustion level, the signature similarity between the 30 different standardized stride signals was studied over the correlation between these signals. The similarity was computed with a coefficient of multiple determination (CMD) adapted from the methodology described by Kadaba et al. (Citation1989). In order to compare the impact of the exhaustion level on the acceleration signals, the 10 values (i.e. given by the 10 subjects) of each exhaustion level were represented as a boxplot. The 10 values of each exhaustion level were compared to those of the initial level (i.e. 5% of exhaustion) using a Wilcoxon rank sum test. The null hypothesis (i.e. no difference between the mean of the two groups) was rejected for p-value < 0.05.
3. Results and discussions
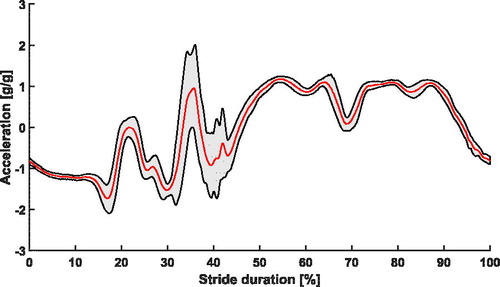
shows the mean and standard deviation of the standardized longitudinal acceleration of the leg. It is possible to differentiate the stance phase (between 30 and 65% of the stride) and parts of the previous and following swing phases (between 0 and 30% of the stride and between 65 and 100% of the stride). As highlight in the literature, in the area of the first peak appearing after the contact (around 35% of the stride), the signal present the widest variability with high standard deviation (Lafortune Citation1991). This phenomenon is generally associated to the impact absorption in the body and is dependent of various parameters (speeds, shoes, technics, etc.). However, beyond this variability, the signal seems very similar.
Figure 1. Standardized longitudinal acceleration of the leg of one subject at the initial exhaustion level (5%). The curves represent the mean (red) and standard deviation (black) of the 30 strides studied.
represents for each exhaustion level, the distribution of the CMD for the ten participants. First, the results show a different behavior within an exhaustion level. Indeed, as each participant presents different CMD, each participant seems to present a different acceleration signature for the 30 strides tested regardless of the exhaustion level. These results are different from previous study (Lariviere et al. Citation2020) that highlight that each runner owns his own acceleration signature. However, this difference can be explained for several reasons, notably because this study is performed on a treadmill which can influence the running signals (Schache et al. Citation2001).
Figure 2. Repartition of the 10 CMD of the 10 participants for each exhaustion level presented as a percentage of the maximal duration of the exercise.
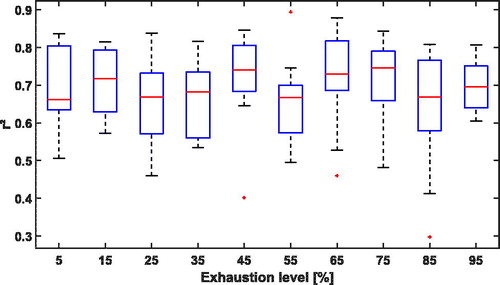
Furthermore, the results of the statistic test do not show any significant difference between each exhaustion level and the initial level (p-value > 0.05). As a result, the exhaustion does not impact acceleration signature. However, the previous remark shows that it is difficult to observe the impact of fatigue since the participants seem to exhibit different behavior. If the results seem ambiguous, whatever the impact of exhaustion, two behaviors can be expected. Either exhaustion impacts the variability of the stride: in this case it would be possible to observe a decrease in the CMD with the exhaustion level. Either exhaustion impacts the stride signature: in this case the signature in the initial and final level could be different, but then the CMDs could still present variability because the signature will remain similar in the 30 strides of the studied level.
4. Conclusion
The impact of exhaustion on acceleration signature has been evaluated in this study. If the results seem to show variations of the signature between subject and exhaustion level, no behavior seems to emerge from this study. Future studies should be focused on how the running signature evolves with difficulties.
Disclosure statement
No potential conflict of interest was reported by the authors.
References
- Benson LC, Clermont CA, Bošnjak E, Ferber R. 2018. The use of wearable devices for walking and running gait analysis outside of the lab: a systematic review. Gait Posture. 63:124–138.
- Borg GAV. 1982. Psychophysical bases if percieved exertion. Med Sci Sports Exerc. 14(5):378–381.
- Giandolini M, Poupard T, Gimenez P, Horvais N, Millet GY, Morin JB, Samozino P. 2014. A simple field method to identify foot strike pattern during running. J Biomech. 47(7):1588–1593.
- Kadaba MP, Ramakrishnan HK, Wootten ME, Gainey J, Gorton G, Cochran GVB. 1989. Repeatability of kinematic, kinetic, and electromyographic data in normal adult gait. J Orthop Res. 7(6):849–860.
- Lafortune MA. 1991. Three-dimensional acceleration of the tibia during walking and running. J Biomech. 24(10):877–886.
- Lariviere O, Provot T, Valdes-Tamayo L, Bourgain M, Chadefaux D. 2020. Force pattern and acceleration waveform repeatability of amateur runners. In: 13th Conf Int Sport Eng Assoc., Tokyo.
- Schache AG, Blanch PD, Rath DA, Wrigley TV, Starr R, Bennell KL. 2001. A comparison of overground and treadmill running for measuring the three-dimensional kinematics of the lumbo-pelvic-hip complex. Clin Biomech. 16(8):667–680.