
 ?Mathematical formulae have been encoded as MathML and are displayed in this HTML version using MathJax in order to improve their display. Uncheck the box to turn MathJax off. This feature requires Javascript. Click on a formula to zoom.
1. Introduction
Mechanical properties of the ethmoid bone are not well understood due to its complex geometry (referred as a ‘labyrinth’), and its deep location in the skull base. However, it is of particular interest for surgeons to appraise the force range they can apply during endoscopic procedures and know what kind of haptic feedback should be produced by a simulation device in order to be realistic for trainees (Favier et al. Citation2019). Ethmoid bone lamellae have a mainly cortical structure (Berger et al. Citation2013) which has no equivalent in the human body. The aim of this study was to describe a protocol of in-situ tensile test under microtomography (micro-CT) to characterize ethmoid bone behavior.
2. Methods
2.1. Bone samples
Bone samples were extracted from a skull of the laboratory of anatomy of Montpellier, and preserved frozen without any chemical fixation.
2.2. In-situ tensile test under micro-CT
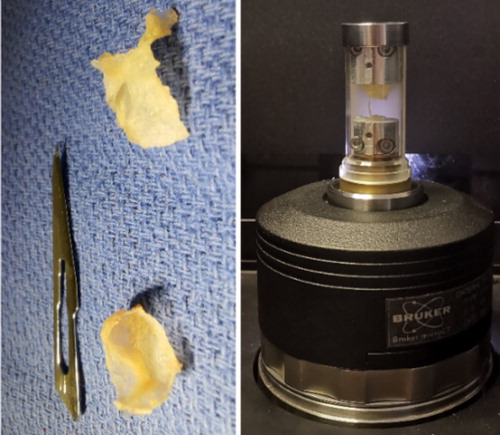
A Brucker© SkyScan 1272 with the material testing stage was used to perform both micro-CT scans and tensile tests. The load force cell can reach values of up to 440 N with an accuracy of ± 4.4 N. The displacement accuracy is 0.01 mm. Bone sample had a random geometry and thin walls (approx. 100 µm) which prevents from obtaining standard shapes for tensile test. Moreover, the small size and fragility of the samples, required to design a dedicated attachment device for the transport and sealing to the loading cell (). Fixing was done with common glue between the two clamps. Tensile test was carried out until bone fracture, originally intended before 80 N. A micro-CT scan of a region comprising the whole sample and clamps was performed at each step of 20 N. Voxel size was set to 2,75 µm isotropically.
Figure 1. Bone samples and micro-CT loading cell.
2.3. Analysis plan
Ultimate stress at fracture and Young’s modulus (E) were evaluated using formulae of linear elasticity:
(1)
(1)
(2)
(2)
where
represent the stress (Pa),
the load in (N),
the section area (
),
is the Young’s Modulus (Pa), and
the strain (no unit). Subscript u stand for ultimate at fracture. Section area and displacement of some landmarks were assessed using 3D micro-CT images at each step by using ImageJ© software.
3. Results and discussion
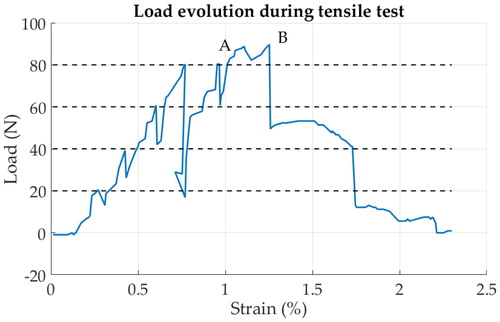
The largest dimensions of the bone samples were 8 × 7 × 1 mm. Complete load evolution during the tensile test is shown in . Each micro-CT scan lasted 2h30; therefore, the total experiment lasted 8 to 10 hours. As a consequence, a creep phenomenon seems to appear during CT scanning, causing relaxation which is visible in the curve. The tensile test was stopped at 80 N and, because the bone was not fractured yet, the tensile test was extended above 80 N several hours after the last scan, leading to some relaxation at 80 N higher than previous steps. The bone section area, where fracture occurs, was close to 5 mm2 and the load during fracture was about 85 N. Using EquationEquation 1(1)
(1) , the ultimate stress at failure was estimated close to 17 MPa. Fracture ignition (micro cracks) was observed for a strain of 0.96% and a complete fracture was observed after a strain of 1.25% (). It was possible to estimate the extension of the bone between the load-free CT scan and the 80 N CT scan by tracking some geometrical landmarks, easy to locate. The extension of the bone was evaluated at 38.5 μm, and the initial distance between the clamp was approximately 5 mm, leading to an estimation of E at 2.08 Gpa (EquationEq. 2
(2)
(2) ).
Figure 2. Load evolution during tensile test. Dotted lines indicated were scans occurred. Point A indicates crack ignition and B complete failure.
Cortical bone is stiffer than trabecular bone, mainly due to a higher density (Helgason et al. Citation2008). For cortical bones, several studies revealed a E range from 10 to 20 GPa under tensile tests (Hoffler et al. Citation2000; Nyman et al. Citation2006) whereas our first result seems much smaller. However, in the anterior skull base, a random pattern of osteons was reported (Dempster Citation1967) which may indicate that the ethmoid bone is not comparable to long bones were osteons are consistently oriented according to their long axis (Boruah et al. Citation2017).
In upcoming works, other ethmoid bone samples will be tested and a complete 3D geometrical model of bones will be reconstructed from micro-CT scans. This model will be used in a Finite Element Analysis framework to corroborate our first results. An inverse method could provide better estimations of the E, Poisson’s coefficient and ultimate stress at failure. Furthermore, it will be interesting to associate to these tests a study of ethmoid bone microstructure.
This study admits some limitations. There is only one exploitable test for the moment, which requires that the results should be considered with caution. It is also necessary to consider the conditions under which the tests are carried out: in the open air and over a long period of time, thus drying out the samples which normally become ‘more brittle’ (Nyman et al. Citation2006). It should also be noted that the Young’s modulus was estimated under the assumption of pure tension, which is relatively coarse, given the geometry of the sample.
4. Conclusions
In-situ tensile test under microtomography was used to characterize mechanical behavior of ethmoid bone. These preliminary encouraging results allow us to propose the following protocol: use of frozen bones, tensile test with a micro-CT acquisition at each 20 N step, estimation of displacement based on 3D images. The continuation of the study, with the coupling of automatic tracking of landmarks and Finite Element Analysis, will allow us to gain more detailed access to the mechanical properties of these types of bone.
Acknowledgements
Authors want to acknowledge Mr. Quentin Michelas for its preliminary work and the anatomy laboratory of Montpellier University and Mrs. Maud Moulin for technical support. This work was partly funded by Montpellier University of Excellence (MUSE) – Call for project ‘TAKE OFF’.
Disclosure statement
No potential conflict of interest was reported by the authors.
References
- Berger G, Eviatar E, Kogan T, Landsberg R. 2013. The normal uncinate process: histology and clinical relevance. Eur Arch Otorhinolaryngol. 270(3):959–964.
- Boruah S, Subit DL, Paskoff GR, Shender BS, Crandall JR, Salzar RS. 2017. Influence of bone microstructure on the mechanical properties of skull cortical bone: a combined experimental and computational approach. J Mech Behav Biomed Mater. 65:688–704.
- Dempster WT. 1967. Correlation of types of cortical grain structure with architectural features of the human skull. Am J Anat. 120(1):7–31.
- Favier V, Gallet P, Subsol G, Captier G. 2019. Understanding the biomechanical properties of skull base tissues is essential for the future of virtual reality endoscopic sinus and skull base surgery simulators. Clin Exp Otorhinolaryngol. 12(2):231–232.
- Helgason B, Perilli E, Schileo E, Taddei F, Brynjólfsson S, Viceconti M. 2008. Mathematical relationships between bone density and mechanical properties: a literature review. Clin Biomech (Bristol, Avon). 23(2):135–146.
- Hoffler CE, Moore KE, Kozloff K, Zysset PK, Brown MB, Goldstein SA. 2000. Heterogeneity of bone lamellar-level elastic moduli. Bone. 26(6):603–609.
- Nyman JS, Roy A, Shen X, Acuna RL, Tyler JH, Wang X. 2006. The influence of water removal on the strength and toughness of cortical bone. J Biomech. 39(5):931–938.