
 ?Mathematical formulae have been encoded as MathML and are displayed in this HTML version using MathJax in order to improve their display. Uncheck the box to turn MathJax off. This feature requires Javascript. Click on a formula to zoom.
1. Introduction
Team lifting is commonly used to reduce the load on an individual performing a heavy lifting task (Sadosky Citation1977). This strategy is defined as a collaborative task that involves two or more members of a group to enhance their lifting efficiency.
Most of the studies on team lifting have focused on the strength efficiency of teamwork. Intuitively, a shared effort may improve the lifting capacity of a team. However, this is not the case and the sum of the maximal strength of each team member has been found to be superior to that of the teamwork (Sharp et al. Citation1997; Wu and Chang Citation2010). This result suggests that during a team lifting task, the constraints may not be efficiently shared between team members.
Ingham et al. (Citation1974) described the ‘Rigelmann Effect’ as a decrease of individual performance in a collective task. Karwowski and Pongpatanasuegsa (Citation1988) studied the ‘Social Loafing’ during static and dynamic lifting. Their results suggest that the lifting-strength of female teams is nonadditive and that the group efficiency declines as the number of team members increases.
Other factors may disrupt the efficiency of team lifting, such as the mismatch between team members. Hence, Lee (Citation2016) examined teamwork lifting strengths in strength-matched and strength-unmatched teams and showed that the efficiency of the team depends on the weaker team-member. In contrast, Karwowski (Citation1988) reported that the efficiency of the team was dictated by the heavier team member.
Here, we present a study in which ten healthy matched pairs of volunteers collectively transport a load while the forces exerted on the load handles are assessed to study how mechanical constraints are distributed among team members.
2. Methods
2.1. Experimental tasks
Ten pairs of healthy right-handed male individuals (mean ± s.d.: subject 1 – at the left side of the load: height = 1.77 ± 0.07 m, mass = 74.78 ± 9.00 kg; subject 2 – at the right side of the load: height = 1.77 ± 0.05 m, mass = 74.54 ± 12.38 kg) participated in the experiments. The individuals had no dysfunction that could impact their gait pattern.
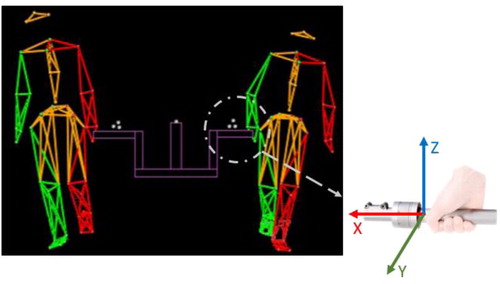
Each pair of subject was tested in three experimental conditions. In each condition, the subjects had to walk side by side over a distance of 13 m at a free chosen speed, while transporting a load (). The mass of the transported load was increased in three successive trials to reach 20% (CT20), 30% (CT30), and 40% (CT40) of the body mass of the two subjects performing the task. The order of the test conditions was randomly chosen.
Figure 1. Collective load transport.
2.2. Data recording
Each subject was equipped with 42 reflective markers in addition to seven markers placed on the load. The 3-D kinematics of the Poly-Articulated Collective System (PACS) formed by both subjects and the load was recorded thanks to 13 MX3 and TS40 Vicon cameras (Vicon©, Oxford) sampled at 200 Hz.
The recording of the external forces and moments exerted on the load were sampled at 2000 Hz thanks to two-lateral handles on the load, equipped with 6-axis force sensors (Sensix©, France) ().
2.3. Statistical analysis
To compare the distribution of the forces between team members, the percentage of exerted force (PEF) was computed as follows:
where EFM is the external force exerted on the handle by one subject, and EFT is the external force exerted by both subjects on the handles. The PEF was computed at each frame of the gait cycle then averaged over time and subjects.
The data were analyzed with Matlab R1019©. A Shapiro-Wilk test was performed to check the normality of the distribution in different conditions. Then, a paired Student t-test with a Bonferroni correction was used to examine subjects’ differences. A repeated-measures analysis of variance was conducted to highlight the impact of load mass on the force distribution (CT20, CT30, and CT40). The significance threshold was set to 0.005.
3. Results and discussion
provides an overview of the percentage of force distribution on the three external axes X, Y and Z (respectively, Medio-lateral, Postero-anterior, and Vertical axis).
Figure 2. Between subjects force distribution at different loads.
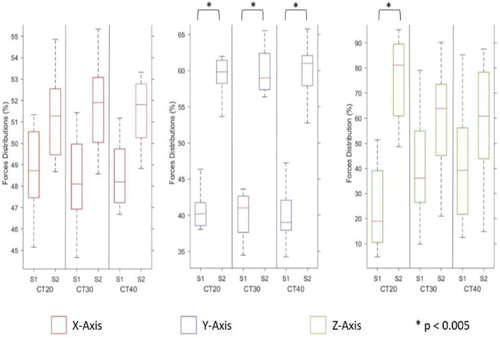
On the medio-lateral axis, no significant differences were found between subjects. It means that forces are equally distributed to maintain the load equilibrium.
On the Y-axis, the average PEF distribution is not equally balanced between team-members. The subject on the right (S2) applies significantly higher forces on the Y-axis whatever the conditions.
The subject on the right side (S2) performs greater Postero-anterior forces on the handle and was responsible for 50–60% of the work necessary to move the load in the horizontal plane. On the Y-axis direction, S2 may initiate and drag, assuming a leadership in the task performance.
In the vertical direction, the difference between the two subjects decreases as the load increases and no significant difference between subjects was found in the CT30 and CT40 condition. Therefore, as mass load increased, the force distribution seems to become balanced between team-members (CT20, p = 0.001; CT30, p = 0.1665; CT40, p = 0.4371).
Besides, the change in load mass did not impact the individual contribution of each subject. No significant differences were found across the three conditions.
4. Conclusions
The purpose of this study was to investigate how mechanical constraints are distributed among matched team members during a collective load transport.
The results suggest that during team lifting, one member leads the movement while the other follows it. In addition, the pulling forces (Z-Axis) tend to be increasingly shared when load mass increases. Future investigation should be conducted to compare the 3 D force distribution when the location of the subject relative to the load (left and right sides) is changed.
Acknowledgements
The authors report no conflicts of interest in this work.
This work is supported by the ANR as part of the Collaborative Robot (CoBot) project (Projet-ANR-18-CE10-0003).
References
- Ingham AG, Levinger G, Graves J, Peckham V. 1974. The Ringelmann effect: studies of group size and group performance. J Exp Soc Psychol. 10(4):371–384.
- Karwowski W. 1988. Maximum load lifting capacity of males and females in teamwork. Proc Hum Factors Soc Annu Meet. 32(11):680–682.
- Karwowski W, Pongpatanasuegsa N. 1988. Testing of isometric and isokinetic lifting strengths of untrained females in teamwork. Ergonomics. 31(3):291–301.
- Lee T-H. 2016. Lifting strength in two-person teamwork. Int J Occup Saf Ergon. 22(2):179–185.
- Sadosky TL. 1977. An analysis of load sharing in two-person lifting tasks [Unpubl Masters Thesis Ga Inst Technol Atlanta].
- Sharp MA, Rice VJ, Nindl BC, Williamson TL. 1997. Effects of team size on the maximum weight bar lifting strength of military personnel. Hum Factors. 39(3):481–488.
- Wu S-P, Chang S-Y. 2010. Effects of carrying methods and box handles on two-person team carrying capacity for females. Appl Ergon. 41(4):615–619.