
 ?Mathematical formulae have been encoded as MathML and are displayed in this HTML version using MathJax in order to improve their display. Uncheck the box to turn MathJax off. This feature requires Javascript. Click on a formula to zoom.
Abstract
The aim of this study was to develop a generic musculoskeletal model of a healthy 10-year-old child and examine the effects of geometric scaling on the calculated values of lower-limb muscle forces during gait. Subject-specific musculoskeletal models of five healthy children were developed from in vivo MRI data, and these models were subsequently used to create a generic juvenile (GJ) model. Calculations of lower-limb muscle forces for normal walking obtained from two scaled-generic versions of the juvenile model (SGJ1 and SGJ2) were evaluated against corresponding results derived from an MRI-based model of one subject (SSJ1). The SGJ1 and SGJ2 models were created by scaling the GJ model using gait marker positions and joint centre locations derived from MRI imaging, respectively. Differences in the calculated values of peak isometric muscle forces and muscle moment arms between the scaled-generic models and MRI-based model were relatively small. Peak isometric muscle forces calculated for SGJ1 and SGJ2 were respectively 2.2% and 3.5% lower than those obtained for SSJ1. Model-predicted muscle forces for SGJ2 agreed more closely with calculations obtained from SSJ1 than corresponding results derived from SGJ1. These results suggest that accurate estimates of muscle forces during gait may be obtained by scaling generic juvenile models based on joint centre locations. The generic juvenile model developed in this study may be used as a template for creating subject-specific musculoskeletal models of normally-developing children in studies aimed at describing lower-limb muscle function during gait.
1. Introduction
Computer models of the human musculoskeletal system are used for a wide range of applications in biomechanics, from studies of muscle function in locomotion (Zajac and Gordon Citation1989; Pandy and Andriacchi Citation2010) to pre-operative planning of orthopaedic surgeries (Chao et al. Citation2007). Many of these studies are based on a generic model of a healthy adult (Delp et al. Citation1990; Anderson and Pandy Citation1999; Garner and Pandy Citation2001; Klein Horsman et al. Citation2007; Arnold et al. Citation2010), which is scaled with respect to body mass and segment lengths to obtain a scaled-generic model of a particular individual (Correa and Pandy Citation2011; Dorn et al. Citation2012; Fok et al. Citation2013; Lai et al. Citation2014; Lin et al. Citation2015). A recent study compared methods for determining muscle-tendon parameters in individual models based on a generic adult model and in combination with individual MRI data of juvenile subjects (Modenese et al. Citation2018). Pitto et al. (Citation2019) published a graphical framework for generating individual MRI-based models. Based on the assumption that a muscle operates near its optimal fiber length during gait, these workers used a multi-dimensional parameter tuning procedure to determine the values of muscle-tendon parameters needed to match variables such as the net joint moments measured during gait.
Recent studies on lower-limb muscle function during gait in children have used scaled-generic models of healthy adult subjects (Steele et al. Citation2010; Correa and Pandy Citation2012; Hegarty et al. Citation2016). However, it is unclear whether this approach is appropriate for determining musculoskeletal geometry and muscle-tendon properties in children, as body mass index (BMI), body-segment anthropometry, bone geometry, muscle moment arms, and muscle-tendon architecture are all substantially different in normally-developing children and adults (Lebiedowska and Polisiakiewicz Citation1997; Beutel et al. Citation2018). For example, healthy 9-year-old boys have a BMI of 16.2 at the 50th percentile compared with an average BMI of 22.4 for healthy 19-year-old adults (Centers for Disease Control and Prevention, 2000).
Limited data are available to describe the paths and architectural properties of the lower-limb muscles of normally-developing children (Kainz et al. Citation2018; Modenese et al. Citation2018). The importance of this information has been emphasized in studies quantifying the sensitivity of muscle force estimates to perturbations in musculoskeletal geometry and the architectural properties of muscles (Scovil and Ronsky Citation2006; Redl et al. Citation2007; Ackland et al. Citation2012; Valente et al. Citation2014; Bosmans et al. Citation2015; Myers et al. Citation2015). Ackland et al. (Citation2012) found that lower-limb muscle function in walking is most sensitive to changes in tendon rest lengths and that the sensitivity of muscle function to changes in muscle moment arms and architectural properties is highly muscle-specific. Zuk et al. (2018) investigated the robustness of dynamic simulation results in the presence of uncertainties resulting from the application of a scaled-generic musculoskeletal model rather than a subject-specific model and found that the estimated muscle forces are sensitive to changes in the force magnitudes of those muscles that generate relatively high forces during gait.
Correa et al. (Citation2011) reported an inter-subject variability of up to 25% in muscle moment arms computed from MRI-based subject-specific musculoskeletal models of normally-developing children. They evaluated the accuracy of scaled-generic models in determining the moment arms and functional roles of the lower-limb muscles during gait. Substantial differences were found in the muscle moment arms computed from MRI-based and scaled-generic models, although predictions of potential muscle function were found to be consistent between the two modelling techniques. Scheys et al. (Citation2008a, Citation2008b) also found that scaled-generic models did not accurately reproduce measurements of muscle moment arms obtained directly from MRI.
The overall goal of the present study was to develop a generic musculoskeletal model of a healthy 10-year-old child that may be used as a template for calculating lower-limb muscle forces during gait in children. Our specific aims were to (1) create subject-specific lower-limb musculoskeletal models of five normally-developing children from in vivo MRI data; (2) specify the musculoskeletal geometry and architectural properties of the muscles defining a generic juvenile model of the lower extremity; and (3) evaluate calculations of lower-limb muscle forces during gait obtained from the generic juvenile model against gold-standard results obtained from a corresponding MRI-based model.
2. Materials and methods
Five normally-developing children (age, 8.8 ± 1.5 years; height, 1.305 ± 0.063 m; weight, 28.9 ± 3.5 kg; BMI 16.9 ± 0.9) were recruited to this study (see ). Ethics approval was obtained from the Ethics Committee of Vienna and written, informed consent was provided by the parents of each child.
Table 1. Physical characteristics of the five normally-developing children recruited to this study. BMI, body mass index.
2.1. Mr imaging and gait data collection
MRI and gait analysis data were recorded for each participant. MRI data were recorded at the MR/CT Institute Schmidt GmbH&Co KEG, Vienna, Austria using a Siemens Symphony Maestro Class 1.5 Tesla scanner. Each subject lay supine with the hips and knees extended and the ankles in the neutral position. For both limbs, three series of axial images (voxel size, 0.9 mm x 0.9 mm x 3.0 mm) and one series of transversal images (voxel size of 1.8 mm x 1.8 mm x 8.0 mm) were obtained from the 4th lower-lumbar vertebrae down to the calcaneus.
Gait data were recorded at the Gait and Movement Analysis Laboratory at the Orthopaedic Hospital in Speising, Vienna, Austria. Joint motion, ground reaction forces and muscle EMG data were recorded simultaneously as each participant walked at their self-selected speed. Retro-reflective marker positions were captured using a 6-camera, opto-electronic, motion measurement system (Motion Analysis Corporation, CA) sampling at 60 Hz. A modified version of the Cleveland Clinic marker set was used, as described by Dorn et al. (Citation2012). Ground-reaction forces and the corresponding moments were measured using two six-component, strain-gauged force plates (AMTI Advanced Mechanical Technology, Inc., MA) sampling at 500 Hz. Surface EMG electrodes were attached to the right leg to record activity from the biceps femoris long head (lateral hamstrings), gastrocnemius and rectus femoris muscles. EMG data were band-pass filtered between 50 and 200 Hz using an order 100 Finite Impulse Response (FIR) filter, and then rectified. The gait data were processed using a Gait Extraction Toolbox developed by Dorn (Citation2008). All recorded data are presented in detail by Hainisch (Citation2015).
2.2. Template generic adult (GA) model
A model of a healthy adult (age, 26 years; height, 1.80 m; mass, 75.0 kg), which was created from the generic ‘Gait2392’ model available in OpenSim (Anderson and Pandy Citation1999; Delp et al. Citation2007), was used as a template generic adult (GA) model in this study. The body was represented as a 14-segment, 23-degree-of-freedom skeleton actuated by 92 muscles. The number of muscles was reduced to 23 per leg by combining the sub-regions of vasti, hamstrings and gastrocnemius into single muscle groups and neglecting those muscles of relatively small volume. Five muscle-specific parameters described the force-producing properties of each muscle-tendon unit: optimal muscle-fiber length, tendon slack length,
peak isometric muscle force,
and the corresponding pennation angle,
and the intrinsic maximum shortening velocity of muscle,
(=10
/sec) (Zajac Citation1989). Values of
and
were based on cadaver measurements obtained from adult donors (Ward et al. Citation2009; Arnold et al. Citation2010). Muscle-tendon attachment sites and tendon slack lengths for the combined actuators (vasti, hamstrings, and gastrocnemius) were adjusted until the joint moment-angle curves computed for maximum isometric muscle contractions matched corresponding results derived from the model by Arnold et al. (Citation2010).
2.3. Subject-specific juvenile (SSJ) models
MRI-based subject-specific juvenile (SSJ) models of the five participants (SSJ1 to SSJ5) were created based on the geometry of the generic adult model (GA) and are identical in structure to the models presented by Hainisch et al. (Citation2012). The lengths, locations of centers-of-mass, and inertial properties of the body segments were scaled to each participant’s height and mass. Bone geometry of each individual child was derived from the MR images. Joint center locations and functional joint axes were estimated using the segmented bone geometry and “virtual markers” in the MRI dataset. Muscle volumes, muscle-tendon attachment sites, and muscle-tendon lines-of-action were calculated directly from the MR images. Muscle-fiber lengths were adjusted to ensure that each muscle developed active force over a similar range of motion in both the GA model and the SSJ models (Hainisch Citation2015).
To determine the peak isometric force of each muscle, the muscle’s physiological cross-sectional area (PCSA) was found by dividing the muscle’s volume calculated from the MR images, Vm, by the muscle’s optimal fiber length,
PCSA was then multiplied by maximum muscle stress, σ = 33 N/cm2 (Weijs and Hillen Citation1985) to obtain
We assumed that in normally-developing children the joint angle at which a muscle develops its peak isometric force is the same as that in healthy adults, and the value of tendon slack length,
was adjusted for each individual muscle accordingly. Values of pennation angle,
and the intrinsic maximum shortening velocity of muscle,
were identical with those defined in the GA model.
Details describing the development and anatomical structure of the MRI-based subject-specific models developed in this study are provided as supplementary material.
2.4. Generic juvenile (GJ) model
Musculoskeletal geometry and muscle-tendon properties (see ) for the MRI-based SSJ models were averaged across the five subjects to create a generic juvenile model (GJ) representing children 8-11 years of age. First, the template GA model was scaled to the average limb segment dimensions of the SSJ models using a scaling function available in OpenSim. Limb segment dimensions for each SSJ model were obtained using the joint centre locations identified with “virtual markers” in the MRI dataset. Optimal muscle-fiber lengths for the GJ model, lGJ0m, were identical with those assumed in the scaled GA model.
Table 2. Parameters defining the force-producing properties of each muscle-tendon unit included in the generic juvenile (GJ) model. Symbols given in the table are defined in the text.
Muscle-tendon attachment sites and via points, PGJ, in the GJ model were determined by first normalizing corresponding data in the MRI-based SSJ models using the body-height ratio of SSJ-model to GJ-model as a scale factor. The subject-specific muscle-tendon attachment sites and via points, PSSJi, were then averaged across all five normalized SSJ-models as follows:
(1)
(1)
where ai is the scale factor based on the ratio of body height for the SSJ model to the GJ model and x,y,z represent the three coordinates of the location of a muscle-tendon attachment site or via point.
Body composition was similar in all participants (i.e., BMI = 16.9 ± 0.9). To determine the average muscle volumes for each subject-specific model (VGJm), the volume of each muscle (VSSJim) was multiplied by the ratio of the average body mass to each subject’s body mass (mbodyGJ/mbody) to compensate for differences in body mass between subjects. The volume of each muscle was averaged across all five SSJ models as follows:
(2)
(2)
Tendon slack length, lGJts, for each muscle was determined using the method described by Hainisch et al. (Citation2012). To obtain the peak isometric force of each muscle, FGJ0, the average volume of each muscle, VGJm, was divided by the corresponding optimal muscle-fiber length, lGJ0m, yielding an average value of muscle PCSAGJ. Finally, peak isometric muscle force was found by multiplying PCSAGJ by the value of maximum muscle stress (σ = 33 N/cm2) (Weijs and Hillen Citation1985).
(3)
(3)
2.5. Scaled-generic juvenile (SGJ) model
We examined the appropriateness of scaling the GJ model for the purpose of calculating muscle forces during gait in children 8-11 years of age. For subject 1, we created two scaled musculoskeletal models, SGJ1 and SGJ2, based on the structure of the GJ model. The SGJ1 model was created by scaling the GJ model to subject 1 using the gait marker positions to define the body-segment lengths. In contrast, the SGJ2 model was created by scaling the GJ model to subject 1 using the joint center positions measured from the MR images obtained for this subject. The peak isometric force of each muscle was found using the mass-length scaling law described by Correa and Pandy (Citation2011):
(4)
(4)
The superscript ‘scaled’ in equation (4) denotes the parameters of the scaled model, is muscle mass and
is total body mass. Total body mass was used instead of the individual muscle masses as body mass distribution was assumed to be the same in the GJ model and subject 1.
Details of the modelling pipeline utilized in the current study are presented as supplementary material. The generic juvenile model together with all MRI-based subject-specific models may be downloaded in Opensim-.xml file format using the following link: https://simtk.org/projects/children.
2.6. Muscle force calculations
The SGJ1 and SGJ2 models were used in conjunction with gait data recorded for subject 1 to calculate lower-limb muscle forces developed during normal walking, and the results then compared to those obtained for the gold-standard MRI-based SSJ1 model for subject 1. The net joint moments generated at the ankle, knee, and hip were computed using the joint motion and ground reaction force data recorded for each subject. All moments were calculated using the inverse dynamics function available in OpenSim (Delp et al. Citation2007). Muscle moment arms were computed as the shortest distance between the muscle-tendon line-of-action and the associated joint center of rotation (Pandy Citation1999). Individual muscle force trajectories were calculated using the static optimization function in OpenSim, which minimized the sum of the squares of all muscle activations in the model (Brand et al. Citation1986). Model-predicted muscle forces during the stance phase of gait were compared against muscle EMG data recorded for subject 1 as well as EMG data reported in the literature (Lieber Citation1986).
3. Results
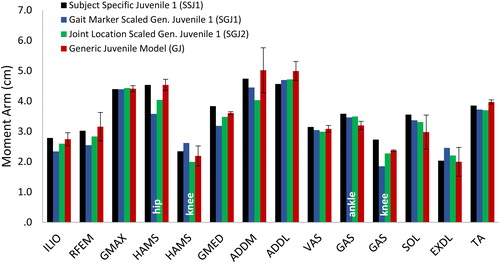
Differences in the calculated values of muscle moment arms and peak isometric muscle forces between the scaled-generic models and the gold-standard MRI-based model were relatively small. Peak isometric muscle forces calculated for the SGJ1 and SGJ2 models were respectively 2.2% and 3.5% lower than those obtained from the MRI-based juvenile model, SSJ1 (). In particular, peak isometric forces of gastrocnemius and soleus were significantly lower (16% and 19% lower, respectively) for the scaled models compared to the MRI-based model. The moment arms of the major force-producing muscles calculated for the SGJ1 and SGJ2 models were on average 5% smaller than those obtained from the MR-based SSJ1 model ().
Figure 1. Peak isometric muscle forces normalized to body weight for the generic juvenile model (GJ), the MRI-based model of subject 1 (SSJ1), the generic child model scaled to the dimensions of subject 1 using gait marker positions (SGJ1), and the generic child model scaled to the dimensions of subject 1 using measured joint center positions (SGJ2). Peak isometric muscle forces were computed for the SGJ1 and SGJ2 models using the mass-length scaling procedure described by Correa and Pandy.9.
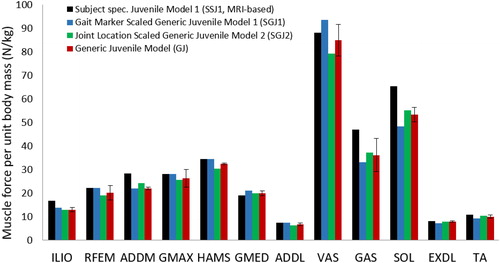
Figure 2. Calculated moment arms of selected muscles for the MRI-based model of subject 1 (SSJ1), the generic juvenile model (GJ), the generic juvenile model scaled to the dimensions of subject 1 using gait marker positions (SGJ1), and the generic juvenile model scaled to the dimensions of subject 1 using measured joint center positions (SGJ2). Muscle moment arms were normalized by body height and then averaged over the joint range of motion measured for normal walking. For the bi-articular muscles (HAMS and GAS) it is indicated which joint the moment arm refers to.
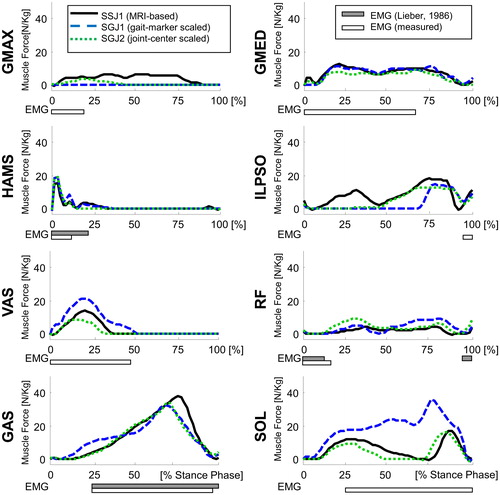
Model-predicted muscle forces for the SGJ2 model agreed more closely with calculations obtained from the MRI-based SSJ1 model than corresponding results derived from the SGJ1 model (). The SGJ1 model predicted higher forces for the uniarticular ankle and knee muscles, soleus and vasti, compared to the results obtained for the gold-standard SSJ1 model. However, a lower force was obtained for the uniarticular hip flexor, iliopsoas, in the SGJ1 model than that calculated for the MRI-based SSJ1 model. The calculated values of muscle force obtained from the SGJ1 and SGJ2 models were similar for the remaining muscles.
Figure 3. Muscle force trajectories calculated for the MRI-based model of subject 1 (SSJ1), the generic juvenile model (GJ), the the generic juvenile model scaled to the dimensions of subject 1 using gait marker positions (SGJ1), and the generic juvenile model scaled to the dimensions of subject 1 using measured joint center positions (SGJ2). Results are presented for the stance phase of gait. The filled horizontal bars below each graph represent muscle EMG activity measured for subject 1 while the empty horizontal bars are experimental EMG data reported by (CitationLieber 1986).
4. Discussion
The aim of this study was to develop a generic musculoskeletal model of a healthy 10-year-old child and examine the effects of geometric scaling on the calculated values of lower-limb muscle forces during gait. Subject-specific musculoskeletal models of five normally developing children were developed from in vivo MRI data, and these models were subsequently used to create a generic juvenile model. Calculations of individual muscle forces for normal walking obtained from a scaled-generic version of the juvenile model were evaluated against corresponding results obtained from an MRI-based model of one subject. The generic juvenile model presented here may be used as a template to generate subject-specific musculoskeletal models of normally-developing children in studies aimed at describing lower-limb muscle function during daily activities such as walking.
Differences in muscle moment arms and peak isometric muscle strengths calculated for the five subjects were relatively small ( and , standard deviations for GJ model are relatively small across all muscles), suggesting that the generic juvenile model adequately represents the musculoskeletal structure of children 8 to 11 years of age. However, if some children possess muscles that are significantly larger in volume than that assumed in the generic model, then these differences are less likely to be accounted for when a simple scaling procedure such as the mass-length scaling law is applied. In the present study, this effect was observed for the gastrocnemius and soleus muscles, whose volumes were significantly larger for subject 1.
The difference in body height between the generic juvenile model and subject 1 was only 1.8%, which is likely the reason why scaling of the generic juvenile model led to comparable changes (on the order of a few percent) in the characteristic measures of the SGJ1 model. However, significant modelling errors resulted when the gait marker data were applied to the mass-length scaling law, particularly in relation to the hip joint centre location, which produced subsequent errors in the thigh and shank lengths. The mean difference in scaled thigh length between the generic juvenile model and the MR-based individual models was only 1 mm, while the mean difference in the scaled shank length between these two models was 24 mm (Hainisch R, 2015). By comparison, Kainz et al. (Citation2017) found mean differences of approximately 10 mm for the thigh length and 15 mm for the shank length for normally-developing children when model scaling was based on joint centers. These errors in turn affected the joint angles calculated from inverse kinematics, which propagated to errors in model-predicted moment arms and muscle forces. The results of show that scaling the generic juvenile model on the basis of joint centre locations resulted in more accurate estimates of lower-limb muscle forces during gait (cf. black solid lines and green dotted lines in ).
One limitation of the present study was the relatively small sample size. Only five subject-specific models were developed due to the time-consuming procedures associated with processing the MRI data and reconstructing the muscles and bones for each subject. Future work should focus on creating a more comprehensive database of lower-limb musculoskeletal anatomy by combining in vivo MRI and ultrasound measurements obtained from larger cohorts of children stratified into different age groups (Passmore et al. Citation2017). A second limitation was that in vivo measurements of muscle fascicle lengths and pennation angles were not incorporated in the MRI-based models. Instead, estimates of these muscle architectural properties were obtained by scaling corresponding dimensions assumed in a generic model of a healthy adult male (Arnold et al. Citation2010). Nevertheless, our estimates of muscle volumes and optimal muscle-fiber lengths for the vasti and rectus femoris are consistent with data reported by O’Brien et al. (Citation2010) who measured quadriceps volumes from MRI and optimum fiber lengths from ultrasound in healthy children 8 to 11 years of age. For example, O’Brien et al. (Citation2010) reported average fascicle lengths for the vastus medialis and vastus lateralis muscles ranging from 48 mm to 68 mm for boys and girls 8-9 years of age. The optimum muscle-fiber length assumed for the vasti muscles in the GJ model was 78 mm (). For the vasti muscles in the GA model defined in OpenSim, the average ratio of optimum muscle-fiber length to fascicle length was calculated to be approximately 0.7. Assuming the ratio of optimum muscle-fiber length to muscle fascicle length is the same in the GA and GJ models, we estimated the muscle fascicle length to be 0.7*78 = 55 mm, which compares favourably with the data reported by O’Brien et al. (Citation2010).
In summary, we developed a generic musculoskeletal model of a healthy 10-year-old child and examined the effects of geometric scaling on the calculated values of lower-limb muscle forces during gait. We found that differences in the calculated values of peak isometric muscle forces and muscle moment arms between the scaled-generic models and the gold-standard MRI-based model were small. Peak isometric muscle forces calculated for the SGJ1 and SGJ2 models were respectively 2.2% and 3.5% lower than those obtained for SSJ1. Model-predicted muscle forces for the SGJ2 model agreed more closely with calculations obtained from the MRI-based SSJ1 model than corresponding results derived from the SGJ1 model. These results suggest that accurate estimates of muscle forces during gait may be obtained by scaling generic juvenile models on the basis of joint centre locations.
Acknowledgments
The authors acknowledge the TU Wien University Library for financial support through its Open Access Funding Program.
Disclosure statement
No potential conflict of interest was reported by the authors.
Additional information
Funding
References
- Ackland DC, Lin Y-C, Pandy MG. 2012. Sensitivity of model predictions of muscle function to changes in moment arms and muscle–tendon properties: a Monte-Carlo analysis. J Biomech. 45:1–9.
- Anderson FC, Pandy MG. 1999. A dynamic optimization solution for vertical jumping in three dimensions. Comput Methods Biomech Biomed Eng. 2(3):201–231.
- Arnold EM, Ward SR, Lieber RL, Delp SL. 2010. A model of the lower limb for analysis of human movement. Ann Biomed Eng. 38(2):269–279.
- Beutel BG, Girdler SJ, Collins JA, Otsuka NY, Chu A. 2018. Characterization of proximal femoral anatomy in the skeletally-immature patient. J Child Orthop. 12(2):167–172.
- Bosmans L, Valente G, Wesseling M, Van Campen A, De Groote F, De Schutter J, Jonkers I. 2015. Sensitivity of predicted muscle forces during gait to anatomical variability in musculotendon geometry. J Biomech. 48(10):2116–2123.
- Brand RA, Pedersen DR, Friederich JA. 1986. The sensitivity of muscle force predictions to changes in physiologic cross-sectional area. J Biomech. 19(8):589–596.
- Centers for Disease Control Prevention. 2000. Boys body mass index-for-age percentiles. National Center for Health Statistics CDC Growth Charts: United States, 2 to 20 year. http://www.cdc.gov/growthcharts/clinical_charts.htm.
- Chao EYS, Armiger RS, Yoshida H, Lim J, Haraguchi N. 2007. Virtual Interactive Musculoskeletal System (VIMS) in orthopaedic research, education and clinical patient care. J Orthop Surg Res. 2:2.
- Correa TA, Pandy M. 2012. On the potential of lower limb muscles to accelerate the body’s centre of mass during walking. Comput Methods Biomech Biomed Eng. 16(9):1013–1021.
- Correa TA, Pandy MG. 2011. A mass-length scaling law for modeling muscle strength in the lower limb. J Biomech. 44(16):2782–2789.
- Correa TA, Baker R, Graham HK, Pandy MG. 2011. Accuracy of generic musculoskeletal models in predicting the functional roles of muscles in human gait. J Biomech. 44(11):2096–2105.
- Delp SL, Anderson FC, Arnold AS, Loan P, Habib A, John CT, Guendelman E, Thelen DG. 2007. OpenSim: open-source software to create and analyze dynamic simulations of movement. IEEE Trans Biomed Eng. 54(11):1940–1950.
- Delp SL, Loan JP, Hoy MG, Zajac FE, Topp EL, Rosen JM. 1990. An interactive graphics-based model of the lower extremity to study orthopaedic surgical procedures. IEEE Trans Biomed Eng. 37(8):757–767.
- Dorn TW, Lin Y-C, Pandy MG. 2012. Estimates of muscle function in human gait depend on how foot-ground contact is modelled. Comput Methods Biomech Biomed Eng. 15(6):657–668.
- Dorn TW, Schache AG, Pandy MG. 2012. Muscular strategy shift in human running: dependence of running speed on hip and ankle muscle performance. J Exp Biol. 215(Pt 11):1944–1956.
- Dorn TW. 2008. Gait extraction toolbox. https://simtk.org/home/c3dtoolbox/.
- Fok LA, Schache AG, Crossley KM, Lin Y-C, Pandy MG. 2013. Patellofemoral joint loading during stair ambulation in people with patellofemoral osteoarthritis. Arthritis Rheum. 65(8):2059–2069.
- Garner BA, Pandy MG. 2001. Musculoskeletal model of the upper limb based on the visible human male dataset. Comput Methods Biomech Biomed Eng. 4(2):93–126.
- Hainisch R, Gfoehler M, Zubayer-Ul-Karim M, Pandy MG. 2012. Method for determining musculotendon parameters in subject-specific musculoskeletal models of children developed from MRI data. Multibody Syst Dyn. 28(1–2):143–156.
- Hainisch R. 2015. Analysis of muscle coordination in crouched gait of children with Cerebral palsy. [PhD thesis]. TU Wien. 10.34726/r005.2015
- Hegarty AK, Kurz MJ, Stuberg W, Silverman AK. 2016. Changes in mobility and muscle function of children with cerebral palsy after gait training: a pilot study. J Appl Biomech. 32(5):469–486.
- Kainz H, Wesseling M, Pitto L, Falisse A, Van Rossom S, Van Campenhout A, De Groote F, Desloovere K, Carty C, Jonkers I. 2018. Impact of subject-specific musculoskeletal geometry on estimated joint kinematics, joint kinetics and muscle forces in typically developing children. Gait Posture. 65:223–225.
- Kainz H, Hoang HX, Stockton C, Boyd RR, Lloyd DG, Carty CP. 2017. Accuracy and reliability of marker-based approaches to scale the pelvis, thigh, and shank segments in musculoskeletal models. J Appl Biomech. 33(5):354–360.
- Klein Horsman MD, Koopman HFJM, van der Helm FCT, Prosé LP, Veeger HEJ. 2007. Morphological muscle and joint parameters for musculoskeletal modelling of the lower extremity. Clin Biomech (Bristol, Avon)). 22(2):239–247.
- Lai A, Schache AG, Lin Y-C, Pandy MG. 2014. Tendon elastic strain energy in the human ankle plantar-flexors and its role with increased running speed. J Exp Biol. 217(Pt 17):3159–3168.
- Lebiedowska MK, Polisiakiewicz A. 1997. Changes in the lower leg moment of inertia due to child’s growth. J Biomech. 30(7):723–728.
- Lieber RL. 1986. Skeletal muscle adaptability. I: review of basic properties. Dev Med Child Neurol. 28(3):390–397.
- Lin Y-C, Fok LA, Schache AG, Pandy MG. 2015. Muscle coordination of support, progression and balance during stair ambulation. J Biomech. 48(2):340–347.
- Modenese L, Montefiori E, Wang A, Wesarg S, Viceconti M, Mazzà C. 2018. Investigation of the dependence of joint contact forces on musculotendon parameters using a codified workflow for image-based modelling. J Biomech. 73:108–118.
- Myers CA, Laz PJ, Shelburne KB, Davidson BS. 2015. A probabilistic approach to quantify the impact of uncertainty propagation in musculoskeletal simulations. Ann Biomed Eng. 43(5):1098–1111.
- O’Brien TD, Reeves ND, Baltzopoulos V, Jones DA, Maganaris CN. 2010. Muscle-tendon structure and dimensions in adults and children. J Anat. 216(5):631–642.
- Pandy MG. 1999. Moment arm of a muscle force. Exerc Sport Sci Rev. 27:79–118.
- Pandy MG, Andriacchi TP. 2010. Muscle and joint function in human locomotion. Annu Rev Biomed Eng. 12:401–433.
- Passmore E, Lai A, Sangeux M, Schache AG, Pandy MG. 2017. Application of ultrasound imaging to subject-specific modeling of the human musculoskeletal system. Meccanica. 52(3):665–676.
- Pitto L,Kainz H,Falisse A, et al. 2019. SimCP: A Simulation Platform to Predict Gait Performance Following Orthopedic Intervention in Children With Cerebral Palsy. Front Neurorobot. 13(54).
- Redl C, Gfoehler M, Pandy MG. 2007. Sensitivity of muscle force estimates to variations in muscle-tendon properties. Hum Mov Sci. 26(2):306–319.
- Scheys L, Spaepen A, Suetens P, Jonkers I. 2008a. Calculated moment-arm and muscle-tendon lengths during gait differ substantially using MR based versus rescaled generic lower-limb musculoskeletal models. Gait Posture. 28(4):640–648.
- Scheys L, Van Campenhout A, Spaepen A, Suetens P, Jonkers I. 2008b. Personalized MR-based musculoskeletal models compared to rescaled generic models in the presence of increased femoral anteversion: effect on hip moment arm lengths. Gait Posture. 28(3):358–365.
- Scovil CY, Ronsky JL. 2006. Sensitivity of a Hill-based muscle model to perturbations in model parameters. J Biomech. 39(11):2055–2063.
- Steele KM, Seth A, Hicks JL, Schwartz MS, Delp SL. 2010. Muscle contributions to support and progression during single-limb stance in crouch gait. J Biomech. 43(11):2099–2105.
- Valente G, Pitto L, Testi D, Seth A, Delp SL, Stagni R, Viceconti M, Taddei F. 2014. Are subject-specific musculoskeletal models robust to the uncertainties in parameter identification? PLoS One. 9(11):e112625.
- Ward SR, Eng CM, Smallwood LH, Lieber RL. 2009. Are current measurements of lower extremity muscle architecture accurate? Clin Orthop Relat Res. 467(4):1074–1082.
- Weijs W, Hillen B. 1985. Cross-sectional areas and estimated intrinsic strength of the human jaw muscles. Acta Morphol Neerl Scand. 23(3):267–274.
- Zajac FE. 1989. Muscle and tendon: properties, models, scaling, and application to biomechanics and motor control. Crit Rev Biomed Eng. 17(4):359–411.
- Zajac FE, Gordon ME. 1989. Determining muscle’s force and action in multi-articular movement. Exerc Sport Sci Rev. 17:187–230.
- Żuk M, Syczewska M, Pezowicz C. 2018. Sensitivity analysis of the estimated muscle forces during gait with respect to the musculoskeletal model parameters and dynamic simulation techniques. J Biomech Eng. 140(12):121001.