
 ?Mathematical formulae have been encoded as MathML and are displayed in this HTML version using MathJax in order to improve their display. Uncheck the box to turn MathJax off. This feature requires Javascript. Click on a formula to zoom.
Abstract
Vestibular aqueduct is a precise structure embedded in the temporal bone and plays a key role in the physiological function of inner ear by maintaining the endolymphatic circulation and buffering the impact from intracranial pressure. Although the alterations on the morphology or volume of vestibular aqueduct result in variety of diseases, the approaches of evaluating the condition of vestibular aqueduct are still unsatisfing because the pathological sections utilized for the 3D construction model most likely undergoes morphological changes. In this study, the vestibular aqueduct images obtained by CT scanning were processed by finite element method to construct the 3D model. To assess if this numerical model reflects the actual biomechanical properties of vestibular aqueduct, the fluid-solid coupling calculation was applied to simulate the endolymphatic flow in the vestibular aqueduct. By measuring the dynamics of endolymphatic flow, and the pressure and displacement on round membrane under external pressure, we found the numerical 3D model recapitulated the biomechanical characteristics of the real vestibular aqueduct. In summary, our approach of 3D model construction for vestibular aqueduct will provide a powerful method for the research of vestibular aqueduct-related diseases.
1. Introduction
As the bony tunnel inside the petrous pyramid of temporal bone, vestibular aqueduct (VA) starts from the medial wall of inner ear vestibule, extends parallel to the common crus, passes the anterior opening of sigmoid sinus and terminates at the posterior cranial fossa (Alemi and Chan Citation2015; Clarós et al. Citation2017). VA is filled with endolymphatic ducts connecting endolymphatic sac, inner ear vestibule and cochlea together, which plays a critical role in maintaining the metabolism and environment of membranous labyrinth and inner ear by draining the metabolic products in semicircular canals and utricle into sigmoid sinus (Ferster et al. Citation2017; Mendenhall et al. Citation2018). Therefore, VA is also putatively regarded as a crucial structure to ensure the circulation between endolymphma and perilympha, which deficiency can impair the nutrition of inner ear cells, the sonic transduction to hairy cells and balance sensation of sensory cells. Clinically, the dilation and constriction of VA cause congenital sensorineural deafness and Meniere disease, respectively (Sennaroglu et al. Citation2001; Song et al. Citation2018; Bächinger et al. Citation2019). For instance, VA can buffer intracranial pressure by connecting cochlea aqueduct and cerebrospinal fluid, while the buffer capability of an enlarged VA is dramatically decreased (Carlborg and Farmer Citation1983; Walsh et al. Citation1999). In such condition, a sudden increased intracranial pressure will be directly transmitted to inner ear via the enlarged VA, leading to sudden deafness, vertigo and tinnitus by breaking the membranous labyrinth and mixing the endo- and perilymphma. Therefore, the investigation on the morphology and biomechanical characteristics of the VA would shed light on the understanding of the VA or lympha associated diseases.
The inner ear is embedded deeply in temporal bone, making its elaborate structure hard to be accessed by routine approaches. Although the CT image can demonstrate the labyrinth in detail, it only predicts the lesion extent by measuring external opening of VA because the VA is far more tiny than the labyrinth (Takagi and Sando Citation1989; Koesling et al. Citation2006; Maiolo et al. Citation2013; Santos et al. Citation2017). Taking the advantage of histological and pathological knowledge accumulated in the past decades, the precise structure of VA can be read in the histological sections (Arnold and Lang Citation2001). However, the complicated manipulation during the section preparation is prone to change the original shapes of samples, making the histological images unreliable for the three dimensional re-construction, especially for the elaborate structure of VA. Thus, the 3D numerical model based on the high resolution CT or MRI images seems to be the only means to get an accurate 3D model of VA.
Currently, not only the rigid structure, but also the biomechanical property of VA attracts the more and more concentration of researchers (Wilbrand et al. Citation1974; Lei et al. Citation2003). Since the physiological function of VA is performed by the endolymphatic fluid which current distribution, velocity and pressure are affected by the morphology of VA, the interactions between the solid wall of VA and the flow of endolympha actually determine the auditory function and sensory balance. For example, the dilated VA can reverse the flow of endolympha, resulting in the high osmotic fluid from endolymphatic sac into cochlea and vestibule (utricle and saccule) (Takeuchi et al.Citation1990; Andrews Citation1997). Then, the back-flowed endolymphatic fluid causes sensorineural deafness by injuring the hair cells on basal membrane of cochlea, and vertigo by damaging the sensory neuroepithelial cells in utricle and saccule.
In this study, we not only reconstructed a numerical 3D model of a normal VA for its static morphology and structure, but also simulated the biomechanical dynamics of this finite element model based on the fluid-solid coupling analysis. Our model would provide a powerful method for biomechanical study of inner ear, as well as to find out the biomechanical pathogenic mechanism of VA related disorders.
2. Materials and methods
2.1. Sample and scanning
A temporal bone fixed in 10% formaldehyde solution was obtained from the Anatomy Center of Dalian Medical University. The donor was a 62 years old male donor without the history of auditory diseases. A patch of 10 × 8 × 5 cm (containing cochlea, semicircular canals and vestibule) was dissected from the left temporal bone for Micro-CT scanning (GE explore Locus). It took 35 minutes to scan the patch in the layer thickness of 55 μm and got 253 images containing inner ear.
2.2. CT image selection and 3D model construction
The 253 images in DICOM format were processed with Mimics 20.0 was utilized for 3D reconstruction by the Precision T7810 workstation with the CPU of Intel® E5-2620 v3. The different densities in the sample were distinguished by the gray scale from to −1204 to −657 in the DICOM images. In the mask of the inner ear produced by Mimics 20.0, only the cochlea, semicircular canals, vestibule and VA were preserved to reconstruct the 3D model of membranous labyrinth in the format of Binary STL. The STL files were processed by Geomagic 12.0 for polishing, denoising and meshing to get the 3D model with smooth surface. The diameters and areas of VA and round window were measured in the model for further finite element analysis.
2.3. Finite element model and numerical simulation
The model was imported into Ansys 15.0 for mesh generation and numerical simulation.
The current state was calculated by Reynolds number (Re): the dynamic viscosity of endolympha (μ) was 1 × 10⁻³ Pa·S, density (ρ) was 1000kg/m3 and velocity (v) was 5.74 cm/s (Dickman and Correia Citation1989; Li et al. Citation2012); the internal diameter of VA (d) was 0.86 mm; the round membrane was designed as exit with a elastic modulus of 3MPa, a thickness of 70 μm, a diameter of 1.608 mm, area of 2.03 mm2 and Poisson's ratio was 0.3 (Carpenter et al. Citation1989).
Since Re = ρvd/μ, when d = 1 mm, the Re= 1000 × 0.00547 × 0.00086/1 × 10−3 ≈ 5. In such case, the influence of viscosity is larger than the force of inertia, in which the current is supposed to be laminar flow. Therefore, the laminar formula was applied in the fluid-solid couple calculation.
2. The fluid-solid coupling interactions between the endolymphmatic flow and the bony wall of VA were analyzed by the Ansys 15.0.
The main governing equation of fluid:
(1) continuity equation:
(2) Navier-Stokes equation:
(3) The governing equation of solid:
solid density (Ρs), the structural displacement field of solid (
(4) Fluid-solid Coupling Boundary Condition:
Here, the shear tensors on the mass points of solid boundary (τƒ), and the shear tensors on the mass points of fluid boundary (τs). The displacements of the mass points in solid (ds), and the displacements of the mass points in fluid (df).
3. Pressure setting
Since the previous study demonstrated that the pressure of cerebrospinal fluid could rise from 0.5 kPa to 300 kPa under impacts (Cao et al. Citation2016), we set a sine pressure confined to Weibull distribution onto the 3D model. The fluid-solid coupling calculation was performed under the pressure loading lasting 0.02 s, the time step of 200 and the pressure of 200 kPa.
(5) Weibull distribution:
3. Results
3.1. The construction and mesh generation of the 3D model of VA
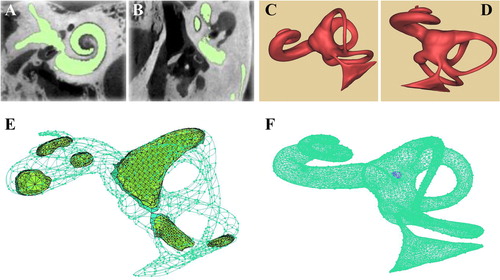
By utilizing Mimics 20.0, the DICOM images of the CT scanning were treated to form the mask of inner ear (). Then, according to the different gray scale of the tissues, only the regions of cochlea, semicircular canals, vestibule and VA were collected for 3D reconstruction. After polished by Geomagic studio 12.0, the smooth 3D model of inner ear was present as in . The 3D model of inner ear was meshed by ANSYS and divided into 4 parts, including entrance (the touching surface between endolymphatic sac and cerebral dura mater), exit (the surface of round window), surface mesh (the surface between entrance and exit) and body mesh (the fluid between entrance and exit). The meshed 3D model was a mixture of tetrahedron body and the boundary of 3 layers of prism by adjusting mesh number, and the maximal and minimal size of the mesh (). The fluid part of the three-dimensional model of the inner ear was meshed into 77,824 nodes, 228,893 elements and 41,581 tetrahedra. In the solid module, the selected membrane portion of the round window is grid separately by the Ansys Transient Structural into 868 nodes and 5319 elements. According to the 3D model, we measured the middle segment of VA diameter as 0.58 mm, the exit diameter as 0.86 mm. Since the VA width was reported as 0.4–1.0 mm, averagely 0.7 mm (Paparella et al. Citation1983), this model was suggested to reflect the normal morphology of VA, and fit for further biomechanical study.
Figure 1. Generating 3D model of inner ear (A, B) the mask of the inner ear in Mimics 20.0; (C, D) the reconstruction model of 3D structure of inner ear; (E, F) the finite element mesh.
3.2. Boundary conditions and model set up
To perform the independence tests on the pressure, displacement and velocity in the simulation, we set the round window without membrane as the exit and only the flow in the 3D model was taken into account. Since the exit was communicated with atmosphere, the wall velocity was supposed to be zero. Because the structure key to flow state was located in VA, the velocity and pressure on the narrowest cross section of the VA in the 3D model were measured to evaluate the fluid dynamics ().
Figure 2. Parameters on the 3D model (A, B) the narrowest cross section of the inner ear model; (C) the time step-pressure function for the simulated external forces; (D) the speed-displacement curve under different grids.
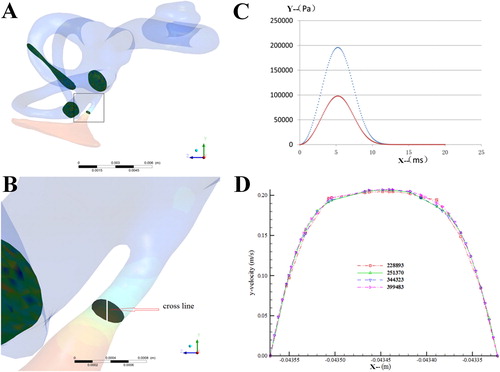
For the fluid-solid coupling calculation of the endolymphatic fluid in the VA model, the pressure loading time was set as 0.02 s, the time step as 200 steps and the maximal pressure as 200 kPa (). The round membrane was designed as the solid phase and meshed by Ansys Transient Structural into 5319 elements and 868 nodes. The pressure loading, namely the pressure of the VA endolymphatic fluid under external force, was transmitted by System Coupling onto the fluid-solid interface (FSI) in the VA model. The displacement of the solid phase by external force would be transmitted to FSI in the fluid field to realize the continuous transmission between force and displacement.
To obtain the convincing data, the independence tests were checked in the 3D model with the several different mesh numbers. However, we found that when the mesh number was over 220,000, the velocity-displacement curves in the points of the narrowest cross section were approximate to one another (), indicating that the difference in mesh numbers led to little variance and one of the mesh numbers was adequate to the simulation. Thus, we selected the smaller mesh number, 228,893, in further study to reduce the work load of the fluid-solid coupling calculation.
3.3. The biomechanical property of VA in fluid-solid coupling calculation
In such conditions, the simulation of endolymphatic flow in the 3D model showed that except in the exit and adjacent region of VA, the flow currents in the field of bony labyrinth were homogenous. The static pressure in the VA was distributed evenly along the full length duct, but much lower than those in other parts of the model (). Even when the intracranial pressure reached 100 Pa, it would decrease dramatically to −3.21 Pa in the narrowest section of VA after delivered into the endolymphatic fluid through the endolymphatic sac in bony labyrinth. On the other hand, the velocity of the endolymphatic fluid was evenly distributed in the VA, but reduced noticeably at the exit. The maximal velocity of 0.37 m/s was detected in the narrowest section of VA, which diameter was 0.58 mm. In contrast, the velocities in the bony semicircular canals and cochlea were almost identical and close to 0 m/s ().
Figure 3. The simulated biomechanical properties of the 3D model (A) pressure cloud of the bony labyrinth in the inner ear; (B) velosity cloud of the bony labyrinth in the inner ear; (C) pressure variation curve of inlet surface and fluid-solid coupled surface; (D) displacement curve of the round membrane.
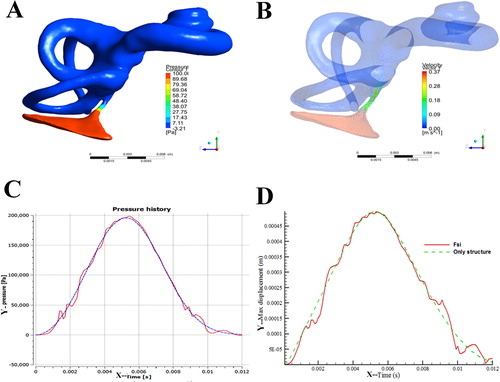
We found that in the pressure entrance, when 200 kPa was exerted in the manner of Weibull distribution, the entrance pressure presented as a smooth curve with the time duration and raised rapidly from 0.001 to 0.002 s (). However, the pressure on round membrane, which passed through VA and bony labyrinth, gave rise to the repeated resilience, though the tendency of its changing curve was similar to that of the entrance pressure. The displacement of round membrane would almost linearly raise from 0.001 to 0.002 s if the pressure was exerted on the round membrane (). When the pressure was buffered by VA, the displacement of round membrane increased a little slower and the resilience also took place ().
4. Conclusion and discussion
As one of the most practical biomechanical technologies, the fluid-solid coupling dynamics has been widely applied in biomedical research. Fluid-solid coupling dynamics is characterized by the interactions between the fluid and solid phases, in which the flexible surfaces of the solid phase are altered by flow current and vice vers. In human, the typical fluid-solid coupling fields are detected in the airway (between air flow and bronchi), coronary artery (between blood flow and vessel walls) and capillary vessels (between serum flow and red blood cells) (Soltani and Chen Citation2013; Ii and Wada Citation2017; Samaee et al. Citation2017). In our research, fluid-solid coupling dynamics was analyzed in the inner ear and VA for the first time to disclose the pathophysiological mechanism of inner ear diseases.
As the narrowest part of membranous labyrinth, Reissner's membrane separates endolympha from perilympha. However, there is no tension exerted on the Reissner's membrane, through which the pressure can be transmitted from perilympha into endolympha without significant decrease (Takeuchi et al. Citation1990). Thus, in the fluid-solid coupling calculation with the 3D model, the physiological pressure ranging from −100 to 700 Pa, averagely 200 Pa, of the endolympha of VA, is supposed to be exerted on round and basal membrane (Andrews Citation1997). So the displacement on round membrane is suggested to reflect the displacement on basal membrane.
The fluid-solid coupling analysis in our 3D model demonstrated that although the intracranial pressure transmitted onto the round membrane through VA and bony labyrinth was reduced little, it occurred fluctuation and resilience on the membrane, which prevented the load on the membrane from a rapid increase. Similarly, the displacement of the round membrane resulting from the pressure also fluctuated and increased step by step. Both the pressure and displacement of the round membrane suggested that VA could buffer the intracranial pressure into inner ear, which protected the basal membrane of inner ear by avoiding a rapid increased pressure into endo- and perilymphatic fluid.
In the normal condition, the impact from intracranial pressure is buffered by endolymphatic sac to prevent the violent displacements on basal and Reissner's membrane, through which the auditory function of inner ear is maintained (Takeuchi et al. Citation1990; Andrews Citation1997). The endolymphatic sac is connected to membranous labyrinth only by the endolymphatic duct in VA. Thus, the status of endolymphatic sac is directly affected by VA. A narrowed VA would decrease the flow from membranous labyrinth into endolymphatic sac and resulted in hydro-labyrinth. Previous study suggested the etiological relationship between a narrowed VA and Ménière disease (Yamamoto et al. Citation1992; Krombach et al. Citation2005). By the measurement on 3D model, the width of the VA exit in Ménière patients (4.02 ± 1.42 mm) were reduced remarkably compared with those in the normal (6.67 ± 1.78 mm) and chronic otitis patients (6.44 ± 1.66 mm).
On the other hand, a dilated VA is incapable of limiting the pressure and flow of endolymphatic fluid, in which the intracranial pressure will be transmitted to membranous labyrinth and cause rapid displacement on round membrane (Naganawa et al.Citation2000). In the severe extent of VA dilation, the increased pressure of endolymphatic fluid may result in hydro-labyrinth or even rupture (Okumura et al.Citation1995). Clinically, the large vestibular aqueduct syndrome (LVAS) usually leads to sensorineural hearing loss, or even complete deafness (Gussen Citation1980). Since the VA embolism benefited little to LVAS due to hearing loss (Welling et al. Citation1999), a device preventing VA dilation is the preferred choice for the LVAS therapy. However, the biomechanical properties of VA are currently inadequate for the design of such device. Inner ear is tiny and complicated, in which VA is the longest and narrowest structure. How to get the anatomical morphology is the most challenging problem tangling researchers and clinicians. Our study established a panorama of the vestibular aqueduct through the 3d reconstruction of the inner ear, and revealed the physiological significance of vestibular aqueduct by numerical simulation. Up to now, the numerical simulation of VA is regarded to have practical significance to the disease of the vestibular aqueduct, especially the large vestibular aqueduct syndrome. This study mainly aimed at the three-dimensional reconstruction of the vestibular aqueduct to get a preliminary numerical simulation to analyze VA biomechanical value. The purpose of this study is to find out the biomechanical mechanism resulting in the large vestibular aqueduct, and to lay a foundation for further treatment. In this study, our 3D model of the inner ear and simulation of VA biomechanical behavior were consistent to the physiological status. Therefore, our approaches for 3D model construction and the fluid-solid coupling calculation will contribute to the device design and the evaluation of LVAS therapy.
Disclosure statement
No potential of interests was reported by authors.
Additional information
Funding
References
- Alemi AS, Chan DK. 2015. Progressive hearing loss and head trauma in enlarged vestibular aqueduct: a systematic review and meta-analysis. Otolaryngol Head Neck Surg. 153(4):512–517.
- Andrews JC. 1997. Laboratory experience with experimental endolymphatic hydrops. Otolaryngol Clin North Am. 30(6):969–976.
- Arnold WH, Lang T. 2001. Development of the membranous labyrinth of human embryos and fetuses using computer aided 3D-reconstruction. Ann Anat. 183(1):61–66.
- Bächinger D, Luu NN, Kempfle JS, Barber S, Zürrer D, Lee DJ, Curtin HD, Rauch SD, Nadol JD Jr, Adams JC, Eckhard AH. 2019. Vestibular aqueduct morphology correlates with endolymphatic sac pathologies in Menière's disease: a correlative histology and computed tomography study. Otol Neurotol. 40(5):e548–e555.
- Cao L, Huang J, Jin K. 2016. Development and validation of the 1.5-year-old child head FE model. Chin J Biomed Eng. 35(4):435–444.
- Carlborg BI, Farmer JC Jr. 1983. Transmission of cerebrospinal fluid pressure via the cochlear aqueduct and endolymphatic sac. Am J Otolaryngol. 4(4):273–282.
- Carpenter AM, Muchow D, Goycoolea MV. 1989. Ultrastructural studies of the human round window membrane. Arch Otolaryngol Head Neck Surg. 115(5):585–590.
- Clarós P, Fokouo JV, Clarós A. 2017. Cochlear implantation in patients with enlarged vestibular aqueduct. A case series with literature review. Cochlear Implants Int. 18(3):125–129.
- Dickman JD, Correia MJ. 1989. Responses of pigeon horizontal semicircular canal afferent fibers. I. Step, trapezoid, and low-frequency sinusoid mechanical and rotational stimulation. J Neurophysiol. 62(5):1090–1101.
- Ferster APO, Cureoglu S, Keskin N, Paparella MM, Isildak H. 2017. Secondary endolymphatic hydrops. Otol Neurotol. 38(5):774–779.
- Gussen R. 1980. Histological evidence of specialized microcirculation of the endolymphatic sac. Arch Otorhinolaryngol. 228(1):7–10.
- Ii S, Wada S. 2017. Direct numerical simulation of expiratory crackles: relationship between airway closure dynamics and acoustic fluctuations. J Biomech. 50(50):234–239.
- Koesling S, Rasinski C, Amaya B. 2006. Imaging and clinical findings in large endolymphatic duct and sac syndrome. Eur J Radiol. 57(1):54–62.
- Krombach GA, van den Boom M, Di Martino E, Schmitz-Rode T, Westhofen M, Prescher A, Günther RW, Wildberger JE. 2005. Computed tomography of the inner ear: size of anatomical structures in the normal temporal bone and in the temporal bone of patients with Menière's disease. Eur Radiol. 15(8):1505–1513.
- Lei L, Han DM, Yu ZK, Zhu XN, Liu S, Chen SB, Fan EZ. 2003. Analysis of growth model in vestibular aqueduct during human fetal development [in Chinese]. Zhonghua Er Bi Yan Hou Ke Za Zhi. 38(4):275–278.
- Li M, Zhang B, Zhou Z, Yu H, Liu H, Zhu B. 2012. The application of MRI on study of inner ear perilymph flow. Chin Comput Med Image. 18(4):298–302.
- Maiolo V, Savastio G, Modugno GC, Barozzi L. 2013. Relationship between multidetector CT imaging of the vestibular aqueduct and inner ear pathologies. Neuroradiol J. 26(6):683–692.
- Mendenhall WM, Suárez C, Skálová A, Strojan P, Triantafyllou A, Devaney KO, Williams MD, Rinaldo A, Ferlito A. 2018. Current treatment of endolymphatic sac tumor of the temporal bone. Adv Ther. 35(7):887–898.
- Naganawa S, Koshikawa T, Iwayama E, Fukatsu H, Ishiguchi T, Ishigaki T, Ikeda M, Nakashima T, Ichinose N. 2000. MR imaging of the enlarged endolymphatic duct and sac syndrome by use of a 3D fast asymmetric spin-echo sequence: volume and signal-intensity measurement of the endolymphatic duct and sac and area measurement of the cochlear modiolus. AJNR Am J Neuroradiol. 21(9):1664–1669.
- Okumura T, Takahashi H, Honjo I, Takagi A, Mitamura K. 1995. Sensorineural hearing loss in patients with large vestibular aqueduct. Laryngoscope. 105(3 Pt 1):289–294.
- Paparella MM, Schachern PA, Choo YB. 1983. The round window membrane: otological observations. Ann Otol Rhinol Laryngol. 92(6 Pt 1):629–634.
- Samaee M, Tafazzoli-Shadpour M, Alavi H. 2017. Coupling of shear-circumferential stress pulses investigation through stress phase angle in FSI models of stenotic artery using experimental data. Med Biol Eng Comput. 55(8):1147–1162.
- Santos FC, Belinha J, Gentil F, Parente M, Jorge NR. 2017. An alternative 3D numerical method to study the biomechanical behaviour of the human inner ear semicircular canal. Acta Bioengineer Biomech. 19(1):3–15.
- Sennaroglu L, Yilmazer C, Basaran F, Sennaroglu G, Gursel B. 2001. Relationship of vestibular aqueduct and inner ear pressure in Meniere's disease and the normal population. Laryngoscope. 111(9):1625–1630.
- Soltani M, Chen P. 2013. Numerical modeling of interstitial fluid flow coupled with blood flow through a remodeled solid tumor microvascular network. PLoS One. 8(6):e67025.
- Song JJ, Hong SK, Lee SY, Park SJ, Kang SI, An YH, Jang JH, Kim JS, Koo JW. 2018. Vestibular manifestations in subjects with enlarged vestibular aqueduct. Otol Neurotol. 39(6):e461–e467.
- Takagi A, Sando I. 1989. Computer-aided three-dimensional reconstruction: a method of measuring temporal bone structures including the length of the cochlea. Ann Otol Rhinol Laryngol. 98(7 Pt 1):515–522.
- Takeuchi S, Takeda T, Saito H. 1990. Pressure relationship between perilymph and endolymph in guinea pigs. Acta Otolaryngol. 109(1-2):93–100.
- Walsh RM, Ayshford CA, Chavda SV, Proops DW. 1999. Large vestibular aqueduct syndrome. ORL J Otorhinolaryngol Relat Spec. 61(1):41–44.
- Welling DB, Slater PW, Martyn MD, Antonelli PJ, Gantz BJ, Luxford WM. 1999. Sensorineural hearing loss after occlusion of the enlarged vestibular aqueduct. Otol Neurotol. 20(3):338–343.
- Wilbrand HF, Rask-Andersen H, Gilstring D. 1974. The vestibular aqueduct and the para-vestibular canal. An anatomic and roentgenologic investigation. Acta Radiol Diagn (Stockh). 15(4):337–355.
- Yamamoto E, Mizukami C, Ohmura M. 1992. Investigation of the external aperture of the vestibular aqueduct in Menière's disease by three-dimensional image analysis. Acta Otolaryngol. 112(1):31–35.