
Abstract
Purpose
Measure the reduction quality of calcaneal fractures on 3 D segmented images.
Methods
The Ethics Review Board approved this study and written informed consent was collected from all patients. Bilateral CT scans of fifty-four patients with unilateral displaced calcaneal fracture were obtained before and after osteosynthesis. Orientation angle of the posterior subtalar joint facet (PTC) of displaced intra-articular calcaneal fractures of 54 patients was measured on segmented 3 D images before and after surgery and compared to the uninjured side. This orientation angle (OAC) is the average of every normal vector of each point of the PTC, as compared to the main calcaneal axis (calculated by first principal component analysis). The PTC is a well-known anatomical structure, relatively easy to identify on 3 D imaging.
Results
This OAC angle was low before surgery (mean= 95°, std dev= 6°), statistically significantly different from the uninjured side value, p < 0.001. The OAC angle of the operated bone was nearly equal to the uninjured side (mean= 103°, std dev= 5°), without any statistically significant difference between postoperative values and uninjured side values. We found linear correlation between the quality of the reduction when assessed with this OAC and the functional score (AOFAS) (Adjusted R2=0.62, p = 0.04).
Conclusions
This angle seems to be useful to quantify the quality of the operative reduction of displaced intra-articular calcaneal fractures.
Introduction
Surgeons who specialize in calcaneal fracture agree that in most patients surgical managements yield the best result (Buckley et al. Citation2002). Functional outcome is largely dependent on preventing complications and restoring anatomy of the calcaneus. Reconstruction of height and subtalar joint congruency of the posterior subtalar joint, for example, are both associated with improved outcome (Schepers and Misselyn Citation2017).
The quality of the reduction is currently assessed by measuring the Böhler’s Angle (BA) on a postoperative X-ray. According to several studies (Böhler Citation1931; Hauser Citation1975; Chen Citation1991), the BA is symmetrical: the contralateral value can be used as reference in the assessment of the calcaneal anatomy after osteosynthesis. But if some authors found some correlation between functional outcome and reduction quality (as defined by a BA close to the uninjured side value) (Paul Citation2004; Buckley Citation1999; Paley Citation1993; Janzen Citation1992), others authors (Ebraheim Citation2000; Hutchinson Citation1994; Kundel Citation1996; Ibrahim Citation2007; Lee Citation2018; Mauffrey Citation2009; Schepers Citation2007) found no correlation at all, probably because of the lack of accuracy of measurements on X-ray.
Others authors used CT scan imaging instead of X-ray, but they were no more successful in finding correlation between BA and outcome, probably because they were assessing the reduction on a specific slice of CT, and not on the whole extent of the bone (Stephan et al. Citation2014).
Because of the complexity of the calcaneal anatomy, authors are using 3 D imaging to prepare osteosynthesis and to improve communication with the patient (Montgomery Citation2020; Halai Citation2020).
Stephan (2013) described a computational tool that performed several measurements on 3 D reconstruction images of healthy pairs of feet of patients. He found symmetrical values, and therefore he proposed the use of these 3 D measurements to assess the quality of the calcaneal reduction, by comparing the 3 D reconstruction images of the treated bone to its uninjured counterpart. His automated algorithm proposes “to quantify the integrity of the joint surfaces of the calcaneus.” Another study on healthy feet found symmetry (Misselyn 2018). We used one of these measurements, the orientation angle of the posterior subtalar joint facet of the calcaneus (OAC), to assess the reduction quality of calcaneal fractures.
The use of 3 D imaging makes sense: it is very close to the conditions during surgery.
The use of the PTC as anatomical landmark also makes sense: it is a well-known, easily identifiable anatomical structure on 3 D CT images (much harder to recognize on X-ray images) and its congruency must absolutely be restored in order to avoid subtalar osteoarthritis (Buckley et al. Citation2002). The use of the first principal component (FPC) axis reasonably approximates the calcaneal main direction (Gutekunst et al. Citation2013).
In case of fracture, there is an upward movement of the tuber, because of the traction of the Achilles tendon, and a downward movement of the PTC, the joint depression, caused by the talus. The latter can be measured by the general orientation of the PTC facet (Stephan et al. Citation2014) and the former by the FPC axis orientation.
The aim of this study is to see if the OAC described by Stephan on healthy feet could be used on fractured calcaneus to assess the quality of the reduction after surgical treatment. After measuring the OAC of the calcaneus after osteosynthesis, a value lower than the uninjured side may imply a worse outcome, while a value close to the uninjured side implies a good outcome.
Material and methods
Between January 2015 and October 2018, 54 patients with unilateral and isolated DIACF (11 women, 43 men; age 51 ± 16 years, range 19 − 83 years) were operatively treated at our hospital and underwent CT scans of the uninjured foot and of the injured one, before and just after surgery. All patients included in the study read and signed an informed consent document outlining the research protocol and associated risks and benefits. The research protocol (S57311) was approved by the Ethics Review Board of the Leuven University Hospital.
The CT images were recorded using an Aquilion One Volume CT scanner (Toshiba, Tokyo, Japan), with a table pitch of 0.641, collimation of 0.5 × 64, slice thickness of 0.5 mm, slice increment of 0.5 mm, and rotation time of 0.5 second.
All calcaneal fractures were classified using the Sanders classification. From the 54 fractures, 6 were Sanders I fractures, 34 Sanders II, 9 Sanders III, and 5 Sanders IV.
Surgical technique and postoperative management
Operation was performed with the classical L-shape incision. After reduction, definitive fixation was achieved by an anatomical calcaneal plate.
All patients were routinely seen for follow up at 6 weeks, 3, 6 and 12 months after operation, with clinical examination and X-ray follow-up. Functional outcomes were assessed based upon American Orthopaedics Foot & Ankle Society hind foot score (AOFAS).
3D reconstruction images
DICOM images were imported in Mimics software (Materialise™, Leuven, Belgium), to create 3 D images after reconstruction and segmentation, with digital removal of the adjacent bones. Stereolithographic 3 D images were imported in a home-made computational tool using MeVis™ Lab technologies (Fraunhofer Mevis™, Bremen, Germany).
On 3 D images on screen, the joint facet of the PTC may be marked manually in this MeVis Lab™ application.
After the determination of the PTC joint surfaces (), 3 D orientations angles were calculated. These 3 D orientations angles were determined with the principal component analysis (PCA). Every triangle of the mesh of the joint surface was considered as a planar surface (). The normal vectors of these planar surfaces were calculated. The 3 D orientation of the PTC joint surface was the average of the angles of these normal vectors and the FPC of the calcaneus.
Figure 1. The posterior talo-calcaneal (PTC) joint facet marked on 3 D reconstruction image of calcaneus (the color indicates the shortest distance (in mm) to the corresponding structure of the talus). The same color scale was used for every observation.
A color scale of the distances was used in place of a color scale of the angles, to avoid influencing observer decision.
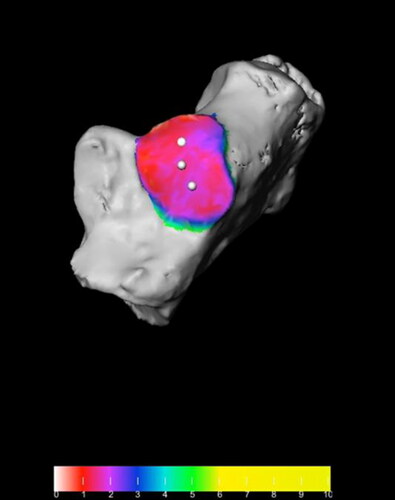
Figure 2. The marked joint facet is divided into small triangular meshes, each mesh has a single normal vector.
Meshes are drawn in yellow color for visualization of the triangles network.
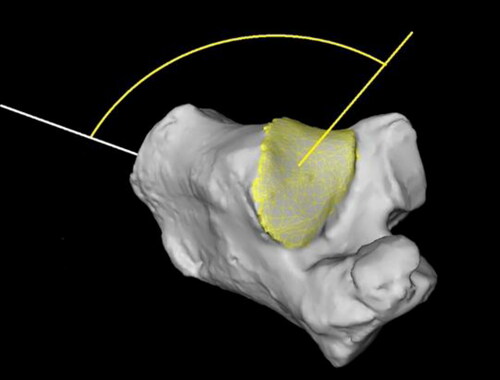
Reducing the calcaneal fracture restores the shape of this tarsal bone and the orientation of the PTC, and the form can be materialized by this main axis and the latter by the normal vector’s average angle.
Statistical analysis
Statistical analysis was performed by using the paired t-test, the Pearson correlation and the linear regression model.
The paired t-test and the Pearson correlation were used to identify differences between the OAC of injured and uninjured side, pre- and postoperative. The linear regression model was used to assess the correlation between AOFAS score and quality of reduction. The latter was calculated as the difference between the OAC value of the uninjured side minus the angle measured at the postoperative side: a low difference means a postoperative orientation angle close to the normal value, because of the symmetry of this angle.
Results
Shapiro-Wilk’s test (p > 0.05) and visual inspection of the histograms, normal Q-Q plots and box plots showed that the angles values were approximately normally distributed for preop, postop and uninjured sides.
Average values of the postoperative OAC and uninjured OAC were nearly equal (means of 102.7° and 103.0°), with similar values of standard deviation (6.0° and 5.6°): there was no statistically significant difference between the OAC after surgery, compared to the OAC of the uninjured foot (paired t-test, p = 0.76).
The preoperative OAC values (mean = 96°, standard deviation = 6.2°) were statistically significantly different from the postoperative and uninjured side OAC values (paired t-test, p < 0.001).
Correlation R2 between AOFAS outcome score at one year follow up and quality of the reduction was 0.63 (p < 0.001). When considering patients with high outcome scores (AOFAS > 90%, 25 patients), the correlation between the postoperative and uninjured OAC angles has a R2 = 0.82. For patients with low AOFAS <75%), the correlation was far lower (R2=0.26), with statistically significant differences between postoperative and uninjured side angles values (paired t-test, p < 0.001).
Discussion
DIACF are difficult to treat injuries, particularly because of the difficulty of assessing complex anatomy on classical medical imaging. Surgical treatment using open reduction is needed to achieve anatomical reduction, which is associated with the best outcome. Until now, the quality of this reduction is measured on X-ray using Böhler’s angle (BA), compared to the preoperative value and/or to the uninjured side value. The BA use remains controversial: many authors were unable to find any correlation between BA and AOFAS (Ebraheim, Hutchinson, Ibrahim, Kundel, Maufrey, Schepers, Su).
Qiang measured BA on 3 D CT reconstruction images and found good intra- and inter-observer agreement on healthy feet. He also found correlation between BA on 3 D images and AOFAS, with a Pearson r=-0.57 (R2=0.32). Su found a very low correlation between the BA and the AOFAS, (Spearman ρ = 0.22, p < 0.001).
This may be explained by the lack of clear anatomical landmark on 3 D CT reconstruction image of the calcaneus (Veltman et al. Citation2014): measuring a BA on 3 D CT imaging may be very unreliable in case of a comminuted fracture, even after osteosynthesis.
The BA was initially proposed for helping the diagnosis of calcaneal fractures on X-ray. It was not designed for 3 D reconstruction images and because of the unequivocal correlation between BA and the outcome on X-ray, Stephan proposed several 3 D specific measurements to assess the integrity of the calcaneal joints after osteosynthesis. He found a good symmetry of these measurements in healthy feet, making the uninjured side suitable as representing the tarsal bone before trauma. We chose one of them, the orientation angle of the calcaneal PTC facet, OAC. The OAC was chosen because of the importance of the PTC repair as the main goal of the surgery: a non-anatomical repair of this joint may lead to bad functional outcome.
The aim of this study was to test if one of the 3 D based measurements proposed by Stephan was useful in the assessment of the quality of the reduction of DIACF.
The PTC facet is an easy to identify anatomical structure on 3 D images. The orientation angle of this facet is based on the FPC-main axis of the calcaneus and on the general orientation of the PTC facet. Both may be affected in case of fracture. When fractured, the orientation of the PTC facet changes and the FPC axis is influenced by the upward displacement of the tuber. Like the BA, the value of the OAC angle in our study was lower than the uninjured side after trauma and showed a postoperative value closer to the uninjured side. Hence, the OAC seems to be more appropriate to assess the quality of the reduction; it materializes the reduction maneuvers when performing reduction of the fracture: restoring the bone length and giving the PTC the right anatomical orientation.
To measure the quality of the reduction we compared the difference between the uninjured foot OAC value and the operated one. When this difference was close to 0° or even negative, one may say that the postoperative value is close to the value before the trauma, because of the symmetry of 3 D reconstruction images.
To assess the clinical outcome of the patient we chose – like many authors - the AOFAS score, because of its good internal consistency (Cronbach α = 0.78 in a study of Schepers in 2008) and its validity (correlation with VAS which is a validated score) (Hildebrand). Kostuj also found a correlation between gait analysis and AOFAS score, and AOFAS score is also the most used PROM (patient related outcome measure) in the literature (Schepers et al. Citation2007).
We found a statistically significant correlation between the OAC and the AOFAS score (R2=0.62, adjusted R2=0.61, p < 0.0001): the better the reduction, with a postoperative OAC value closer to the normal one, the better the outcome.
Even if the OAC measurement is currently more time-consuming than measuring the BA, one may assume that this OAC measurement can become automated. With CT imaging during surgical procedure, it may confirm the good reduction. The OAC was also proposed by Stephan, as an alternative for the BA, to quantify the quality of the reduction after osteosynthesis: with a good, statistically significant correlation between the postoperative values and their uninjured counterpart (Pearson Citation1901, r = 0.63, p < 0.001), it seems to fulfil this role.
This study has several limitations: the limited number of patients, especially patients with Sanders 4 fracture, and their short follow-up. We also performed irradiation of the uninjured foot, even if the irradiation dose of extremities is considered very low, nearly negligible (about 0.2 mSv). We also limited our measurements to the posterior subtalar joint facet: other measurements may be also important in the outcome, such as length or width of the bone before and after surgery. The main issue with the latter measurements is how to define them, because of the complex anatomy of the calcaneus.
The OAC may be considered as a good measurement of the quality of the reduction after osteosynthesis of DIACF: patients with OAC value close to normal, or in other words, nearly equal to the uninjured side OAC value, having the best clinical outcome.
| Abbreviations | ||
| AOFAS | = | American Orthopaedics Foot Ankle Score |
| BA | = | Böhler’s Angle |
| FPC | = | First Principal Component |
| OAC | = | Orientation Angle of the Calcaneal PTC |
| PTC | = | Posterior Talo-Calcaneal joint facet |
| PROM | = | Patient Related Outcome Measure |
Disclosure statement
No potential conflict of interest was reported by the authors.
References
- Böhler L. 1931. Diagnosis, pathology and treatment of fractures of the os calcis. J Bone Joint Surg. 13:75–89.
- Buckley R, Tough S, McCormack R, Pate G, Leighton R, Petrie D, Galpin R. October 2002. Operative compared with non-operative treatment of displaced intra-articular calcaneal fractures: a prospective, randomized, controlled multicenter trial. J Bone Joint Surg Am. 84(10):1733–1744.
- Chen M, Bohrer S, Kelley T. February 1991. Boehler’s angle: a reappraisal. Ann Emergency Med. 20(2):122–124.
- Cotton FJ. 1916. Os calcis fracture. Ann Surg. 64(4):480–486.
- Cotton FJ. 1921. Old Os calcis fractures. Ann Surg. 74(3):294–303.
- Ebraheim NA, Elgafy H, Sabry FF, Freih M, Abou-Chakra IS. February 2020. Sinus tarsi approach with trans-articular fixation for displaced intra-articular fractures of the calcaneus. Foot Ankle Int. 21(2):105–113.
- Gutekunst D, Liu L, Ju T, Prior F, Sinacore D. 2013. Reliability of clinically relevant 3D foot bone angles from quantitative computed tomography. J Foot Ankle Res. 6(1):38. .
- Halai M, Hester T, Buckley R. 2020. Does 3D CT reconstruction help the surgeon to preoperatively assess calcaneal fractures. Foot (Edinb). 43:101659.
- Hauser ML, Kroeker RO. 1975. Boehler's angle: a review and study. J Am Podiatry Assoc. 65(6):517–521.
- Hutchinson F, 3rd, Huebner MK. 1994. Treatment of os calcis fractures by open reduction and internal fixation. Foot Ankle Int. 15(5):225–232.
- Ibrahim T, Rowsell M, Rennie W, Brown AR, Taylor GJS, Gregg PJ. 2007. Displaced intra-articular calcaneal fractures: 15-Year follow-up of a randomised controlled trial of conservative versus operative treatment. Injury. 38(7):848–855.
- Janzen DL, Connell DG, Munk PL, Buckley RE, Meek RN, Schechter MT. June 1992. Intraarticular fractures of the calcaneus: value of CT findings in determining prognosis. AJR Am J Roentgenol. 158(6):1271–1274.
- Kostuj T, Stief F, Hartmann KA, Schaper K, Arabmotlagh M, Baums MH, Meurer A, Krummenauer F, Lieske S. 2018. Using the Oxford Foot Model to determine the association between objective measures of foot function and results of the AOFAS Ankle-Hindfoot Scale and the Foot Function Index: a prospective gait analysis study in Germany. BMJ Open. 8(4):e019872.
- Kundel K, Funk E, Brutcher M, Bickel R. 1996. Calcaneal fractures: operative versus non-operative treatment. J Trauma. 41(5):839–845.
- Kurozumi T, Jinno Y, Sato T, Inoue H, Aitani T, Okuda K. 2003. Open reduction for intra-articular calcaneal fractures: evaluation using computed tomography. Foot Ankle Int. 24(12):942–948. . http://fai.sagepub.com/content/24/12/942
- Lee D, Yoo JH, Son DW, Kim DH. May 2019. Is the Boehler angle reliable for operative reduction of calcaneus fracture? J Orthop Sci. 24(3):521–525.
- Loucks C, Buckley R. November 1999. Bohler's angle: correlation with outcome in displaced intra-articular calcaneal fractures. J Orthop Trauma. 13(8):554–558.
- Magnan B, Samaila E, Regis D, Merlini M, Bartolozzi P. 2010. Association between CT imaging at follow-up and clinical outcomes in heel fractures. Musculoskelet Surg. 94(3):113–117.
- Mauffrey C, Klutts P, Seligson D. 2009. The use of circular fine wire frames for the treatment of displaced intra-articular calcaneal fractures. J Orthop Traumatol. 10(1):9–15.
- Montgomery SJ, Kooner SS, Ludwig TE, Schneider PS. March-April 2020. Impact of 3D printed calcaneal models on fracture understanding and confidence in orthopedic surgery residents. J Surg Educ. 77(2):472–478. . Epub 2020 Feb 6.PMID: 32033916
- Paley D, Hall H. March 1993. Intra-articular fractures of the calcaneus. A critical analysis of results and prognostic factors. J Bone Joint Surg Am. 75(3):342–354.
- Paul M, Peter R, Hoffmeyer P. November 2004. Fractures of the calcaneum. A review of 70 patients. J Bone Joint Surg Br. 86-B(8):1142–1145.
- Pearson K. 1901. On lines and planes of closet fit to systems of points in space. Philos Mag. 2(11):559–572.
- Pozo JL, Kirwan EO, Jackson AM. May 1984. The long-term results of conservative management of severely displaced fractures of the calcaneus. J Bone Joint Surg Br. 66(3):386–390.
- Schepers T, Ginai AZ, Mulder PGH, Patka P. September 2007. Radiographic evaluation of calcaneal fractures: to measure or not to measure. Skeletal Radiol. 36(9):847–852.
- Schepers T, Misselyn D. December 2018. 3D printing calcaneal fractures: continuously improving our care by making a complex problem tangible. J Invest Surg. 31(6):568–569.
- Stephan D, Panzer S, Göttlinger M, Augat P. November 2014. Analysis of the intra-individual differences of the joint surfaces of the calcaneus. Comput Methods Biomech Biomed Eng. 17(15):1635–1641.
- Su Y, Chen W, Zhang T, Wu X, Wu Z, Zhang Y. 2013. Bohler’s angle’s role in assessing the injury severity and functional outcome of internal fixation for displaced intra-articular calcaneal fractures: a retrospective study. BMC Surgery. 13(1):40. http://www.biomedcentral.com/1471-2482/13/40.
- Veltman ES, van den Bekerom MP, Doornberg JN, Verbeek DO, Rammelt S, Steller EP, Schepers T. July 2014. Three-dimensional computed tomography is not indicated for the classification and characterization of calcaneal fractures. Injury. 45(7):1117–1120. . Epub 2014 Jan 31