
 ?Mathematical formulae have been encoded as MathML and are displayed in this HTML version using MathJax in order to improve their display. Uncheck the box to turn MathJax off. This feature requires Javascript. Click on a formula to zoom.
Abstract
There are no studies on the optimal intrusion force in orthodontic patients with the existing root resorption (RR). The study aimed to analyze the optimal intrusion force for central incisors with existing horizontal root resorption using the finite element method (FEM). We calculated the optimal intrusion force using the finite element method and curve fitting. We found that with the increase of the maxillary central incisor’s root horizontal resorption length, the optimal intrusion force interval’s median gradually increases. If the resorption length is more significant than 1/2 of the root length, it is not recommended to use intrusion force theoretically.
Introduction
Root resorption (RR) is described as a permanent loss of tooth structure from the root apex. It is a progressive loss of dentine and cementum by the action of osteoclasts (Dindaroglu and Dogan Citation2017). The cause of resorption is not clear, but various theories have been suggested. It has been reported that genetic factors, age, and sex may affect the incidence of resorption. Factors such as root morphology, length, heredity, age, direction, magnitude, and duration of orthodontic force are responsible for RR (Casa et al. Citation2001; Lopatiene and Dumbravaite Citation2008; Artun et al. Citation2009; Seres et al. Citation2017).
Excessive orthodontic force placed on teeth during orthodontic treatment may result in RR and if the force increased, RR also increases, and the risk of RR will be significantly higher if it existed before orthodontic treatment (Lopatiene and Dumbravaite Citation2008), which was found in approximately 7–15% of pretreatment orthodontic patients (Tieu et al. Citation2014). Tooth intrusion is a procedure of high risks during orthodontic treatment; RR is recognized as one of the most severe complications of intrusion (Han et al. Citation2005). However, there are limited pieces of literature which are linked to the feasible strategies conformed to teeth with different RR lengths. Moreover, there is no literature on the optimal intrusion force in orthodontic patients with the existing RR. To allow more patients with root resorption problems to get better treatment, we designed and carried out this study to analyze the relationship between the optimal intrusion force and root horizontal resorption.
The optimal orthodontic force has been consistently focused for years. Currently, the concept of optimal orthodontic force lies in such a hypothesis: a force with certain size and time characteristics (continuous and intermittent, constant and inclined, and so on.) can produce the maximum tooth movement rate without damaging the tissue and making the patient feel the maximum comfort (Ren et al. Citation2003). Further, some scholars believe that the rationality of the orthodontic force mainly depends on two aspects: the amount of RR during tooth movement and the duration of orthodontic force (Wu et al. Citation2019), because in the orthodontic process, a small amount of RR is inevitable. Harris et al. reported that the higher the orthodontic force, the faster the resorption lacuna is produced (Harris et al. Citation2006), but if the orthodontic force is too small it cannot effectively stimulate alveolar bone remodeling and results in a reduction of tooth movement efficiency and the extension of treatment time (De Aguiar et al. Citation2017). Therefore, the ideal orthodontic force needs to meet the requirements of less RR and high efficiency in the process of orthodontic treatment.
Periodontal ligament (PDL) plays a vital role in guiding tooth movement (Dorow and Sander Citation2005; Li Citation2014; Liao et al. Citation2016) and is considered as the initiating factor of orthodontic tooth movements (Krishnan and Davidovitch Citation2009; Feller et al. Citation2015). The hydrostatic stress of the element in PDL could be used to predict the area where RR may occur (Field et al. Citation2009). This was confirmed by Wu et al. and Schwarz (Wu et al. Citation2019) who pointed out that the cell pressure caused by the optimal orthodontic loading in PDL should not be higher than the capillary pressure in tissue. The hydrostatic stress of PDL should be controlled under 12.8 kPa (80% of systolic pressure) (Hohmann et al. Citation2007; Liao et al. Citation2016). This value is considered as the upper bound of the effective stress of PDL under the most suitable compression force, and the lower bound of effective compressive stress of PDL should exceed 4.7 kPa to initiate tooth movement (Field et al. Citation2009; Chen et al. Citation2014; Wu et al. Citation2019).
Moreover, under orthodontic force, when the PDL logarithmic strain reached 0.3%, the tooth movement speed increased to the maximum speed of 0.0414 mm/d (Qian et al. Citation2008). Therefore, we consider the strain of 0.24% (80% of the peak strain at the maximum tooth movement speed) as the lower limit of PDL effective strain in order to obtain a relatively high tooth movement velocity and more accurately simulate the process of orthodontic treatment (Wu et al. Citation2019).
The aim of the present study was to analyze the optimal intrusion force for central incisors with existing horizontal root resorption using the finite element method (FEM).
Materials and methods
Cone Beam Computed Tomography (CBCT, NewTom 5 G, NewTom, Italy) data of a young patient were collected from the radiology department of the stomatology hospital. Ethical approval was obtained from the Ethics Committee of the Stomatological Hospital of Shandong University (No. 20200108). The subject consented to join in the study after receiving verbal and written explanations of all aspects of this study. The inclusion criteria were those patients with no history of trauma, decay, developmental abnormality, or significant attrition of the maxillary central incisor. The equipment of the visual field was 8 × 8 cm, and the slice thickness was 0.3 mm. The CBCT data was then imported into mimics 21.0 (Materialise, Leuven, Belgium) to implement a three-dimensional reconstruction of maxillary central incisors. The upper incisor was reconstructed with a root length of 12.99 mm and crown length of 11.44 mm; the crown/root ratio was 1:1.135, which fits the size and crown/root ratio of a healthy tooth (Choi et al. Citation2017). 3-matic 13.0 (Materialise, Leuven, Belgium) was used to segment the reconstructed incisor, which was divided into ten layers at an interval of 1 mm, starting from the apex. The segmentation plane was perpendicular to the long axis of the tooth. Eleven dental models with 0 − 10 mm horizontal root resorption were initially obtained via duplication and soothing process, then subsequently imported into Geomagic Wrap 2017 (3 D Systems, South Carolina, USA) and a feature removed, and surfaces refined, resulting in 11 entity models (.stp file) afterward. All entity models were imported into SolidWorks 2017 (Dassault Simulia, Massachusetts, USA), 0.2 mm periodontal ligament (Reimann et al. Citation2007), 2 mm cortical bone (Deguchi et al. Citation2006), and cancellous bone were built by operations like draft drawing, stretching, shell extraction, and boolean operation. Then all the parts of each group of central incisors were assembled to form 11 assembly models (.sldasm file) as shown in .
Figure 1. Flow chart of model generation and material assignment. CBCT data is used to generate a tooth model of root resorption through software. The tooth model is then assembled with cortical bone, cancellous bone, and periodontal ligament models, and meshed to generate experimental models. b Material properties of cortical bone, cancellous bone, and periodontal ligament.
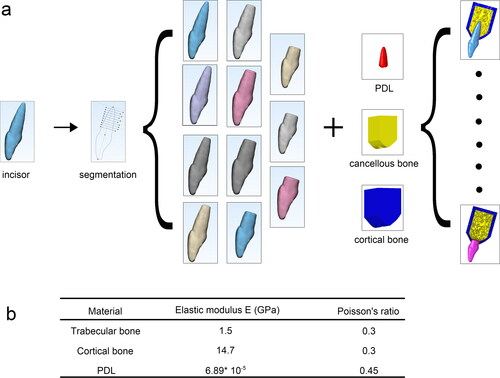
Assembly models were imported into Hypermesh 2017 (Alter Engineering, New York, USA) to complete triangle meshing. The mesh size of the periodontal ligament, cortical bone, and cancellous bone was 0.1, 0.5, and 0.5 mm, respectively. Then, the periodontal ligament mesh, cortical bone mesh, and cancellous bone mesh were generated by tetrahedral mesh to obtain the volume mesh model file (.inp file). The material properties were set in Abaqus 2019 (Dassault Simulia, Massachusetts, USA) according to the data in (Gonzalez Del Castillo McGrath et al. Citation2018). To simplify the calculation, the incisor was set as a rigid body since the hardness and stiffness of the tooth are far larger than the PDL. The present study assumed that all materials were linear elastic, homogeneous, and isotropic (Comparative verification test of PDL materials is shown in the Supplementary material). The bottom of the alveolar bone was fixed, then the long axis of the tooth was used as the direction force, and the force value was 0.1–1.5 N (10–150 g). The tooth was simulated for the orthodontic intrusion. The hydrostatic stress () and logarithmic strain (
) data of periodontal ligament were output in the calculation results.
and
are calculated as
where
is the hydrostatic stress within each element,
is the volume at the integral point of the corresponding element and
is the engineering strain.
The results were subsequently inputted into Origin 2019 (OriginLab, Massachusetts, USA) to analyze the data. Then the processed data were finally imported into SigmaPlot 14.0 (Systat Software, California, USA) and GraphPad Prism8 charts for drawing (GraphPad Software, California, USA).
The periodontal ligament stress and strain data were imported into Origin 2019 (OriginLab, Massachusetts, USA) for graph drawing, curve fitting, and intersection calculation in order to obtain the most suitable upper and lower bounds of the intrusion force. For charting, the calculated data were imported into GraphPad Prism8 and SigmaPlot 14.0.
Descriptive statistics were used to describe the stress and strain curve characteristics, and the optimal intrusion force interval, median and extreme stress area percentage change with root resorption length. These percentages were divided into 2 groups according to the root resorption length, one group represents the root resorption length less than 6 mm (0–6 mm), and the other denotes the root resorption length above 6 mm (7–10 mm), The student t-test for statistical analysis in GraphPad were used at p-value <0.05.
We use multiple linear regression to analyze whether there is a linear relationship between root absorption length and the optimal intrusion force interval, root absorption length and the optimal intrusion force median, root absorption length and the area percentage of the extreme stress zone. And the result of multiple linear regression can be used to analyze whether the optimal intrusion force interval, median and extreme stress area percentage has increased significantly when the root resorption length above 6 mm. The analysis software we use is IBM SPSS Statistics 26 (IBM, New York, USA). These three multiple linear regression analysis processes are very similar. Take the optimal intrusion force interval as an example. We use the optimal intrusion force interval as the dependent variable (y) and the root resorption length as the independent variable (x). At the same time, we introduce a new independent variable (a) and the interaction term between a and x (a*x). The value of a is 0 when the root resorption length is 0–6 mm, and the value is 1 when the root resorption length is 7–10 mm.
According to the definition and content of multiple linear regression, when the interaction term between a and x’s coefficient is significantly different (p < 0.05), it can be explained the optimal intrusion force interval has increased significantly when the root resorption length above 6 mm (Detailed mathematical relationships are shown in the Supplementary material).
Results
Results of the stress and strain program
According to the comparison program, the proportion of effective stress area increases and then decreases as the increase of intrusion force, the proportion of extreme stress area gradually increases with the root tip as the center. In contrast, the proportion of the low-stress area decreased gradually. shows the stress distribution of PDL when the incisor was intruded on the optimal intrusion force. Also, the proportion of effective strain area increases as the intrusion force increases, and the proportion of the low strain area decreased gradually as shown in .
Figure 2. The stress distribution cloud diagram of the periodontal ligament of the maxillary central incisor with different root resorption lengths under the optimal intrusion force. The red area indicates that the stress is 4.7–12.8 kpa, which is the effective stress area, the gray area indicates that the stress is greater than 12.8 kpa, which is the ultimate stress area, and the other colors are low-stress areas. (In view of the size of the figure and other reasons, this diagram does not include all the stress distribution cloud of the periodontal ligament in this study. All the stress distribution cloud of the periodontal ligament can be found in Appendix )
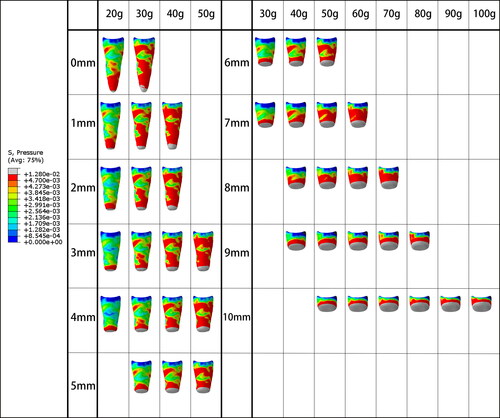
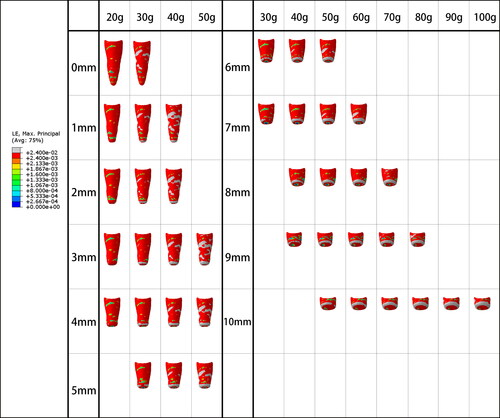
Figure 3. The strain distribution cloud diagram of the periodontal ligament of the maxillary central incisor with different root resorption lengths under the optimal intrusion force. The red and gray areas indicate that the strain is greater than 0.24%, which is the effective strain zone, and the other colors are the low strain zone. (Because of the size of the figure and the design and other reasons, this diagram does not include all the strain distribution cloud of the periodontal ligament in this study. All the strain distribution cloud of the periodontal ligament can be found in Appendix )
Results of the stress area and strain area curve diagram
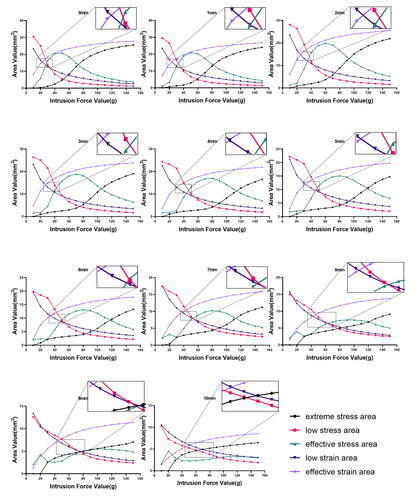
As intrusion forces increased, the proportion of low-stress area decreased, the proportion of effective stress area increased and then decreased, and the proportion of extreme stress are increased gradually. Furthermore, the proportion of effective strain areas increased gradually, and that of low strain area decreased gradually. shows the stress and strain area curves of all models under different intrusion forces. Each curve diagram consisted of 5 curves; the changing trend of them was different from the increase of intrusion force. The intersection of low strain area curve and effective strain area curve is considered as the lower bound of the optimal intrusion force, and the intersection of low-stress area curve and effective stress area curve is the upper bound of the optimal intrusion force (Detailed mathematical relationships are shown in the Discussion and Supplementary material).
Figure 4. Curves of stress and strain areas of maxillary central incisors with different root resorption lengths under the action of intrusion force. The abscissa of the graph is the intrusion force value, and the ordinate is the area value. Each graph is composed of 5 curves. The magnified area is the intersection area of the curve where the upper and lower bounds of the optimal intrusion force are obtained.
Fitting curve and data analysis, the upper and lower bounds of the optimal intrusion force, as well as the figure of the root resorption length and optimal intrusion force range are demonstrated in .
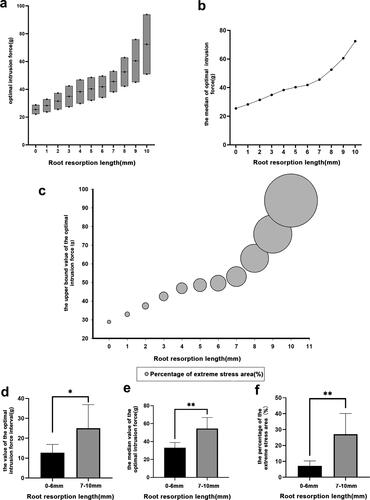
Figure 5. Diagram of the optimal intrusion force of the maxillary central incisor with different root resorption lengths. (a) Floating column chart of the optimal intrusion force for maxillary central incisors with different root resorption lengths. The upper and lower sides of the column represent the upper and lower bounds of the optimal intrusion force, and the length of the column represents the size of the optimal intrusion force interval. The middle of each column the point represents the median of the optimal intrusion force interval. (b) Curves of the median of optimal intrusion force of maxillary central incisors with different root resorption lengths. (c) When the maxillary central incisor with different root resorption length is subjected to an intrusion force that is the upper bound of the optimal intrusion force, the area bubble diagram of the extreme stress zone. The size of the bubble represents the percentage of the area of the extreme stress zone to the area of the periodontal ligament. The abscissa of the bubble center is the root resorption length, and the ordinate is the upper bound of the optimal intrusion force. (d) Comparison of the optimal intrusion force interval between the root resorption length of 0–6 mm and the root resorption length of 7 mm or more, the ordinate is the value of the optimal intrusion force interval (p < 0.05). (e) Comparing the median value of the optimal intrusion force between the root resorption length of 0–6 mm and the root resorption length of 7 mm or more, the ordinate is the median of the optimal intrusion force (p < 0.05). (f) Comparison of the percentage of the extreme stress area between the root resorption length of 0–6 mm and the root resorption length of 7 mm or more. The ordinate is when the intrusion force is equal to the upper bound of the optimal intrusion force, the area of the extreme stress area accounts for the percentage of the periodontal ligament area (p < 0.05).
Results of the optimal intrusion force diagram
When the root resorption length is less than 1/2 of the root length (6 mm), the height of the floating column in the optimal intrusion force range will decrease, the median curve of the optimal intrusion force will be smoother, and the area percentage of the extreme stress will have a smaller bubble increase; while if the resorption length is more than 1/2 of the root length, the height of the floating column increases significantly, the median curve becomes steeper, and the bubble area increases greatly. show the floating bar graph of the upper and lower ranges of the optimal intrusion force, the median curve of the optimal intrusion force range, and the area percentage of the extreme stress of the periodontal ligament when the intrusion force is equal to the upper bound of the optimal intrusion force Bubble chart. The three graphs show a gradual increase with the increase of root resorption length.
For statistical analysis using student t-test, the optimal intrusion force interval was divided into 2 groups according to the root resorption length (one group is the root resorption length less than 1/2 of the root length (0–6 mm) and the other group the resorption length of the tooth root is greater than 1/2 of the root length (7–10 mm), statistically significant difference between the two groups was found using Student t-test (p < 0.05). shows the optimal intrusion force median and the area percentage of the extreme stress zone of the two groups of data, respectively.
Results of multiple linear regression
To compare whether the optimal intrusion force interval, median, and extreme stress area percentage had increased significantly when the root resorption length above 6 mm, we used multiple linear regression to analyze the significant statistical differences in the x′ coefficients and interaction terms’ coefficients. There is a linear relationship between root absorption length and the optimal intrusion force interval, root absorption length and the optimal intrusion force median, root absorption length and extreme stress area percentage. And it can be seen from the results of the three groups of multiple linear regression models that the coefficients of the interaction terms are all significantly different (p < 0.05) ( and Appendix ).
Table 1. Statistical Analysis of the Coefficients of Multiple Linear Regression Model
Discussion
In previous finite element studies, many researchers (Minch et al. Citation2017; Jain et al. Citation2021) observed the maximum value of the PDL stress to analyze and judge whether the force applied on teeth would cause root resorption to evaluate the rationality of the orthodontic force. But using the stress values of several specific positions could not properly assess the whole root’s force state. Meanwhile, the high stress of these specific positions could cause root resorption, but this did not mean that the force applied on teeth was not suitable. In addition, other researchers (Hemanth et al. Citation2015) used the average value of PDL stress to analyze the force applied on teeth. This method could not accurately illustrate the specific stress distribution of the tooth root surface. Although these methods were simple and easy to implement, they could not be used to analyze the optimal intrusion force of orthodontic teeth.
As we designed our methods to obtain the interval of the optimal intrusion force of the upper central incisor, we referred to several related studies. Wu et al. (Citation2019) revealed the relevance between stress and strain distribution on PDL. Also, Qian et al. (Citation2008) showed a direct relationship between PDL strain and the pace of tooth movement. Based on these factors, the present study used the method of calculating and comparing the area of each stress and strain zone to analyze and determine. Compared with the previous studies, this method could be more reasonable. The results of our studies reflected not only the root’s force state in general but also the extreme stress and strain distribution on the PDL.
The optimal intrusion force was defined by Wu et al. (Citation2019) as the effective orthodontic force that covers as many PDL areas as possible with effective stress and effective strain areas, while minimizing the extreme stress area. Data of the present study revealed that PDL stress and strain area of incisors with different resorption lengths changed with the intrusion force. In curve diagrams, the upper and lower bounds of the optimal intrusion force as the intrusion force increased, the proportion of low strain area decreased gradually, and that the effective strain area increased. The intersection of these two curves was considered as the lower bound of the optimal intrusion force as appeared in (0 mm). And according to the range of effective strain when obtaining the optimal orthodontic force in the relevant literature (Li Citation2014; Wu et al. Citation2018, Citation2019), we believe that the intersection of the two curves (i.e. the effective strain reaches 50%) can be used as the lower bound of the optimal intrusion force as appeared in (0 mm).
The proportion of low-stress areas also decreased, while an increase was observed in the effective and extreme stress areas. When the two curves of the low-stress area and effective stress area interact, the slope of the extreme stress area increased gradually, which showed that the proportion of extreme stress area increased rapidly with the intrusion force. These results are inconsistent with the definition of ‘the extreme stress region should be as small as possible’; therefore, intersection curves of the low-stress area and effective stress area as the upper bound of optimal intrusion force were used (Detailed mathematical relationships are shown in the Supplementary material).
The method of analyzing the optimal orthodontic force with stress and strain area was available only in recent years, and few studies can be found (Wu et al. Citation2019). Data of the present study showed that when no root resorption existed, the optimal intrusion force of the maxillary central incisor is 25.4 g, which is consistent with the 25 g in another similar animal and human studies (Steigman and Michaeli Citation1981; McFadden et al. Citation1989). Statistical analysis of the results of finite element analysis is rare in conventional research, but there are still many finite element analysis articles (Verri et al. Citation2014; Ramos Verri et al. Citation2015; de Souza Batista et al. Citation2017) use statistical analysis methods to obtain good conclusions. In this research, we learn from and further extend the use of Statistical analysis methods of t-test and multiple linear regression.
The optimal median intrusion force curve and floating bar graph of optimal intrusion force intervals are eventually obtained. Theoretically, the corresponding optimal intrusion force can be directly calculated by the magnitude of root resorption. However, combined with clinical data, this was not precise, as the curvature of the first half of the curve appeared soft, and the second half becomes obviously steep. It can be seen from the results of multiple linear regression analysis, that the optimal intrusion force interval and the optimal median intrusion force were significantly increased when the root resorption length above 6 mm. The t-test results also showed that there are significant statistical differences between the two curves and this can be observed on the curve as there is an obvious change of the optimal intrusion force when there is an increase of root resorption length. In other words, to achieve the optimal intrusion force, a force that is slightly larger than the upper bound of optimal intrusion force when the root is not resorbed is needed (less than 30%) when the resorption length was less than 1/2 root length. On the other hand, the force should be remarkably increased (50–227%) if the resorption length was more than 1/2 root length. If large orthodontic force is applied even within the optimal orthodontic force range, the patient suffers from pain (Theodorou et al. Citation2019) and when root resorption exceeds 1/2 root length, intrusion might lead to treatment failure because of patient discomfort.
It can be seen from the extreme stress area bubble chart that, when the intrusion force is equal to the upper bound of the optimal intrusion force, the changing trend of the PDL’s extreme stress area percentage is the same as the changing trend of the median of the optimal intrusion force. It can be seen from the results of multiple linear regression analysis, that the extreme stress area percentage was significantly increased compared to the first half of the figure with root resorption about 1/2 as the dividing line. The t-test results also showed that there are significant statistical differences between the two halves of the figure. The greater the percentage of extreme stress area, the higher the risk of root resorption. Therefore, when the root resorption exceeds 1/2 of the root length, a larger force is needed to perform the tooth pressing operation. Even within the optimal orthodontic force range, the risk of root resorption will increase significantly, and this is not recommended in clinical situations.
Biomechanically, linear elastic properties described PDL and assume that it was isotropic. Substantial relevant studies proved it to be feasible and accurate (Gonzalez Del Castillo McGrath et al. Citation2018; Feng et al. Citation2019). However, the material properties of PDL were practically nonlinear and anisotropic (Toms and Eberhardt Citation2003; Cattaneo et al. Citation2005). The existing research showed that the results obtained by using PDL nonlinear materials were closer to clinical studies than those obtained by PDL linear elastic materials (Roscoe et al. Citation2021). However, in our study, the linear elastic model results were closer to the animal and human studies, which might be related to the complexity of this study and the multi-parameters of the nonlinear material model. At present, building up a better PDL nonlinear model which can help us obtain an accurate optimal intrusion force is still a research hotspot.
There were two main contributions of the present research. First, based on previous studies, we improved the method of analyzing the optimal intrusion force. Second, we applied the new method to analyze and obtain the optimal intrusion force of the maxillary central incisor with different levels of horizontal root resorption. We got a preliminary relationship between the levels of root resorption and the optimal intrusion force. As with any finite element simulation approach, our study had several limitations. First, when we determined the upper and lower bounds of the optimal intrusion force, although we referred to enough articles and discussed and analyzed the data in as much detail as possible, the effective strain area percentage and the extreme stress area percentage were still needed to be confirmed by the animal and clinical studies, which our team would further explore. Second, our study verified the optimal intrusion force when the root was under no resorption, consistent with the previous studies. However, under the condition of different levels of root resorption, we only theoretically analyzed the optimal intrusion force without the in vivo and clinical results. Third, in this experiment, considering the complexity of the model, the number of teeth in the model and the way of adding force were simplified. Based on these limitations of the present research, our conclusions cannot be directly used in the clinic now. Therefore, further experiments and more accurate simulations should be carried out to investigate a more precise range of optimal intrusion forces.
Conclusion
The changes of PDL stress and strain distribution area in teeth with different horizontal lengths are similar.
Taking the intersection of the low strain area curve and effective strain area curve as the lower bound of the optimal intrusion force, and the intersection of the low-stress area curve and effective stress area curve is the upper bound, relatively accurate interval of optimal intrusion force can be obtained accordingly.
The median of optimal intrusion force and the horizontal resorption length have a linear relationship. The median of optimal intrusion force gradually increases with increasing the horizontal resorption length of the maxillary central incisor.
When the horizontal resorption length of the maxillary central incisor is less than 1/2 root length, theoretically, it is possible to use invasion force to try to invade, but if it exceeds 1/2 root length, the intrusion is not recommended.
Supplemental Material
Download MS Word (27.2 KB)Disclosure statement
No potential conflict of interest was reported by the authors.
Funding
The author(s) reported there is no funding associated with the work featured in this article.
References
- Artun J, Van 't Hullenaar R, Doppel D, Kuijpers-Jagtman AM. 2009. Identification of orthodontic patients at risk of severe apical root resorption. Am J Orthod Dentofac Orthop. 135(4):448–455.
- Casa MA, Faltin RM, Faltin K, Sander FG, Arana-Chavez VE. 2001. Root resorptions in upper first premolars after application of continuous torque moment. Intra-individual study. J Orofac Orthop. 62(4):285–295.
- Cattaneo PM, Dalstra M, Melsen B. 2005. The finite element method: a tool to study orthodontic tooth movement. J Dent Res. 84(5):428–433.
- Chen J, Li W, Swain MV, Ali Darendeliler M, Li Q. 2014. A periodontal ligament driven remodeling algorithm for orthodontic tooth movement. J Biomech. 47(7):1689–1695.
- Choi SH, Kim JS, Kim CS, Yu HS, Hwang CJ. 2017. Cone-beam computed tomography for the assessment of root-crown ratios of the maxillary and mandibular incisors in a Korean population. Korean J Orthod. 47(1):39–49.
- De Aguiar MC, Perinetti G, Capelli J., Jr. 2017. The gingival crevicular fluid as a source of biomarkers to enhance efficiency of orthodontic and functional treatment of growing patients. Biomed Res Int. 2017:3257235.
- de Souza Batista VE, Verri FR, Almeida DAF, Santiago Junior JF, Lemos CAA, Pellizzer EP. 2017. Evaluation of the effect of an offset implant configuration in the posterior maxilla with external hexagon implant platform: a 3-dimensional finite element analysis. J Prosthet Dent. 118(3):363–371.
- Deguchi T, Nasu M, Murakami K, Yabuuchi T, Kamioka H, Takano-Yamamoto T. 2006. Quantitative evaluation of cortical bone thickness with computed tomographic scanning for orthodontic implants. Am J Orthod Dentofac Orthop. 129(6):721.e7–721.e12.
- Dindaroglu F, Dogan S. 2017. Root Resorption in Orthodontics. Turk J Orthod. 29(4):103–108.
- Dorow C, Sander FG. 2005. Development of a model for the simulation of orthodontic load on lower first premolars using the finite element method. J Orofac Orthop. 66(3):208–218.
- Feller L, Khammissa R, Schechter I, Thomadakis G, Fourie J, Lemmer J. 2015. Biological events in periodontal ligament and alveolar bone associated with application of orthodontic forces. Sci World J. 2015:1–7.
- Feng Y, Kong WD, Cen WJ, Zhou XZ, Zhang W, Li QT, Guo HY, Yu JW. 2019. Finite element analysis of the effect of power arm locations on tooth movement in extraction space closure with miniscrew anchorage in customized lingual orthodontic treatment. Am J Orthod Dentofac Orthop. 156(2):210–219.
- Field C, Ichim I, Swain MV, Chan E, Darendeliler MA, Li W, Li Q. 2009. Mechanical responses to orthodontic loading: a 3-dimensional finite element multi-tooth model. Am J Orthod Dentofac Orthop. 135(2):174–181.
- Gonzalez Del Castillo McGrath M, Araujo-Monsalvo VM, Murayama N, Martinez-Cruz M, Justus-Doczi R, Dominguez-Hernandez VM, Ondarza-Rovira R. 2018. Mandibular anterior intrusion using miniscrews for skeletal anchorage: A 3-dimensional finite element analysis. Am J Orthod Dentofac Orthop. 154(4):469–476.
- Han G, Huang S, Von den Hoff JW, Zeng X, Kuijpers-Jagtman AM. 2005. Root resorption after orthodontic intrusion and extrusion: an intraindividual study. Angle Orthod. 75(6):912–918
- Harris DA, Jones AS, Darendeliler MA. 2006. Physical properties of root cementum: part 8. Volumetric analysis of root resorption craters after application of controlled intrusive light and heavy orthodontic forces: a microcomputed tomography scan study. Am J Orthod Dentofac Orthop. 130(5):639–647.
- Hemanth M, Raghuveer H, Rani M, Hegde C, Kabbur KJ, Vedavathi B, Chaithra D. 2015. An Analysis of the Stress Induced in the Periodontal Ligament during Extrusion and Rotation Movements: A Finite Element Method Linear Study Part I. J Contemp Dent Pract. 16(9):740–743.
- Hohmann A, Wolfram U, Geiger M, Boryor A, Sander C, Faltin R, Faltin K, Sander FG. 2007. Periodontal ligament hydrostatic pressure with areas of root resorption after application of a continuous torque moment. Angle Orthod. 77(4):653–659.
- Jain A, Prasantha G, Mathew S, Sabrish S. 2021. Analysis of stress in periodontium associated with orthodontic tooth movement: a three dimensional finite element analysis. Comput Methods Biomech Biomed Eng. 24(16):1841–1853.
- Krishnan V, Davidovitch Z. 2009. On a path to unfolding the biological mechanisms of orthodontic tooth movement. J Dent Res. 88(7):597–608.
- Li Z. 2014. Oral orthodontic force simulation and tooth movement modulation research [MS thesis]. Harbin, China: Harbin Institute of Technology (in Chinese).
- Liao Z, Chen J, Li W, Darendeliler MA, Swain M, Li Q. 2016. Biomechanical investigation into the role of the periodontal ligament in optimising orthodontic force: a finite element case study. Arch Oral Biol. 66:98–107.
- Lopatiene K, Dumbravaite A. 2008. Risk factors of root resorption after orthodontic treatment. Stomatologija. 10(3):89–95.
- McFadden WM, Engstrom C, Engstrom H, Anholm JM. 1989. A study of the relationship between incisor intrusion and root shortening. Am J Orthod Dentofac Orthop. 96(5):390–396.
- Minch LE, Sarul M, Nowak R, Kawala B, Antoszewska-Smith J. 2017. Orthodontic intrusion of periodontally-compromised maxillary incisors: 3-dimensional finite element method analysis. Adv Clin Exp Med. 26(5):829–833.
- Qian Y, Fan Y, Liu Z, Zhang M. 2008. Numerical simulation of tooth movement in a therapy period. Clin Biomech (Bristol, Avon). 23 (Suppl 1):S48–S52.
- Ramos Verri F, Santiago Junior JF, de Faria Almeida DA, de Oliveira GB, de Souza Batista VE, Marques Honório H, Noritomi PY, Pellizzer EP. 2015. Biomechanical influence of crown-to-implant ratio on stress distribution over internal hexagon short implant: 3-D finite element analysis with statistical test. J Biomech. 48(1):138–145.
- Reimann S, Keilig L, Jager A, Bourauel C. 2007. Biomechanical finite-element investigation of the position of the centre of resistance of the upper incisors. Eur J Orthod. 29(3):219–224.
- Ren Y, Maltha JC, Kuijpers-Jagtman AM. 2003. Optimum force magnitude for orthodontic tooth movement: a systematic literature review. Angle Orthod. 73(1):86–92.
- Roscoe MG, Cattaneo PM, Dalstra M, Ugarte OM, Meira JB. 2021. Orthodontically induced root resorption: A critical analysis of finite element studies' input and output. Am J Orthod Dentofac Orthop. 159(6):779–789.
- Seres L, Vetro E, Perenyi J, Kocsis A. 2017. Severe root resorption of the upper central incisors as a consequence of playing the flute. Dent Traumatol. 33(5):406–409.
- Steigman S, Michaeli Y. 1981. Experimental intrusion of rat incisors with continuous loads of varying magnitude. Am J Orthod. 80(4):429–436.
- Theodorou CI, Kuijpers-Jagtman AM, Bronkhorst EM, Wagener F. 2019. Optimal force magnitude for bodily orthodontic tooth movement with fixed appliances: A systematic review. Am J Orthod Dentofac Orthop. 156(5):582–592.
- Tieu LD, Saltaji H, Normando D, Flores-Mir C. 2014. Radiologically determined orthodontically induced external apical root resorption in incisors after non-surgical orthodontic treatment of class II division 1 malocclusion: a systematic review. Prog Orthod. 15(1):48.
- Toms SR, Eberhardt AW. 2003. A nonlinear finite element analysis of the periodontal ligament under orthodontic tooth loading. Am J Orthod Dentofac Orthop. 123(6):657–665.
- Verri FR, Batista VE, Santiago JF, Jr., Almeida DA, Pellizzer EP. 2014. Effect of crown-to-implant ratio on peri-implant stress: a finite element analysis. Mater Sci Eng C Mater Biol Appl. 45:234–240.
- Wu JL, Liu YF, Peng W, Dong HY, Zhang JX. 2018. A biomechanical case study on the optimal orthodontic force on the maxillary canine tooth based on finite element analysis. J Zhejiang Univ Sci B. 19(7):535–546.
- Wu J, Liu Y, Wang D, Zhang J, Dong X, Jiang X, Xu X. 2019. Investigation of effective intrusion and extrusion force for maxillary canine using finite element analysis. Comput Methods Biomech Biomed Eng. 22(16):1294–1302.
Appendix A
See Figures A1–A5 and Tables A1 and A2
Figure A1. The strain distribution cloud diagram of the periodontal ligament of the maxillary central incisor with different root resorption lengths under the intrusion force. The red and gray areas indicate that the strain is greater than 0.24%, which is the effective strain zone, and the other colors are the low strain zone.
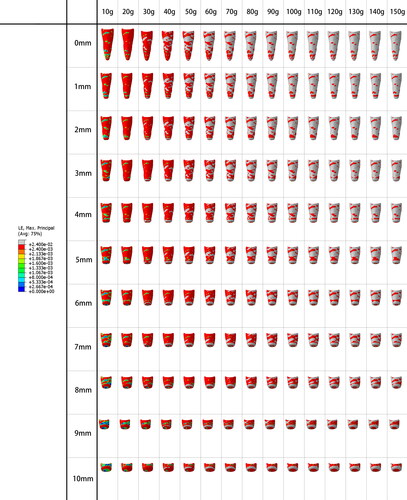
Figure A2. The stress distribution cloud diagram of the periodontal ligament of the maxillary central incisor with different root resorption lengths under the intrusion force. The red area indicates that the stress is 4.7–12.8 kpa, which is the effective stress area, the gray area indicates that the stress is greater than 12.8 kpa, which is the ultimate stress area, and the other colors are low-stress areas.
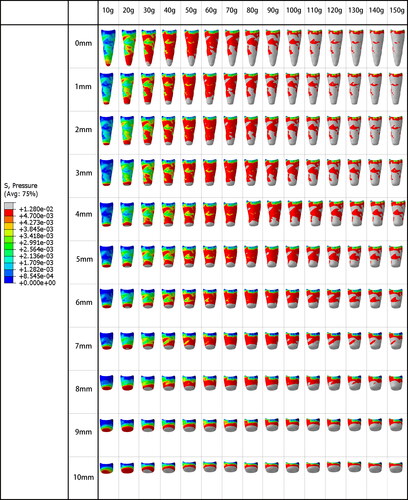
Figure A3. These three scatter plots, respectively, represent the value of the optimal intrusion force interval, the optimal intrusion force median, and the area percentage of the limit stress zone under different root resorption lengths.
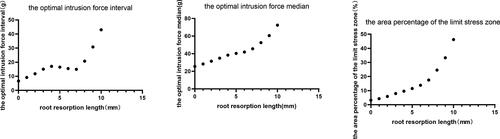
Figure A4. Residual analysis in three-term multiple linear regression analysis. The residual analysis was made to test whether these models are acceptable and valid. (A),(C),(E) show normal P-P plot of regression standardized residual. (B),(D),(F) represent scatter plots of regression studentized deleted (Press) residual under the regression standardized predicted value.
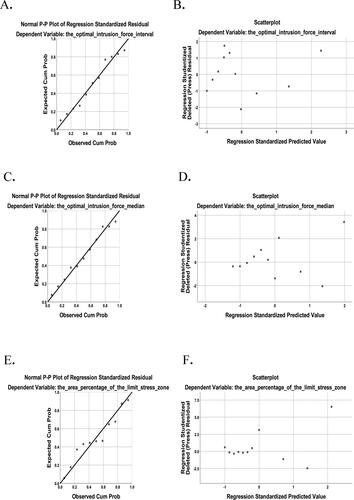
Figure A5. The stress and strain curves graphs of root absorption at 0 mm. 1 indicates the intersection of the effective strain area and the low strain area curves. 2 indicates the intersection of the low stress area and effective stress area curves.
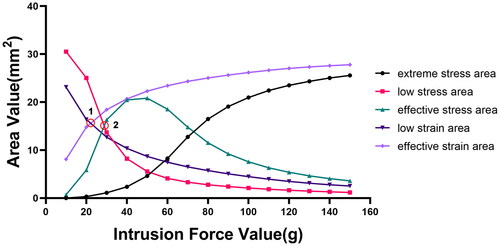
Table A1. Model summary.
ANOVA
Table A2. The value of for different root absorption lengths.