
 ?Mathematical formulae have been encoded as MathML and are displayed in this HTML version using MathJax in order to improve their display. Uncheck the box to turn MathJax off. This feature requires Javascript. Click on a formula to zoom.
Abstract
The prevalence of tinnitus is high and seriously affects the daily life of patients. As the pathogenesis of tinnitus is not yet clear, there is a lack of rapid and objective diagnostic modalities. In order to provide clinicians with an objective diagnostic approach, this paper combines time-frequency domain and non-linear power analysis to investigate the differences in the specificity of the EEG signal in tinnitus patients compared to healthy subjects. In this paper, resting-state electroencephalograms (EEG) were collected from 10 cases each of tinnitus patients and healthy subjects, and the data from the two groups were compared in the δ (0.5 − 3 .5 Hz), θ (4 − 7.5 Hz), α1 (8 − 10 Hz), α2 (10 − 12 Hz), β1 (13 − 18 Hz), β2 (18.5 − 21 Hz), β3 (21.5 − 30 Hz), and γ (30.5 − 44 Hz) bands for the differences in sample entropy values. The results of the resting state experiment revealed that the δ, α2 and β1 band samples of tinnitus patients all had greater entropy values than healthy subjects, with extremely significant differences compared to healthy subjects (p < 0.01). It is mainly concentrated in the δ band in the right parietal region of the cerebral cortex, the α2 band in the central region, and the γ band in the left prefrontal region. Finally, support vector machines combined with optimal feature combinations were used to achieve objective recognition of tinnitus disorders, with an 8.58% increase in accuracy compared to other features. Through the above study, entropy reflects the degree of chaos in the brain and the chaotic characteristics of the resting state EEG signal can characterise the onset of tinnitus, the results of which can help clinicians in the early diagnosis of tinnitus.
Keywords:
1. Introduction
Subjective tinnitus is a disease with a high prevalence and low cure rate, and its treatment is a worldwide challenge (Langguth et al. Citation2013). The prevalence of tinnitus increases with age (Nondahl et al. Citation2012), 12% to 30% of people experience tinnitus, 10-15% of people struggle with tinnitus for a long time (Silvano et al. Citation2015). 2% of them had their quality of life compromised, Severe cases may be associated with distress, worry, anxiety, depression, cognitive dysfunction, insomnia, stress and emotional exhaustion (Axelsson and Ringdahl Citation1989). The main clinical treatments for tinnitus are psychological counselling, behavioural cognitive therapy, dietary supplements, medication, masking therapy and habituation therapy, surgery and hearing aids (Shuo-Ying and Tian-Hong Citation2019). To date, no medical, neurological or neuropsychological therapy has been proven to be a universal cure for tinnitus (Roberts et al. Citation2012). This lack of standard methods of treatment can be considered as clear evidence of, demonstrates that subjective tinnitus is an unusually dynamic and complex phenomenon, diagnosis and treatment is a challenge. At this stage there is no objective and rapid way to diagnose, even no universal medicine or treatment.
In a study in which the authors used magnetic resonance imaging to correlate neuroanatomical features of tinnitus patients with tinnitus-related pain, a negative correlation between skin volume and pain in bilateral auditory areas could be observed (Schecklmann et al. Citation2013). Wei Xue et al. concluded from functional magnetic resonance imaging that functional alterations in the auditory cortex of tinnitus patients at rest differ from those in subcortical structures, that there is a functionally dominant pathway in the auditory network, and that the effect of bilateral tinnitus on the relevant brain regions of patients may be different from that of unilateral tinnitus (Wei et al. Citation2015). However, many tinnitus patients are reluctant to participate in MRI studies due to the constant emission of harmful scanner noise and other discomfort factors in the scanning environment, so MRI cannot be considered an appropriate technique for exploring the functional characteristics of tinnitus. Electroencephalogram (EEG) is a non-invasive imaging modality that uses electrophysiological indicators to record brain activity along the scalp generated by ionic currents in the brain's neurons (Cohen Citation2017). Spectral power and connectivity analysis of resting state EEG has proven to be a beneficial tool in the analysis of tinnitus. The main advantage of EEG is the ability to directly observe the timing and frequency of nerve activity in human tinnitus patients, helping to understand the neurological abnormalities of tinnitus. Moazami-Goudarzi M et al. demonstrated that EEG parameters obtained from patients with tinnitus often differed from the EEG patterns of people without tinnitus symptoms (Moazami-Goudarzi et al. Citation2010). Significant differences in the temporal characteristics and syntax of EEG microstate classification between tinnitus patients and healthy individuals in the resting state (Cai et al. Citation2018). Several studies have shown that EEG studies in tinnitus patients differ significantly in different frequency bands, such as δ, α, β and γ rhythms (Houdayer et al. Citation2015). However, while spontaneous activity is often the target of research in animal models of tinnitus, there have been few studies in humans, and some studies have looked at resting oscillatory EEG and magnetoencephalography in tinnitus patients versus healthy controls (Llinás et al. Citation1999; Shulman and Goldstein Citation2002; Weisz et al. Citation2005; Ashton et al. Citation2007; Weisz et al. Citation2007). In the resting EEG of healthy controls, there was a significant increase in Z-Score power in the frequency range of 0.5 to 22 Hz (Shulman et al. Citation2006), this power dominates in the frontotemporal electrodes. Another EEG study described an increase and decrease in mean total power in female and male patients with tinnitus compared to healthy controls (Weiler et al. Citation2000). A further study of spontaneous brain activity reported temporal and frontal lobe temporal changes (increases and decreases) in the relative power of patients with severe tinnitus (Shulman and Goldstein Citation2002). A magnetoencephalography study found an increase and decrease in δ and α power, respectively, in tinnitus patients compared to healthy controls (Weisz et al. Citation2005). Some studies have even highlighted the relevance of gamma band activity to the pathophysiology of tinnitus, Cai Yuxin et al. pointed out that tinnitus patients had significantly higher full-band spectral energy, including the δ, θ, α1 and γ bands, that tinnitus patients had a higher degree of central activation in the bilateral temporal lobe region and the joint temporoparietal region, and that tinnitus loudness was positively correlated with the power spectrum of the right anterolateral and anteromedial frequency bands, suggesting that tinnitus patients showed changes in the reorganization of the central system and that the γ wave might serve as a central indicator reflecting the subjective evaluation of tinnitus (Yexin et al. Citation2018). Schlee et al. concluded that the α and β bands in the left inferior parietal lobule of tinnitus patients were lower in energy when the eyes were open. When the eyes are closed, tinnitus patients have reduced α band energy in the left inferior temporal gyrus and postcentral gyrus and reduced γ energy in the left middle temporal gyrus (Schlee et al. Citation2014). Zobay et al. concluded that there was no difference in EEG spectral energy between people with tinnitus and the normal population (Zobay et al. Citation2015). The results of the above studies are inconsistent and the power spectrum may increase or decrease in the same frequency band, so the characteristics of the different frequency bands in the pathogenesis of tinnitus remain debated.
Despite the excellent results obtained using EEG linear analysis, there are still some drawbacks in describing the neural signal. The brain is a chaotic and dynamic system, with non-linearity more prominent under physical or mental activity (Garrett et al. Citation2003; Natarajan et al. Citation2004). For example, non-linear analysis under normal conditions such as rest, cognitive-perceptual tasks and sleep, as well as conditions such as epilepsy, polio, amnesia, schizophrenia, depression, autism and Alzheimer's disease have been used frequently (Natarajan et al. Citation2004; Stam Citation2005). Existing research has demonstrated that the EEG signal is a non-stationary time series with complex non-linear dynamics (Tao Citation2019). Non-linear methods can extract irregular information from EEG signals. In information theory, entropy is a measure of the uncertainty of things. This feature is not comparable to the frequencies derived from linear analysis, relative frequencies. It has also gained wide application in the field of automatic classification of epileptic EEG signals (Ignaccolo et al. Citation2010). In EEG studies, complexity analysis is frequently used to detect several disorders such as mild cognitive impairment (Zhu et al. Citation2017), schizophrenia (Sabeti et al. Citation2009; Thilakvathi et al. Citation2017), autism spectrum disorders (Bosl et al. Citation2011), Alzheimer's disease (Simons et al. Citation2018; Tylová et al. Citation2018) and epilepsy (Acharya et al. Citation2012). According to the second law of thermodynamics, low entropy refers to an ordered state in a regular system, while high entropy refers to a disordered state in a complex system. In EEG analysis, the entropy value refers to the complexity of the local neurons. Maryam Sadeghijam et al. found a significant difference between healthy individuals and tinnitus patients by Shannon entropy (p < 0.05), with all electrodes in the tinnitus group having increased entropy at low frequencies (p < 0.05) and most electrodes at medium frequencies (p < 0.05) (Sadeghijam et al. Citation2021). Julie et al. proposed a sample entropy-based time-domain detail structure frequency-following corresponding neural phase-locked value approach to overcome the limitations of existing Fourier transform analyses and delve into the auditory neural mechanism (Li et al. Citation2015). Jae-Jin Song et al. used a volumetric entropy model of brain networks based on resting-state EEG data to determine whether phantom perception occurred in brains with reduced peripheral auditory input by comparing the abilities of afferent nodes, Bayesian inference networks and default mode networks (Song et al. Citation2021). The above findings suggest that entropy can demonstrate specific differences in EEG signals in tinnitus patients compared to healthy subjects, and so far no inconsistent arguments about the findings have been found. Therefore, we studied the resting state EEG signals of 10 tinnitus patients and 10 normal subjects. Extraction of the features of each group of EEG signals and the sample entropy of the corresponding features by wavelet packet transform, The specific differences between the tinnitus patient group and healthy subjects were analysed.
2. Materials and methods
2.1. Participants
Patients with chronic tinnitus were recruited from October 2018 to July 2019 at the Department of Otolaryngology, Head and Neck Surgery of the PLA General Hospital and other hospitals. All participants in the tinnitus group had signs of definitive tinnitus for at least 3 months, and they also had normal hearing on the conventional hearing tests. Normal hearing was defined as follows: (1) A pure tone audiometric (PTA) threshold of 25 dB hearing level (HL) or better for all octave frequencies from 250 to 8,000 Hz; (2) transient evoked otoacoustic emission (OAE) with a signal-to-noise ratio (SNR) > 5 dB and a distortion product OAE with an SNR > 3 dB on OAE tests; (3) a waves I-III inter-peak latency < 2.4 ms and a wave V latency < 6.2 ms on 90 dB nHL click-evoked auditory brainstem response (ABR) tests; and (4) a normal tympanic membrane on otoscopy (Ahn et al. Citation2017). It had been proposed that the people with tinnitus who showed normal audiograms could have hidden hearing loss defined as damage to the auditory nerve fibers (Gollnast et al. Citation2017; Tziridis et al. Citation2021). Despite these possibilities, all patients with tinnitus in this study showed normal latencies in waves I-III of the ABRs and normal OAEs, which usually indicated the integrity of the peripheral auditory nerves (Møller et al. Citation1981; Møller and Jannetta Citation1982) and normal function of the cochlear hair cells (Kemp Citation1978; Mills and Rubel Citation1994). Recruiting patients without tinnitus and hearing loss from the general population. The data inclusion criteria for the tinnitus group and healthy subjects were as follows (Cao et al. Citation2020): (1) aged between 18 and 65 years, both right-handed. (2) All subjects had no history of drug and alcohol abuse, central nervous system disorders, psychiatric disorders, and were not in a state of anxiety or depression (Anxiety Self-Rating Scale and Depression Self-Rating Scale scores, SAS and SDS <50). (3) All subjects were of normal intelligence and matched for their age. (4) Binaural pure tone threshold average (PTA) of less than 25 dB for all tinnitus patients. The exclusion criteria for the tinnitus group are as follows: (1) A confirmed diagnosis of progressive neurological disease, a history of drug and alcohol abuse. (2) Those who have been treated for tinnitus. (3) Duration of tinnitus < 3 months. All participants were required to sign an informed consent form (Mai et al. Citation2021).
2.2. Electroencephalography recordings
All participants are seated in comfortable chairs in a completely quiet room, which is electrically and acoustically shielded and where no noise is allowed during the process. Recordings were made using a dense array EEG system with 64 channels. The sampling rate was set to 1000 Hz and the impedance was kept below 50 KΩ. Resting EEG was recorded for approximately 5 minutes.
2.3. Data Preprocessing
The resting EEG raw data included both the tinnitus group and the healthy subjects group. Using MATLAB for R2014a and the EEGLAB for v13.0.0 toolbox. Load each subject's raw data into EEGLAB. The pre-treatment steps are as follows. (1) Load the electrode coordinates file to correspond to the electrode cap electrode coordinates. (2) Browse the full data and remove the parts of the anomalous signals that fluctuate a lot. (3) Deletion of electrodes not related to the central brain, such as those around the eyes and those located at the root of the nose (CB1, CB2, FP1, FPZ, FP2, AF3, AF4).(4) Use a notch filter 49.5 to 50.5 Hz to remove 50 Hz industrial frequency interference. Band-pass filter 0.5 to 80 Hz to remove signal-to-noise interference. (5) Re-referencing with the reference electrode at both ears (M1M2). (6) Linear interpolation of bad electrodes for replacement. (7) Removal of independent components associated with artifacts using Independent Component Analysis (ICA). (8) Segmentation of the data (into two-second segments). (9) Export electrode data for thirty-two channels around the binaural area (FT7, FC5, FC3, FC1, FC2, FC4, FC6, FC8, T7, C5, C3, C1, C2, C4, C6, T8, TP7, CP5, CP3, CP1, CP2, CP4, CP6, TP8, P7, P5, P3, P1, P2, P4, P6, P8) (Mai et al. Citation2021).
2.4. Different areas of the electrode topographic map
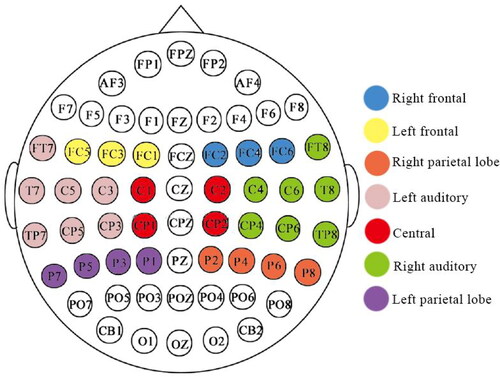
Daffner et al (Daffner et al. Citation2012) divided 128 conducting poles into 10 regions of interest. Referring to the principle of electrode division, in this paper, 62 conducting poles were divided into 7 regions of interest, left frontal region, right frontal region, left auditory region, right auditory region, central region, left parietal lobe region and right parietal lobe region ()
Figure 1. Schematic diagram of the 62 conductive pole cap electrode distribution and the 7 regions of interest of the brain analyser.
2.5. EEG microstate analysis
2.5.1. EEG feature extraction
The main feature extraction methods currently available for EEG signals are as follows. (1) Time domain analysis. Time domain analysis is a statistical and intuitive method of analysing the EEG waveforms in the time domain. Representative algorithms are: histogram analysis (Behnam and Pourghassem Citation2016), period-amplitude analysis (Feinberg et al. Citation1978), and half-wave analysis (Gotman Citation1982). However, the characteristics of the waveform vary greatly from patient to patient due to individual and medical differences. In addition, noise such as EMG, EEG and ECG can interfere with the EEG waveform, making the test less correct for practical clinical needs. (2) Frequency domain analysis method. The frequency domain analysis method is to calculate the frequency domain characteristics from the spectral distribution pattern and frequency component differences of the EEG signal, which can quantitatively characterize the overall spectral change pattern of the EEG signal. Common frequency domain analysis algorithms include Fast Fourier Transform (FFT) (Polat and Güneş Citation2008), Power Spectral Density (PSD) (Ghayab et al. Citation2018). an et al. performed a discrete cosine transform on the epileptic EEG signal and extracted the absolute median difference and variance of the corresponding coefficients as features to distinguish between normal and epileptic EEG signals, which has a low algorithmic complexity and the extracted features can accurately characterize epileptic and non-epileptic EEG signals (Bedeeuzzaman et al. Citation2012). However, due to the non-stationary nature of the EEG signal, frequency domain analysis is unable to reveal local patterns of change in the EEG signal over a specific period of time. (3) Time-frequency analysis. Time-frequency analysis is a method of analysis that can characterize the signal in both the time and frequency domains, and can effectively represent the transient information of the EEG signal. Common time-frequency domain analysis algorithms are: Discrete Wavelet Transform (DWT) (Sharmila and Geethanjali Citation2016), Wavelet Packet Transform (WPT) (Acharya et al. Citation2012), Empirical Mode Decomposition (EMD) (Bajaj and Pachori Citation2013). Zandi et al. performed a 9-layer wavelet packet transform of the epileptic EEG signal and calculated the log energy of each sub-band and the probability density function of the EEG signal, then used the composite epilepsy index to determine the EEG signal category and obtained a sensitivity of 90.5% (Zandi et al. Citation2010).Time-frequency analysis is able to characterise the local variability of EEG signals in the time-frequency domain and is more applicable to EEG signals than time-frequency analysis and frequency domain analysis. (4) Non-linear kinetic analysis method. The brain is a neural network consisting of tens of billions of neurons, and EEG is the best display technique to investigate the changes in brain function (Tziridis et al. Citation2021). Using the m-order Lempel-Ziv complexity and the maximum Lyapunov exponent, Huang et al. investigated the differences in EEG signals between normal, pre-epileptic and seizure phases, and the proposed algorithm was able to predict seizures with an accuracy of 87.5% (Huang et al. Citation2016). Non-linear methods can extract irregularities in the EEG signal and obtain more hidden information. Algorithms applied to EEG signals include: Fractal Dimension (FD) (Zhang et al. Citation2015), hurst exponent (Dongmei et al. Citation2010; Lahmiri and Shmuel Citation2019), lyapunov exponent (Übeyli Citation2010), entropy (Srinivasan et al. Citation2007; Tawfik et al. Citation2016).
In this paper, a combination of wavelet packet transform and sample entropy is used for tinnitus signal feature extraction. The wavelet packet transform can not only better extract the EEG signal in the low frequency domain, but also extract the features of the EEG signal in the high frequency domain, so that the EEG signal can be extracted with minimum information loss, and the sample entropy can be calculated for the extracted frequency band. Time domain analysis, frequency domain analysis, time-frequency analysis and non-linear dynamics analysis have produced impressive results in the study of automatic classification of EEG signals. However, feature extraction of EEG signals under only a single transform domain cannot fully exploit the implicit information in other transform domains, which easily causes information loss and the classification performance of the classification algorithm is not satisfactory. Therefore, the respective strengths of the analysis methods are utilised to provide a more comprehensive characterisation of the EEG signal, leading to multi-domain information mining, which in turn leads to more accurate analysis results and better classification performance. Zhang Yi et al. combined wavelet transform and sample entropy extraction features to identify motor imagery EEG signals, yielding the highest correct recognition rate better than using other traditional feature extraction methods, proving that the feature extraction method combining wavelet transform and sample entropy is an effective method for identifying EEG signals (ZHANG et al. Citation2012). Thus, this paper uses a wavelet packet transform combined with sample entropy for tinnitus signal feature extraction and a support vector machine classifier to classify tinnitus patients and healthy subjects.
2.5.1.1 Wavelet packet transform
Wavelets were originally proposed as a time-frequency domain analysis method by French scientist J. Morlet in 1984 when he was performing seismic data analysis. Because of its excellent characterisation of the time-frequency domain, wavelet analysis has become the most commonly used time-frequency domain analysis method for EEG signals. The continuous wavelet transform of the signal f(t) is defined as
Where is the wavelet transform coefficient, a is the scaling or scale factor, b is the translation factor,
is the wavelet function, and t is time.
The binary discrete wavelet transform is defined as
Where
The wavelet packet transform not only extracts the EEG signal in the low frequency domain better, but also extracts the EEG signal features in the high frequency domain, so that the EEG signal can be extracted with minimal loss of information. The essence of wavelet transform is to select a suitable wavelet basis function to approximate the original signal. After comparing and calculating the wavelet basis functions in Matlab toolbox with the characteristic waveform of tinnitus EEG, it was found that Daubechies wavelet was most similar to the characteristic waveform, so Daubechies wavelet was chosen as the wavelet basis function for decomposition.
2.5.1.2 Approximate entropy versus sample entropy in theory
Approximate entropy was introduced by Pincus in the early 1990s. Its physical meaning is the magnitude of the probability of a time series generating a new pattern when the pattern dimension m changes; the greater the probability of generating a new pattern, the greater the complexity of the series and the corresponding approximate entropy value will be greater. For ease of analysis, let B be the self-similar probability of the sequence in dimension m and A be the self-similar probability of the sequence in dimension m + 1, yielding CP = A/B. As can be seen from the approximate entropy algorithm, the approximate entropy is calculated with -ln(CP) as the model and the average of all models is calculated. In order to prevent ln(0), the approximate entropy is calculated in a way that clearly compares its own data segment, which is incompatible with the new information view and therefore must be biased. In contrast, the sample entropy calculates the logarithm of the sum, so the sample entropy algorithm does not include a comparison of its own data segments, which has the advantage of including larger A and B, as well as more accurate CP estimates, and thus the sample entropy calculation is not dependent on data length. Therefore, the sample entropy has theoretically higher accuracy than the approximate entropy (Li et al. Citation2014).
2.5.1.3 Sample entropy
Sample entropy is a new measure of time series complexity proposed by Richman and is an improved algorithm for approximating entropy. Studies have shown that sample entropy is more suitable than approximate entropy as an EEG feature (Li et al. Citation2014). The magnitude of entropy is a measure of the uncertainty of the system, if the entropy value is higher, it indicates that the system is more complex and has a strong randomness (Jinyan Citation2013). The specific algorithm for sample entropy is as follows.
Step 1 Reconstruct the single-channel EEG signal sequence in a specific order to form a set of m-dimensional vectors.
For count the number of vectors that satisfy the condition that,
Which
where u(a) is an element of vector X, d denotes the distance between vector X(i) and X(j), determined by the maximum difference of the corresponding elements, and j takes values in the range: [1,N-m + 1],i ≠ j.
Step 2 Find the average over all values of i, denoted as
Step 3 Let k = m + 1 and repeat steps 3-4 to obtain which
Step 4 The sample entropy (SampEn) is defined as
In practical computational applications, N cannot be so when N takes a finite value, the sample entropy is estimated as
2.6. Statistical analysis
Statistical analysis was performed using SPSS software. To compare the variability of the results between the tinnitus group and the healthy group, a non-parametric test was used as the entropy values did not conform to a normal distribution. The Mann-Whitney U Test was used. The criterion for statistical significance was defined as a p-value < 0.05.
2.7. Feature screening
The data in this paper are 64-lead EEG signals, and the sample entropy of 32-lead EEG signals near the periauricular area is extracted, with 32-dimensional features, and the entropy values of different frequency bands are extracted, with a total of 256-dimensional spatio-temporal features. Too high a dimensionality of feature vectors can lead to high computational effort, slow operations and high storage requirements. Since the characteristics of tinnitus effects exist at specific electrodes and frequency bands, there are more redundant characteristics. The prediction model based on decision trees in this paper is able to calculate the importance of features and can effectively measure the magnitude of their contribution to the correct classification in achieving a binary classification problem. A minimum number of optimal feature sets are selected while maintaining the original feature recognition rate. Optimal feature combinations not only remove redundant features and increase the speed of the algorithm, but also improve the accuracy of the algorithm.
2.8. Support vector machines (SVM)
SVM is a supervised learning classifier that differentiates data at maximum intervals by finding a hyperplane (LIU et al. Citation2009). SVMs have the advantage of maximizing edge regions while minimizing empirical errors, and their decision function and computational effort are determined by the support vector selected, which helps to eliminate redundant features and avoid problems such as dimensional catastrophes (Nicolaou and Georgiou Citation2012). In this paper, the tinnitus EEG data were randomly divided into training and test sets, and the optimal SVM parameters were found by a heuristic search method. In the test, the feature set (N) was randomly divided into 10 subsets of equal size and then the 9n/10 part of the feature set was trained to test the remaining features (n/10) 10 times. The average accuracy was then used as a reliable classification performance. Calculate its accuracy(Acc), recall(Re), precision (Pre) and F1. The above measurement equation is as follows (Powers Citation2011):
,
where TP - true positive (positive category predicts positive category), FP - false positive (negative category predicts positive category), FN - false negative (positive category predicts negative category), TN - true negative (negative category predicts negative category).
3. Results
The average age of tinnitus patients is 38 years, while the average age of healthy people is 35 years. The mean age of the two groups was statistically different. In order to exclude the effect of age on the results of the experiment, a one-way analysis of variance (ANCOVA) was carried out and the results indicated that the age factor was not influenced (). Entropy values were calculated for the seven regions of interest associated with the tinnitus occurrence network: right auditory, left auditory, central, left prefrontal, right prefrontal, left parietal and right parietal regions. Comparison of brain topography between healthy individuals and patients in eight frequency bands (δ, θ, α1, α2, β1, β2, β3 and γ) in seven regions of interest (e.g. ).
Figure 2. Sample entropy brain topography of the healthy group and each tinnitus group. Note: Left-healthy,Right-tinnitus
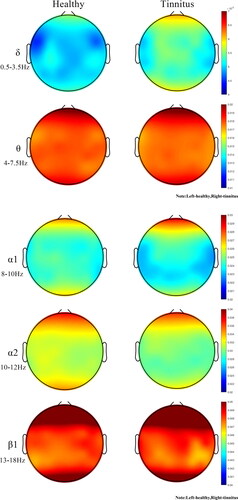
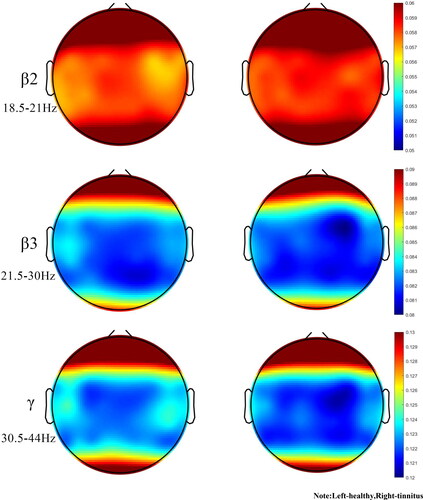
Table 2. Sample entropy values for the healthy group and tinnitus group.
Comparing the sample entropy results between the healthy group and the tinnitus group (), the differences were statistically significant (p < 0.05). There was an extremely significant difference channel between the healthy group and the tinnitus group (p < 0.01)(). Further comparing the sample entropy results between the healthy and tinnitus groups, there were statistically significant differences (p < 0.05) in the parietal, central, left ear and left prefrontal regions ().
Table 3. Mann-Whitney U test for the healthy group and tinnitus group for single channel.
Table 4. Mann-Whitney U test for the healthy group and tinnitus group.
The FC5 channel reflects the left frontal lobe, which is responsible for thinking, planning and central executive functions as well as motor execution, suggesting that tinnitus patients may be particularly disrupted in functions such as thinking due to the effects of tinnitus. The P4 channel reflects the parietal lobe, which is responsible for somatosensory perception, and the C1 and CP1 channels reflect the postcentral gyrus, which mainly receives somatosensory information. All regions of interest (ROIs) comparing sample entropy results for the healthy and tinnitus groups had greater mean entropy for the tinnitus group than for the healthy group in δ rhythm. In θ rhythm, the mean entropy of the tinnitus group was less than that of healthy individuals. Statistical differences were found in multiple ROIs (p < 0.05). Compared to normal subjects, the mean sample entropy of the α1 rhythm was lower in the tinnitus group than in the healthy group, the mean sample entropy of the α2, β1 rhythms was higher in the tinnitus patients than in the healthy group, and the mean entropy of the tinnitus patients was lower in the higher frequency bands (β2、β3 and γ rhythms) than in the healthy group in all ROI. The brain can be thought of as a chaotic system. Neuronal activity in the cerebral cortex produces asynchronous and synchronous firing through spontaneous EEG activity. Entropy measures the amount of statistical information carried by a random sequence, and an increase in entropy can be seen as an increase in chaotic behaviour within the brain.
In order to verify the effectiveness of wavelet transform and sample entropy in identifying tinnitus patients, four evaluation metrics, namely accuracy, recall, precision and FI, were selected to measure the recognition effect, and ten-fold cross-validation was used in this paper, and the results are shown in . The average accuracy rate was 91.38%, the average recall rate was 88.90%, the accuracy rate was 93.56% and the F1 was 91.09%. The method proposed in this paper is compared with existing tinnitus identification methods. In the literature (Wang et al. Citation2017), using multiple frequency bands as features and using least squares support vector machines for identification, its prediction accuracy was 82.8%. Guo Tingyi et al. performed EMD decomposition of the tinnitus EEG signals, extracted the energy corresponding to the IMF components as feature values, and used the SVM classification algorithm to classify and identify the EEG signals of patients and normal subjects, with an overall recognition rate of 73.68% (Yi et al. Citation2018). Huang Haiyun et al. identified tinnitus patients by experimenting with the full frequency band of their attention and their prediction was 80.21% accurate (Haiyun et al. Citation2021). Meanwhile, Luo et al. extracted the sample entropy of C3 and C4 channel μ rhythms to construct feature vectors and chose support vector machine (SVM) to classify left and right hand movement imagery EEG signals with an accuracy of up to 90.27% (Luo et al. Citation2021). And the average prediction accuracy of this paper is 91.38%, which is higher than the accuracy of the above literature, indicating that the combination of wavelet transform and sample entropy can effectively improve the accuracy of tinnitus recognition.
Table 5. Classification accuracy, recall, precision and F1 score.
4. Discussion
The aim of this study was to investigate the non-linear behaviour within the brain activity of tinnitus patient. The δ rhythm is associated with deep relaxation and restorative sleep, attributed to numerous unconscious bodily functions. θ rhythms are found in trance or hypnagogic states and represent subconscious states that are associated with feeling deep, primitive emotions, and irregular theta rhythms can affect anxiety and depression. The α rhythm is the frequency bridge between the β and θ rhythms and represents wakefulness, quietness and the best state for learning and thinking. Irregular α rhythm movements can lead to lack of concentration, anxiety, etc. β rhythms play an important role in cognitive reasoning, calculation, reading, and thinking, and are the most common high frequency waves in the waking state. The γ rhythm is important for learning, memory and processing and is used as a binding tool for the senses to process new information.In this paper, the sample entropy of resting state EEG signals was calculated and compared between tinnitus patients and healthy subjects. Tinnitus patients exhibit higher sample entropy values than the healthy group in almost all low and medium frequency bands (0.5 to 18 Hz) and regions of interest. However, it is interesting to note that in the mid to high frequency band (18-44 Hz), most regions of interest in tinnitus patients exhibit lower sample entropy values than the healthy group. Entropy values were statistically different between tinnitus patients and healthy subjects (P < 0.05), with extremely significant differences in some frequency bands (P < 0.01). As seen in , the δ rhythm in all regions of interest was greater in the tinnitus group than in the healthy group, in that irregular δ rhythm movements were closely associated with cognitive difficulties and problems in maintaining awareness, confirming the cause of mood irritability in tinnitus patients. The θ rhythm entropy values were lower in the tinnitus group than in the healthy group, and too low theta activity may cause patients to experience symptoms of anxiety and moodiness, which is consistent with the SAD and SAS values of the patient profile. In stressful situations, too much β rhythm activity or too little α rhythm activity results in ‘alpha blocking’, leading to a decrease in α1 rhythm activity and a highly cognitive state of arousal, preventing the patient from achieving the desired relaxation. The low γ rhythm activity confirms that tinnitus patients may have depression, cognitive learning problems.
Because of the irregular amplitude changes caused by rhythms in the brain of tinnitus patients, sample entropy is the best method of complexity for identifying tinnitus patients. Sample entropy is considered a useful method for assessing neurological disorders such as movement imagination (Luo et al. Citation2021), seizures (Mammone and Lay-Ekuakille Citation2011) and obsessive-compulsive disorder (Aydın et al. Citation2019). In addition, the computational complexity of the sample entropy is low. Higher results were provided by 10-fold cross-validation in each type of classification (Aydın Citation2015). In this paper, the seven regions of interest have different sample entropy values, which can be thought of as a result of intersubjective brain connectivity having different tight relationships. In previous studies, δ activity was more pronounced as a marker of auditory cortex abnormalities (Adjamian Citation2014a). In early linear studies, the brain's neural network associated with tinnitus activity may have low frequency activity (De Ridder et al. Citation2015). If entropy in the brain increases, then there will be a significant increase in entropy in the highest energy frequency band (which has been shown to be low frequency waves). The increase in low frequency waves can be seen as a change within the irregular system formed by the increase in entropy, which may indicate a chaotic state of the brain in tinnitus patients. The article analyses the low and mid frequency bands and finds an increase in entropy in the δ, α2 and β1 rhythms in tinnitus patients, and previous studies have also mentioned an increase in energy in the α2 and β1 bands in tinnitus patients (Adjamian Citation2014b). The increase in entropy indicates the presence of expanded irregularities in the brain. This is also consistent with the findings of previous studies (Sadeghijam et al. Citation2021). The current study appears to be consistent with previous linear studies. Non-linear analysis allows further detection and monitoring of changes in brain behaviour in tinnitus patients. By analysing the high frequency band, tinnitus patients showed a slight decrease in entropy in the β2, β3 and γ rhythms. It is reasonable to assume that resting tinnitus patients may have enhanced or diminished function in the relevant brain regions, or even a reversal of correlation, all of which could be considered abnormal functional connectivity (Weisz et al. Citation2007). One speculation about altered functional connectivity is that changes in habituation cause changes in synaptic function in relevant areas of the brain (Dosenbach et al. Citation2007), and changes in synaptic function ultimately lead to neuronal remodelling (Møller Citation2007). In the current study, tinnitus is a change of habit, and after the sudden onset of tinnitus, the patient needs to adapt to the persistent tinnitus noise, and this adaptation includes attenuating or shifting the effect on the tinnitus, etc. These lead to neuronal remodelling of synapses in areas of the brain associated with the network in question, resulting in negative correlations between network connections.
Tinnitus is a central neurological hearing disorder that has now become a rich subject in neuroscience research. Many hypotheses and theories have been put forward regarding the production of tinnitus and its loss of compensation (Adjamian et al. Citation2009). Tinnitus appears to be the result of impaired neuroplasticity in a distributed network consisting of temporal, frontal and parietal regions (Stein et al. Citation2015). In general, tinnitus is explained as a neurophysiological disorder caused by an imbalance between excitation and inhibition of the auditory nervous system (Hassan et al. Citation2016). The increased excitation in the auditory nervous system can be thought of as an increase in energy. According to the second law of thermodynamics, energy growth tends to expand, leading to irregular perturbations in the brain system and increasing chaos. There are different types of structures, functions and effective connections working together in the brain. When the energy of the auditory system rises, it radiates through these connections to the whole brain due to the connectivity that exists between the various areas of the brain. As a result, this irregularity appears to permeate any area of the brain into which it may invade.
In recent years in the academic field of studying EEG signals, statistical single-channel EEG has been found to be a more effective method of identification and classification, with good results in epilepsy, sleep stages (Hassan et al. Citation2015; Citation2016), and feature extraction using multiple channels of EEG, EOG and EMG may be a potential problem for two main reasons. Firstly, due to this, the preparation procedure of the subject becomes complicated. Secondly, more electrodes cause more interference and therefore reduce the quality of the recordings. Extracting single-channel EEG features may be an effective method for classifying tinnitus patients and will be of ongoing interest in subsequent experiments. More time-frequency domain analysis methods are proposed, such as tunable-Q factor wavelet transform (Hassan et al. Citation2016), complete ensemble empirical mode decomposition (Hassan et al. Citation2019), dual Tree Complex Wavelet Transform (Hassan and Bhuiyan Citation2016). There has not been much research in the field of tinnitus detection to indicate which is the most effective method, and subsequent studies will use a variety of analytical methods to compare them and find the method that best reveals information about tinnitus.
This paper explores the abnormal differences in resting-state sample entropy in tinnitus patients by using the resting-state brainwave activity of tinnitus patients. The occurrence of tinnitus leads to neuronal remodelling, with tighter connections in the parietal, central and frontal brain regions, validating the thalamocortical rhythm disruption model (TCD) as a possible mechanism for the occurrence of tinnitus. Increased entropy in tinnitus patients may reflect chaotic behaviour in the brain, and enhanced chaotic behaviour can be attributed to the activation of defective networks in tinnitus.
5. Conclusion
This study found a general increase in resting state EEG signal entropy compared to healthy subjects with tinnitus, reflecting the confusing behaviour of the brain in this population. Non-linear kinetic analysis provides a potentially valuable method to study brain networks, facilitating the investigation of the neurophysiological mechanisms behind the occurrence of tinnitus and hopefully providing a criterion for future clinical diagnosis of tinnitus.
There are some shortcomings in this study. Firstly, the sample of subjects was insufficient in number and the results of the experiment may be partially subject to chance. The next step will be to increase the number of tinnitus patient groups to make the results of the experiment more reliable. Secondly, there was no detailed questioning to control the pre-experimental medication intake of tinnitus patients and future studies should be more rigorous in regulating the subjects.
Disclosure statement
No potential conflict of interest was reported by the author(s).
. Overview of the patients with tinnitus.
Additional information
Funding
References
- Acharya UR, Molinari F, Sree SV, Chattopadhyay S, Ng K-H, Suri JS. 2012. Automated diagnosis of epileptic EEG using entropies. Biomedical Signal Proc Control. 7(4):401–408.
- Acharya UR, Sree SV, Alvin APC, Suri JS. 2012. Use of principal component analysis for automatic classification of epileptic EEG activities in wavelet framework. Expert Syst Appl. 39(10):9072–9078.
- Adjamian P. 2014. The application of electro- and magneto-encephalography in tinnitus research – methods and interpretations. Front Neurol. 5:228.
- Adjamian P, Sereda M, Hall DA. 2009. The mechanisms of tinnitus: perspectives from human functional neuroimaging. Hear Res. 253(1-2):15–31.
- Ahn MH, Hong SK, Min BK. 2017. The absence of resting-state high-gamma cross-frequency coupling in patients with tinnitus. Hear Res. 356:63–73.
- Ashton H, Reid K, Marsh R, Johnson I, Alter K, Griffiths T. 2007. High frequency localised “hot spots” in temporal lobes of patients with intractable tinnitus: a quantitative electroencephalographic (QEEG) study. Neurosci Lett. 426(1):23–28.
- Axelsson A, Ringdahl A. 1989. Tinnitus-a study of its prevalence and characteristics. Br J Audiol. 23(1):53–62.
- Aydın S. 2015. Classification of obsessive compulsive disorder by EEG complexity and hemispheric dependency measurements. Int J Neural Syst. 25:1550010.
- Aydın S, Güdücü Ç, Kutluk F, Öniz A, Özgören M. 2019. The impact of musical experience on neural sound encoding performance. Neurosci Lett. 694:124–128.
- Bajaj V, Pachori RB. 2013. Epileptic seizure detection based on the instantaneous area of analytic intrinsic mode functions of EEG signals. Biomed Eng Lett. 3(1):17–21.
- Bedeeuzzaman M, Farooq O, Khan YU. Aligarh, 2012. A DCT based approach to epileptic seizure detection. In International Conference on Multimedia, Signal Processing and Communication Technologies, 316–319.
- Behnam M, Pourghassem H. 2016. Real-time seizure prediction using RLS filtering and interpolated histogram feature based on hybrid optimization algorithm of Bayesian classifier and Hunting search. Comput Methods Programs Biomed. 132:115–136.
- Bosl W, Tierney A, Tager-Flusberg H, Nelson C. 2011. EEG complexity as a biomarker for autism spectrum disorder risk. BMC Med. 9:18–18.
- Cai Y, Huang D, Chen Y, Yang H, Wang C-D, Zhao F, Liu J, Sun Y, Chen G, Chen X, et al. 2018. Deviant dynamics of resting state electroencephalogram microstate in patients with subjective tinnitus. Front Behav Neurosci. 12.
- Cao W, Wang F, Zhang C, Lei G, Jiang Q, Shen W, Yang S. 2020. Microstate in resting state: an EEG indicator of tinnitus. Acta Otolaryngol. 140(7):564–569.
- Cohen MX. 2017. Where does EEG come from and what does it mean?. Trends Neurosci. 40(4):208–218.
- Daffner KR, Zhuravleva TY, Sun X, Tarbi EC, Haring AE, Rentz DM, Holcomb PJ. 2012. Does modulation of selective attention to features reflect enhancement or suppression of neural activity? Biol Psychol. 89(2):398–407.
- De Ridder D, Vanneste S, Langguth B, Llinas R. 2015. Thalamocortical dysrhythmia: a theoretical update in tinnitus.. Front Neurol. 6:124.
- Dongmei C, Weidong Z, Kai L, Shufang L, Shujuan G. 2010. A method for detecting epileptic EEG based on Hurst index and SVM. Chin J Biomed Eng. 29(6):836–840.
- Dosenbach NUF, Fair DA, Miezin FM, Cohen AL, Wenger KK, Dosenbach RAT, Fox MD, Snyder AZ, Vincent JL, Raichle ME, et al. 2007. Distinct brain networks for adaptive and stable task control in humans. Proc Natl Acad Sci U S A. 104(26):11073–11078.
- Feinberg I, March JD, Fein G, Floyd T, Walker J, Price L. 1978. Period and amplitude analysis of 0.5-3 c/sec activity in NREM sleep of young adults. Electroencephalogr Clin Neurophysiol. 44(2):202–213.
- Garrett D, Peterson DA, Anderson CW, Thaut MH. 2003. Comparison of linear, nonlinear, and feature selection methods for EEG signal classification. IEEE Trans Neural Syst Rehabil Eng. 11(2):141–144.
- Ghayab HA, Li Y, Siuly S, Abdulla S. 2018. Epileptic EEG signal classification using optimum allocation based power spectral density estimation. IET Signal Process. 12(6):738–747.
- Gollnast D, Tziridis K, Krauss P, Schilling A, Hoppe U, Schulze H. 2017. Analysis of audiometric differences of patients with and without tinnitus in a large clinical database. Front Neurol. 8:31.
- Gotman J. 1982. Automatic recognition of epileptic seizures in the EEG. Electroencephalogr Clin Neurophysiol. 54(5):530–540.
- Haiyun H, Yuexin CAI, Xueji FENG, Yuanqing LI. 2021. An electroencephalogram-based study of resting-state spectrogram and attention in tinnitus patients. J Biomed Eng. 38(03):492–497.
- Hassan AR, Siuly S, Zhang Y. 2016. Epileptic seizure detection in EEG signals using tunable-Q factor wavelet transform and bootstrap aggregating. Computer Methods Programs Biomed. 137:247–259.
- Hassan AR, Subasi A, Zhang Y. 2019. Epilepsy seizure detection using complete ensemble empirical mode decomposition with adaptive noise. Knowledge-Based Syst. 191.
- Hassan AR, Bashar SK, Bhuiyan M. 2015. On the classification of sleep states by means of statistical and spectral features from single channel Electroencephalogram. 2015 International Conference on Advances in Computing, Communications and Informatics (ICACCI). IEEE.
- Hassan AR, Bashar SK, Bhuiyan M. 2016. Automatic classification of sleep stages from single-channel electroencephalogram. India Conference. IEEE.
- Hassan AR, Bhuiyan M. 2016. Dual tree complex wavelet transform for sleep state identification from single channel electroencephalogram. 2015 IEEE International Conference on Telecommunications and Photonics (ICTP). IEEE,
- Houdayer E, Teggi R, Velikova S, Gonzalez-Rosa JJ, Bussi M, Comi G, Leocani L. 2015. Involvement of cortico-subcortical circuits in normoacousic chronic tinnitus: A source localization EEG study. Clin Neurophysiol. 126(12):2356–2365.
- Huang SN, Zhou Z, Wang PX, Zhang ZK, Xiong L. 2016. Research on preepilepsy prediction based on improved chaotic operator. Automat Instrum. 2016(2):3–4.
- Ignaccolo M, Latka M, Jernajczyk W, Grigolini P, West BJ. 2010. The dynamics of EEG entropy. J Biol Phys. 36(2):185–196.
- Jinyan CHEN. 2013. Automatic detection of epileptic seizure EEG. Shanghai: East China University of Science and Technology.
- Kemp DT. 1978. Stimulated acoustic emissions from within the human auditory system. J Acoust Soc Am. 64(5):1386–1391.
- Lahmiri S, Shmuel A. 2019. Accurate Classification of seizure and seizure-free intervals of intracranial EEG signals from epileptic patients. IEEE Trans Instrum Meas. 68(3):791–796.
- Langguth B, Kreuzer PM, Kleinjung T, De Ridder D. 2013. Tinnitus: causes and clinical management. Lancet Neurol. 12(9):920–930.
- Li Z, Juan D, Jianhua W, Nanrun Z. 2015. Experimental analysis of auditory neural phase locking mechanism based on sample entropy. J Phys. 64(18):351–360.
- Li L, Rui C, Jie X. 2014. A comparative study of approximate entropy and sample entropy characteristics of EEG data. Comput Eng Des. 35(03):1021–1026.
- Liu H, Zhou WD, Huang H. 2009. P300 EEG Recognition Based on SVM Approach. Chin J Biomed Eng. 18(1):35–39.
- Llinás R, Ribary U, Jeanmonod D, Kronberg E, Mitra PP. 1999. Thalamocortical dysrhythmia: A neurological and neuropsychiatric syndrome characterized by magnetoencephalography. Proc Natl Acad Sci U S A. 96(26):15222–15227.
- Luo ZZ, Lu XJ, Zhou Y. 2021. EEG feature extraction based on brain function network and sample entropy. J Electron Inform. 43(02):412–418.
- Mai J, Wang X, Li Z, Jia H, Fu H. 2021. Electroencephalogram signal characterization of tinnitus patients based on sample entropy algorithm and wavelet transform. J Phys Conf Ser. 2031(1):012065.
- Mammone N, Lay-Ekuakille A. 2011. Analysis of absence seizure EEG via permutation entropy spatio-temporal clustering. IEEE Int Symposium on Medical Measurements and Applications, p. 532–535.
- Mills DM, Rubel EW. 1994. V ariation of distortion product otoacoustic emissions with furosemide injection. Hear Res. 77(1-2):183–199.
- Moazami-Goudarzi M, Michels L, Weisz N, Jeanmonod D. 2010. Temporo-insular enhancement of EEG low and high frequencies in patients with chronic tinnitus. QEEG study of chronic tinnitus patients. BMC Neurosci. 11(1):40.
- Møller AR. 2007. The role of neural plasticity in tinnitus. Progress Brain Res. 166:37,544–45,544.
- Møller ARJannetta, PJ, 53. 1982. Evoked potentials from the inferior colliculus in man. Electroencephalogr. Clin Neurophysiol. 53(6):612–620.
- Møller AR, Jannetta P, Bennett M, Møller MB. 1981. Intracranially recorded responses from the human auditory nerve: new insights into the origin of brain stem evoked potentials (BSEPs). Electroencephalogr Clin Neurophysiol. 52(1):18–27.
- Natarajan K, Acharya U R, Alias F, Tiboleng T, Puthusserypady SK. 2004. Nonlinear analysis of EEG signals at different mental states. Biomed Eng. 3(1):7.
- Nicolaou N, Georgiou J. 2012. Detection of epileptic electroencephalogram based on Permutation Entropy and Support Vector Machines. Expert Syst Appl. 39(1):202–209.
- Nondahl DM, Cruickshanks KJ, Huang G-H, Klein BE, Klein R, Tweed TS, Zhan W. 2012. Generational differences in the reporting of tinnitus. Ear Hearing. 33(5):640–644.
- Polat K, Güneş S. 2008. Artificial immune recognition system with fuzzy resource allocation mechanism classifier, principal component analysis and FFT method based new hybrid automated identification system for classification of EEG signals. Expert Syst Appl. 34(3):2039–2048.
- Powers DM. 2011. Evaluation: from precision, recall and F-measure to ROC, informed-ness, markedness and correlation.
- Roberts LE, Bosnyak DJ, Thompson DC. 2012. Neu r a l plasticity expressed in central auditory structures with and without tinnitus. Front Syst Neurosci. 6:40.
- Sabeti M, Katebi S, Boostani R. 2009. Entropy and complexity measures for EEG signal classification of schizophrenic and control participants. Artif Intell Med. 47(3):263–274.
- Sadeghijam M, Talebian S, Mohsen S, Akbari M, Pourbakht A. 2021. Shannon entropy measures for EEG signals in tinnitus. Neurosci Lett. 762:136153.
- Schecklmann M, Lehner A, Poeppl TB, Kreuzer PM, Rupprecht R, Rackl J, Burger J, Frank E, Hajak G, Langguth B, et al. 2013. TB Poeppl…. Auditory cortex is implicated in tinnitus distress: a voxel-based morphometry study. Brain Struct Funct. 218(4):1061–1070.
- Schlee W, Schecklmann M, Lehner A, Kreuzer PM, Vielsmeier V, Poeppl TB, Langguth B. 2014. Reduced variability of auditory alpha activity in chronic tinnitus. Neural Plast. 2014(1):436146.
- Sharmila A, Geethanjali P. 2016. DWT based detection of epileptic seizure from EEG signals using Naive Bayes and k-NN classifiers. IEEE Access. 4:7716–7727.
- Shulman A, Avitable MJ, Goldstein B. 2006. Quantitative electroencephalography power analysis in subjective idiopathic tinnitus patients: a clinical paradigm shift in the understanding of tinnitus, an electrophysiological correlate. Int Tinnitus J. 12(2):121–131.
- Shulman A, Goldstein B. 2002. Quantitative electroencephalography: preliminary report–tinnitus. Int Tinnitus J. 8(2):77–86.
- Shuo-Ying Z, Tian-Hong Z. 2019. Research progress of tinnitus-related treatment. Med Rev. 25(15):3071–3075. 3080.
- Silvano G, et al. 2015. Prevalence and determinants of tinnitus in the Italian adult population. Neuroepidemiology. 45(1):12–19.
- Simons S, Espino P, Ab’ a D. 2018. Fuzzy entropy analysis of the electroencephalogram in patients with Alzheimer’s disease: Is the method superior to sample entropy? Entropy. 20(1):21.
- Song J-J, Park J, Koo J-W, Lee S-Y, Vanneste S, De Ridder D, Hong S, Lim S. 2021. The balance between Bayesian inference and default mode determines the generation of tinnitus from decreased auditory input: A volume entropy-based study . Hum Brain Mapp. 42(12):4059–4073.
- Srinivasan V, Eswaran C, Sriraam N. 2007. Approximate entropy-based epileptic EEG detection using artificial neural networks. IEEE Trans Inf Technol Biomed. 11(3):288–295.
- Stam CJ. 2005. Nonlinear dynamical analysis of EEG and MEG: Review of an emerging field. Clin Neurophysiol. 116(10):2266–2301.
- Stein A, Engell A, Junghoefer M, Wunderlich R, Lau P, Wollbrink A, Rudack C, Pantev C. 2015. Inhibition-induced plasticity in tinnitus patients after repetitive exposure to tailor-made notched music.. Clin Neurophysiol. 126(5):1007–1015.
- Tao Z. 2019. Research on automatic classification algorithm of epileptic EEG signals based on fuzzy distribution entropy and complex-valued fuzzy distribution entropy. Jilin University.
- Tawfik NS, Youssef SM, Kholief M. 2016. A hybrid automated detection of epileptic seizures in EEG records. Comput Electr Eng. 53:177–190.
- Thilakvathi B, Shenbaga DS, et al. 2017. EEG signal complexity analysis for schizophrenia during rest and mental activity. Biomed Res. 28(1):1–9.
- Tylová L, Kukal J, Hubata-Vacek V, Vyšata O. 2018. Unbiased estimation of permutation entropy in EEG analysis for Alzheimer’s disease classification. Biomedical Signal Proc Control. 39:424–430.
- Tziridis K, Forster J, Buchheidt-Dörfler I, Krauss P, Schilling A, Wendler O, Sterna E, Schulze H. 2021. Tinnitus development is associated with synaptopathy of inner hair cells in Mongolian gerbils. Eur J Neurosci. 54(3):4768–4780.
- Übeyli ED. 2010. Lyapunov exponents/probabilistic neural networks for analysis of EEG signals. Expert Syst Appl. 37(2):985–992.
- Wang SJ, Cai YX, Sun ZR. 2017. Tinnitus EEG classification based on multi-frequency bands. International Conference on Neural Information Processing. Springer, Cham.
- Wei X, Haibo X, WenLiang F. 2015. BOLD-fMRI study of functional connectivity of brain regions in patients with tinnitus in resting state. J Clin Radiol. 34(05):689–694.
- Weiler EWJ, Brill K, Tachiki KH, Wiegand R. 2000. Electroencephalography correlates in tinnitus. Int Tinnitus J. 6(1):21–24.
- Weisz N, Moratti S, Meinzer M, Dohrmann K, Elbert T. 2005. Tinnitus perception and distress is related to abnormal spontaneous brain activity as measured by magnetoencephalography. PLoS Med. 2(6):e153.
- Weisz N, Muller S, Schlee W, Dohrmann K, Hartmann T, Elbert T. 2007. The neural code of auditory phantom perception. J Neurosci. 27(6):1479–1484.
- Yexin C, Jiahong L, Haidi Y, Ling C, Yingfeng S, Xia Yin H, Hao X, Suijun C, Yangqiang C, Guisheng C, et al. 2018. Power spectrum of resting EEG topography in patients with subjective tinnitus. Chin Otolaryngol Head Neck Surg. 25(07):358–362.
- Yi GT, Fang LS, Guixian Z, Jiaxuan Z, Shuai Z. 2018. Research on tinnitus recognition algorithm based on EEG signal. Sci Technol Commun. 10(13):105–107.
- Zandi AS, Javidan M, Dumont GA, Tafreshi R. 2010. Automated real-time epileptic seizure detection in scalp EEG recordings using an algorithm based on wavelet packet transform. IEEE Trans Biomed Eng. 57(7):1639–1651.
- Zhang Y, Mingwei LUO, Yuan LUO. 2012. Wavelet transform and sample entropy feature extraction method for EEG signals. J Intell Syst. 7(04):339–344.
- Zhang Y, Zhou W, Yuan S. 2015. Multifractal analysis and relevance vector machine-based automatic seizure detection in intracranial EEG. Int J Neural Syst. 25(6):1550020.
- Zhu B, Chai C, et al. 2017. Analysis of EEG complexity in patients with mild cognitive impairment. J Neurol Disord. 5:354.
- Zobay O, Palmer AR, Hall DA, Sereda M, Adjamian P. 2015. Source space estimation of oscillatory power and brain connectivity in tinnitus. PLoS One. 10(3):e120123.