
 ?Mathematical formulae have been encoded as MathML and are displayed in this HTML version using MathJax in order to improve their display. Uncheck the box to turn MathJax off. This feature requires Javascript. Click on a formula to zoom.
Abstract
Exercise-induced laryngeal obstruction is a paradoxical laryngeal closure during inspiration at high-intensity exercise, with supraglottic closure being most common. This study develops a model based on the computational fluid dynamics to investigate airflow velocity and pressure and the air-induced loads on the supraglottis at various inspiratory flow rates. It is found that at high flow rates, positive wall pressure is formed in the hypopharynx localise towards its lower region, while posterior supraglottic wall pressures shift from positive to negative. These findings suggest that high inspiratory flow rates may increase supraglottic pressure differentials, ultimately contributing in the collapse.
1. Introduction
Exercise-induced dyspnoea is a common ailment that impacts many patients and is often attributed to asthma or intrathoracic airway obstruction. There is an increasing amount of literature regarding collapse of the upper respiratory tract (URT) during exercise, specifically at the larynx, where a paradoxical closure can occur during inspiration (Røksund et al. Citation2017). This exercise-induced laryngeal obstruction (EILO) is characterised by exertional dyspnoea, inspiratory stridor, and panic reactions, which quickly dissipates after cessation of exercise (Røksund et al. Citation2015). Johansson et al. (Citation2015) estimated the prevalence of EILO in the adolescent population between 5 and 7%, with the majority of those affected being female. Walsted et al. (Citation2021) noted that this trend of female preponderance is also carried into the adult populations with diagnosed EILO.
The presentation of EILO typically occurs in the supraglottic region, but closure at the glottis, or a combination of both has been documented (Nielsen et al. Citation2013; Walsted et al. Citation2021). Supraglottic collapse during EILO involves the anteromedial movement of the arytenoid cartilages and overlying mucosa with their associated corniculate cartilages, including the posterior aspect of the aryepiglottic folds. The supraglottis is defined as the upper region of the larynx situated between the laryngeal inlet and the glottis. The mechanism behind supraglottic collapse is largely unknown but several hypotheses have been proposed. Halvorsen et al. (Citation2017) published a statement on behalf of the European Respiratory Society and European Laryngological Society which outlines three pathophysiological mechanisms of inducible laryngeal obstruction, with mechanical insufficiency being implicated in the supraglottic obstruction observed during exercise. This hypothesis suggests that laryngeal tissue is unable to withstand forces induced by inspiratory airflow.
At present, the continuous laryngoscopy during exercise (CLE) test remains the gold standard for diagnosis and analysis of EILO. This test is not capable of studying the specific laryngeal airflow characteristics that would provide aerodynamic insights into the pathophysiology behind EILO. Walsted et al. (Citation2018) progressed the physiological understanding of EILO through comparing the respiratory testing data of EILO patients with matched control subjects. They identified that moderate to severe symptoms were clearly observable EILO patients at peak inspiratory flows greater 180 L/min. These patients also demonstrated a higher inspiratory capacity at low exercise intensities and adopted an altered breathing pattern. Fretheim-Kelly et al. (Citation2022) demonstrated a reliable and well tolerated method for obtaining translaryngeal pressures during the CLE test. This method offers an opportunity for additional measurements in diagnostic evaluation and treatment optimisation. However, these pressure measures do not describe pressures over the whole pressure field, or at the wall, which are valuable when attempting to deconstruct the pathophysiological mechanisms of EILO. At present, there is still a remarkable gap in knowledge about the behaviour of airflow and air-induced forces at the larynx during exercise.
Computational fluid dynamics (CFD) enables us to simulate airflow through the URT and collect data which is unattainable in the patient. Previously, CFD has been used to optimise aerosol drug delivery and predict particle deposition (Brouns et al. Citation2007; Shinneeb and Pollard Citation2012; Zhang and Kleinstreuer Citation2004; Koullapis et al. Citation2016; Cui and Gutheil Citation2011). These studies provide a foundation for the understanding of inspiratory fluid dynamics, but few studies have specifically investigated the laryngeal aerodynamics and air-induced forces.
Heenan et al. (Citation2003) created three-dimensional idealised geometry of the URT based on medical imaging data and demonstrated airflow features are influenced by anatomical characteristics of the URT. This geometry identified fundamental flow features, such as flow separation, recirculation zones, and demonstrated the impact of cross-sectional area changes on airflow in the URT. Anatomical features, such as the uvula, epiglottis, and a pronounced supraglottis, were shown to influence laryngeal airflow. These findings have been supported by (Heenan et al. Citation2004; Ball et al. Citation2008a, Citation2008b; Pollard et al. Citation2012; Azarnoosh et al. Citation2016). Lin et al. (Citation2007) and Choi et al. (Citation2009) showed that complex geometry of the pharynx and larynx will impact downstream airflow, due to vortices originating in these regions and continuing towards the supraglottis and trachea. CitationTabe et al. (2021) have shown that the highest airflow velocities are often observed in the laryngeal jet which develops as air passes through the narrow glottis. The high-velocity laryngeal jet impinges on the anterior wall of the trachea and leads to a highly three-dimensional posterior recirculation area, as shown by Johnstone et al. (Citation2004); Brouns et al. (Citation2006); Collins et al. (Citation2007); Ball et al. (Citation2008a, Citation2008b); Azarnoosh et al. (Citation2016); Pollard et al. (Citation2012). The location of specific flow behaviours and their interaction with the URT wall is crucial for understanding to airflow-induced forces.
Respiratory flow rates vary throughout the ventilatory cycle, especially in response to changes in physical activity. Hence, it is important to consider the influence of flow rate on airflow behaviour. Koullapis et al. (Citation2016) used a computational approach to study the air velocity profiles and particle deposition in the upper and lower respiratory tract. They demonstrated that mean flow topology was consistent across flow rates of Q = 15.2 litres per minute (L/min), 30 L/min and 60 L/min. It is known that at higher flow rates, the magnitude of the velocity profiles and turbulent kinetic energy are increased, which is supported by numerous other studies; see Kleinstreuer and Zhang (Citation2003); Takano et al. (Citation2006); CitationTabe et al. (2021); Shang et al. (Citation2019). The changes in the wall pressures at different flow rates have been investigated by Shang et al. (Citation2019), who found that increasing the inspiratory flow rate from 18 L/min to 50 L/min causes a significant increase in surface pressure drop at the glottis, from 60 Pa to 360 Pa, respectively. This demonstrated that pressure drop increases disproportionately to increases in flow rate. CitationTabe et al. (2021) experimentally identified a pressure drop of 2.5 kPa between the mouth and lower trachea at 60 L/min. However, Heenan et al. (Citation2003) conducted laboratory experiments, which showed pressure drop, between the mouth and lower trachea, of less than 0.6 kPa at flow rates greater than 60 L/min. These dramatic differences in results are likely a consequence of geometry differences and its influence on airway resistance.
An understanding of pressure values combined with shear stresses on URT wall will provide valuable information when considering aerodynamic influences of supraglottic collapse. The influence of the flow field on these values should be considered and whether changes to URT geometry can alter the distribution of forces. Walsted et al. (Citation2018) has shown peak inspiratory flow rates of Q = 240 L/min during exercise in EILO patients and control subjects. The majority of previous studies on inspiratory airflow utilise flow rates between 15 and 90 L/min, and do not reach values observed in maximal exercise.
In this study, a CFD model is developed to investigate the influence of several steady inspiratory flow rates on airflow and air-induced forces in the URT. We apply high inspiratory flow rates up to those observed in adults exercising at maximal intensity. This aims to develop our understanding of the aerodynamics involved in EILO, with a focus on the supraglottic and hypopharyngeal regions, as it is most prone to collapse.
In this article, we present the creation of the URT geometry and regions of interest in Section 2, followed by Section 3 on the numerical solution and its underlying theory, then the numerical set-up in Section 4. Results and discussion are given in Section 6, and this article is closed by some concluding remarks.
2. Upper respiratory tract geometry
An anonymised computed tomography scan of an adult male is used to create the three-dimensional representation of an adult URT using 3DSlicer. The geometry represents the respiratory pathway from the oral cavity to the trachea, with exclusion of the nasal cavities and nasopharynx due to the preponderance of oral breathing during maximal exercise. The inlet (mouth), outlet (trachea), and walls of the geometry are defined before exporting the geometry as a stereolithography file.
demonstrates the anatomical features of the URT geometry with the location and cross-sectional area of slices A-A to F-F
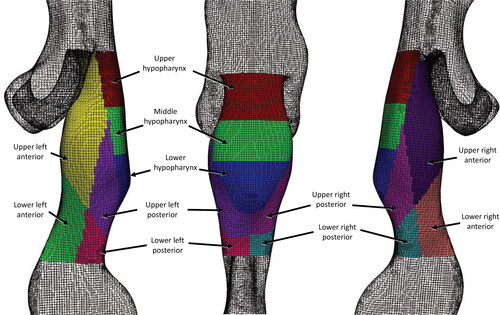
through the supraglottic and hypopharyngeal regions. To study the wall forces acting on these regions in greater detail, they are divided into eleven regions of interest (3 hypopharyngeal and 8 supraglottic), as shown in . The hypopharynx is defined as the region extending from the tip of the epiglottis to the laryngeal inlet, and is considered due to its upstream location to the supraglottis.
Figure 1. Upper respiratory tract geometry with key anatomical features labelled with locations and cross-sectional area of axial slices A-A to F-F
indicated.
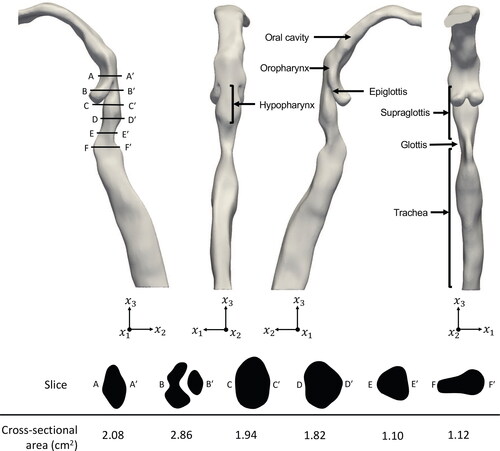
Figure 2. Location of the 11 regions of interest in the hypopharyngeal and supraglottic wall.
3. Theory and numerical solution
In this section, we discuss the theory and numerical solution of the computational fluid dynamics approach used in this study. A three dimensional, right-handed Cartesian coordinate system is used in this study, where x1 points to the right, x2 pointing into the paper, and x3 points vertically up, opposite to the direction of the gravitational acceleration; see . Indicial notation and Einstein’s summation convention are used, and subscripts after comma indicate differentiation.
The conservation of mass and momentum equations for a homogeneous, Newtonian and incompressible fluid are given by the Reynolds-Averaged Navier–Stokes (RANS) equations:
(1)
(1)
(2)
(2)
where ρ is the density of fluid, ν is the kinematic viscosity,
is the gravitational acceleration vector, and p is the pressure.
describes the velocity field, and
is the unit normal vector in the i direction.
is the time-averaged value of the fluctuating arbitrary variable f.
Given the fluctuating nature of the velocities in RANS equations, we adopt the model for the closure of the equations. Given in Menter (Citation1994), in this model, the kinematic viscosity is associated to the turbulent kinetic energy and dissipation by
(3)
(3)
where k is the thermal conductivity and ω is the specific turbulence dissipation rate and νt is the eddy-viscosity. For more details about the
model used in this study; see Menter et al. (Citation2003).
The air flow Mach number is small at all time (Ma < 0.03), and hence air is assumed incompressible in this study. The airflow is turbulent at the velocities of interest in this study, therefore it is important to consider the effect of turbulence. The k-ω model has been shown to outperform other RANS models for similar problems to that considered here, due to its treatment of the viscous effects near the wall region in wall bounded flows, similar to that in this study. Mylavarapu et al. (Citation2009) considered an expiratory flow rate of Q = 200 L/min through the URT and demonstrated that the k-ω model showed the best agreement, against other RANS models and large eddy simulation, for static pressure measurements at the wall, when compared to experimental results. Ball et al. (Citation2008a) and Mihaescu et al. (Citation2008) have also found that the k-ω model shows better agreement than other RANS models to experimental results for inspiratory flows.
The RANS equations are solved numerically using a finite volume approach, which is suitable for meshes of complex geometries, such as those of the URT. Velocity-pressure coupling is achieved through the PIMPLE algorithm, a combination of the semi-implicit method for pressure-linked equations (SIMPLE) algorithm, developed by Patankar and Spalding (Citation1972), and the pressure-implicit split-operator (PISO) algorithm, developed by Issa (Citation1986). PIMPLE can be used to stabilise simulations of complex geometries with non-orthogonal meshes. The computations are conducted in an open source computational fluid dynamics package, namely OpenFOAM (Jasak Citation2009).
4. Numerical set up
Five inspiratory flow rates of Q = 30, 60, 120, 180, and 240 L/min are considered in this study. A steady volumetric flow rate is applied to the inlet boundary condition, and fixed pressure of zero at the outlet was set. In addition, the no-slip condition is applied to the URT walls. Fluid properties of ρ = 1.225 kg/m3 and ν = 1.5 × 10– 5m2/s are used to represent air at 15 °C. All computational simulations are set with a variable time step to maintain a maximum Courant number of 0.5. One case is executed for 1.5 seconds of simulation, and no change in fluid flow is observed beyond 0.5 seconds. The residual convergence is set at 1 × 10– 5 for all variables. For the computations, two IntelXeon E5-2697A v4 processors (16 cores, 3.00 GHz) are used.
A mesh convergence study is conducted to establish the appropriate mesh for the computations. For the URT, a three-dimensional hybrid mesh consisting of hexahedral and split-hexahedral elements is generated using snappyHexMesh of OpenFOAM. Four meshes with increasing cell numbers are considered, listed in . Mesh convergence is assessed by applying an inspiratory flow rate of Q = 60 L/min and comparing the average pressure of two axial slices at the oral cavity and mid-oropharyngeal level. shows a summary of the meshes and results. Meshes A-C were compared to Mesh D, which has an extremely high mesh density. Mesh C demonstrated the closest agreement to Mesh D with a less than 3% difference in results at the two slices and a significant reduction in computational cost; see . Therefore, we determine that Mesh C provides an accurate representation of pressure in this model and is used in the following URT simulations.
Table 1. Summary of meshes and results of convergence test. Average pressures of Slices 1 and 2 are given and the percentage difference is measured with respect to Mesh D.
5. Comparisons
Results of the model given above are compared and discussed in this section. First, we present a comparison between available laboratory measurements and a computational simulation of fully-developed turbulent flow in a circular pipe to verify the numerical approach. Further, comparisons are made between the computational model of this study and published laboratory experiments and computational results of similar URT airflow cases.
5.1. Pipe flow comparison
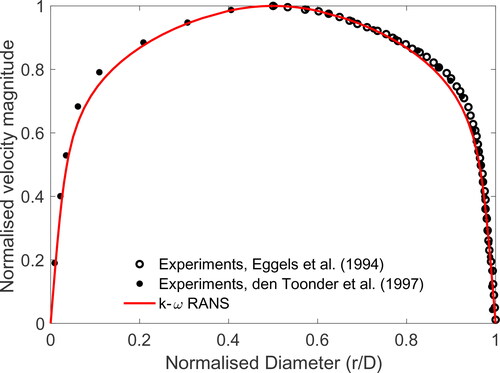
The RANS model with k-ω turbulence closure discussed the previous sections is used to study the airflow in a pipe, and the results are compared with published laboratory measurements. Eggels et al. (Citation1994) and Den Toonder and Nieuwstadt (Citation1997) experimentally studied airflow through a pipe using laser Doppler velocimetry and particle image velocimetry with a Reynolds number of Re = 4900 and Re = 5450, respectively. In this study, a horizontal pipe with circular cross-sections with diameter D = 3 cm and length L = 20 D is considered. A uniform inlet velocity of u = 2.45 m/s is applied to produce airflow inside the pipe with Re = 4900 to match the experimental conditions.
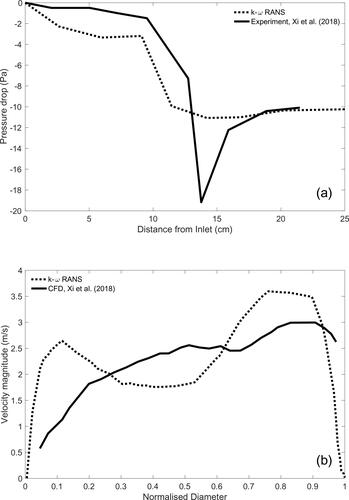
shows the normalised velocity profile across the circular pipe cross-section of the experimental and computational results. The velocity magnitude is normalised by the centreline velocity uc and the diameter is normalised by r/D, where r is the pipe radius. Outstanding agreement is observed between normalised velocity profiles across the pipe cross-section of the k-ω RANS and laboratory results of Eggels et al. (Citation1994) and Den Toonder and Nieuwstadt (Citation1997). The numerical approach used in this study is deemed suitable to resolve the fully developed turbulent internal flow.
Figure 3. Comparison of the results of the k-ω RANS model with laboratory experiments of Eggels et al. (Citation1994) and Den Toonder and Nieuwstadt (Citation1997) for velocity profile in a circular pipe.
5.2. Upper respiratory tract comparisons
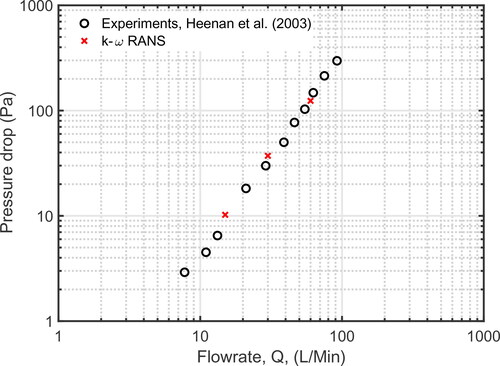
To establish further confidence in the numerical model developed here, several qualitative and quantitative comparisons against experimental and computational results of flow through the URT are considered. Heenan et al. (Citation2003) conducted an experimental study of airflow through an idealised geometry. The geometry used is modified from the one used by Stapleton et al. (Citation2000), who constructed the URT by combining simple geometric shapes to represent the relevant anatomical features using measurements from medical imaging data; see this article for full details of the geometry and method. Heenan et al. (Citation2003) experimentally measured pressure drop between the inlet and outlet of their URT model at a range of steady inspiratory flow rates, ranging from Q = 8 L/min to Q = 120 L/min. In our study, pressure drop values are obtained using the average pressure across the inlet and outlet for Q = 15, 30, and 60 L/min. plots pressure drop across the URT against flow rate. The results of the k-ω model used in our study demonstrate excellent agreement with the experimental measurements of Heenan et al. (Citation2003).
Figure 4. Comparison of the results of the k-ω RANS model with laboratory experiments of (Heenan et al. Citation2003) for pressure drop between the inlet and outlet of URT at different flow rates.
Xi et al. (Citation2018) experimentally studied the pressure drop along a realistic URT geometry, which was obtained directly from computed tomography data and provides a more detailed representation of the anatomical features. In their study, Xi et al. (Citation2018) developed five variations of their URT geometry with different glottic areas. The glottic area of the geometry used in our study is 1.12 cm2 which closely matches a geometry variation developed by Xi et al. (Citation2018) with a glottic area of 1.14 cm2 and is used for comparison. Xi et al. (Citation2018) applied an inspiratory flow rate of Q = 15 L/min and experimentally measured pressure at nine intervals along the entire URT geometry. Our RANS k-ω model is used to generate computational comparison using the URT geometry of our study with a flow rate of Q = 15 L/min. An average gauge pressure of nine axial planes throughout the length of the URT geometry is obtained and compared to Xi et al. (Citation2018) in .
A comparison of pressure drop values between our study and Xi et al. (Citation2018) shows near perfect agreement at the inlet and outlet, but significant variation at the larynx and the upstream regions. The variation in the two URT geometries can offer an explanation for the disparity in pressure values, but the exact cross-sectional values for the URT used in Xi et al. (Citation2018) are unknown. The oral and pharyngeal region of our URT appears to be narrower than those in Xi et al. (Citation2018), which leads to an increase of the fluid velocity and a subsequent decrease pressure values in this region. In , both models show a sharp pressure drop at 10 cm, this pressure drop is explained by the presence of the epiglottis in the pharynx, which produces the first major constriction encountered by inspiratory airflow through the URT. At the glottis, the largest difference between pressure values of the k-ω and experimental results is observed. The cross-sectional area of the glottis between the two URT geometries are closely matched and would be expected they produce similar values. However, glottic flow field can be influenced by upstream geometries. Choi et al. (Citation2009) and Heenan et al. (Citation2004) demonstrate that the inter- and intra-subject variability of the URT geometry can influence the flow fields at the larynx.
shows a further comparison of the computational results of Xi et al. (Citation2018) illustrating the similarities in the magnitude of the velocity profile along the anterior to posterior mid-point of the glottis. The RANS k-ω model show two peaks in the anterior and posterior parts of the profile, whereas the velocity profile of Xi et al. (Citation2018) show a relatively steady increase from anterior to posterior. This is influenced by upstream geometry variation; however, as expected, the greatest values are seen posteriorly.
The comparisons of k-ω model used in this study with the laboratory experiments of Heenan et al. (Citation2003) and Xi et al. (Citation2018) show good overall agreement overall.
6. Results and discussion
In this section, results of the RANS model for steady airflow at rates Q = 30, 60, 120, 180, and 240 L/min through the URT are presented, with a focus on the supraglottic and hypopharyngeal regions. Results are given in two subsections; the differences in the velocity and pressure fields, and then the distribution and magnitude of the forces on the wall.
6.1. Flow fields
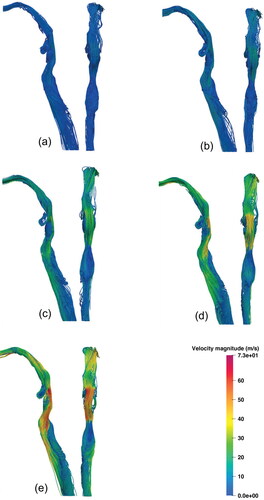
The velocity and pressure fields of the URT geometry are discussed here. The URT flow topology and streamlines are shown for Q = 30, 60, 120, 180, 240 L/min in , respectively. The air entering the inlet passes through the oral cavity and exhibits a velocity increase, with a vortex redirecting flow from the left side of the oral cavity to the right. The average velocity of the region increases as air passes through a minor constriction to enter the oropharynx. As it continues the airflow slows as the oropharyngeal geometry expands. The airflow is directed through a constriction formed by the tip of the epiglottis, forming the epiglottic jet. This jet flow is the location of peak velocity magnitudes in the URT of 9.19, 17.89, 35.33, 53.17, 75.19 m/s were observed at inlet flow rates of Q = 30, 60, 120, 180, and 240 L/min, respectively. Airflow passing into the hypopharynx and supraglottis forms an area of recirculation anteriorly and a high velocity jet, posteriorly. In , a three-dimensional vortex is present in the left of the anterior supraglottis. This vortex strengthens up to Q = 120 L/min, then appears to weaken at Q = 180 L/min and Q = 240 L/min; see .
Figure 5. Comparison of the k-ω RANS model results with Xi et al. (Citation2018): (a) experimental measurements for pressure drop along the URT and (b) computational results for the velocity profile at the mid-point of the glottis at Q = 15 L/min.
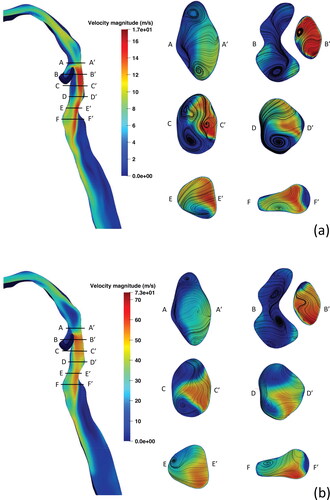
presents cross-sections of the instantaneous velocity contours and secondary streamlines in the hypopharynx and supraglottis at inlet flow rates of Q = 60 L/min and Q = 240 L/min. Labels A-F indicate the anterior aspect of the geometry, whereas labels A-F
indicate the posterior aspect. As the oropharyngeal flow approaches the hypopharyngeal region two counter-rotating vortices are seen in the lateral aspects, as seen in slices A-A
of . At higher flowrates, these lateral vortices in A-A
become increasingly compact but remain in this location. Similar observations were made by Shang et al. (Citation2019), where an increase in flow rate from Q = 15 L/min to Q = 50 L/min demonstrated variable placement of vortical structures in the laryngeal region and a weakening of supraglottic vortices. In B-B
to F-F
of , the epiglottic jet flow persists downstream along the posterior wall of the hypopharynx and continues as the laryngeal jet into the glottic and tracheal regions. These areas of flow separation correspond to two recirculation zones, one in the supraglottis, anterior to the epiglottic jet, and another, posterior to the laryngeal jet in the trachea, downstream of the glottis; see . These flow topologies are present at all flow rates studied and have been widely described in previous literature; see Liu et al. (Citation2016); Cui and Gutheil (Citation2011); Cui et al. (Citation2018); Banko et al. (Citation2015); Shang et al. (Citation2019); CitationTabe et al. (2021); Zhang and Kleinstreuer (Citation2004); Yan et al. (Citation2019). The flow separation in these regions are due to the narrowing of the geometry leading to high-velocity flow, which when followed by a significant geometry widening with subsequent slowing of airflow, leads to complex flow patterns. The supraglottic recirculation zone shows the appearance of two counter-rotating cylindrical vortices at Q = 60 L/min but weakens and reduces to one on the left-side at Q = 240 L/min; as shown in C-C
of . In the trachea, the decay of vortices at higher flow rates have been observed in idealised (Kleinstreuer and Zhang Citation2003) and realistic (Shang et al. Citation2019; CitationTabe et al. 2021) geometries but seen to reduce or disappear by Q = 60 L/min. shows vortices in the trachea are strengthened by higher flow rates. Here we have shown that general flow topology remains the same across all flow rates considered here. However, the secondary flow features are variable as higher flow rates are reached, which can manifest as a displacement of a vortex from side to the other.
Figure 7. Mid-sagittal instantaneous velocity contours and axial cross-sections through the supraglottis with secondary velocity streamlines at (a) Q = 60 L/min and (b) Q = 240 L/min.
Shown in are the URT pressure fields for inlet flow rates of Q = 60 L/min and Q = 240 L/min, with warmer colours assigned to positive values and cooler colours representing negative values. The general distribution of pressure values are similar at different flow rates, with a significant drop in pressure is observed at the epiglottic constriction between A-A and B-B
in , coinciding with the epiglottic jet. Slightly downstream, significant changes in the pressure field at Q = 60 L/min and Q = 240 L/min are observed in the supraglottis and hypopharynx; see slices C-C
to E-E
in . Slice C-C
demonstrates the loss of positive pressure values posteriorly and a higher magnitude of negative pressure anteriorly from Q = 60 L/min to Q = 240 L/min. Slice D-D
shows a reduction of positive pressure values in the supraglottis and localisation of positive pressure to the lower hypopharynx from Q = 60 L/min to Q = 240 L/min. Slice E-E
shows positive pressure values in the anterolateral aspect at Q = 60 L/min, which at Q = 240 L/min are significantly reduced on the left side and lost on the right side.
6.2. Wall forces
To better understand the impact of flow rate on supraglottic collapse, the airflow-induced forces exerted on the wall are assessed. shows the values and distribution for gauge pressure on the surface of the URT. In general, we observe an increase in pressure values in the URT as higher flow rates are applied. The pressure distribution at different flow rates remains similar upstream of the epiglottis and in the trachea, but demonstrates variation in the supraglottic and hypopharyngeal regions. At Q = 30 L/min, positive surface pressure values continue down the posterior wall of the hypopharynx and laterally into the supraglottis, with negative values seen anteriorly coinciding with the supraglottic recirculation zone; see . Whereas at higher flow rates, this region of positive surface pressure in the posterior hypopharynx becomes disconnected in the upper and middle regions and localises toward the lower hypopharynx as flow rate increases; see the middle view in . This is due to the increased velocity of the epiglottic jet at higher flow rates causing a significant pressure drop in the UH and MH regions, as mentioned in Section 6.1. A consistent region of positive pressure is located at the LH region across all flow rates, while down stream of this region of the posterior wall peak negative pressure can be identified. Yan et al. (Citation2019) computationally analysed nasal inspiration through the URT and observed the localisation of positive pressures in the lower hypopharyngeal region at an inspiratory flow rate of Q = 90 L/min, which was not present at lower flow rates Q = 50 L/min and Q = 30 L/min.
Figure 8. Mid-sagittal pressure field contours and axial cross-sections through the supraglottis with secondary streamlines at (a) Q = 60 L/min and (b) Q = 240 L/min.
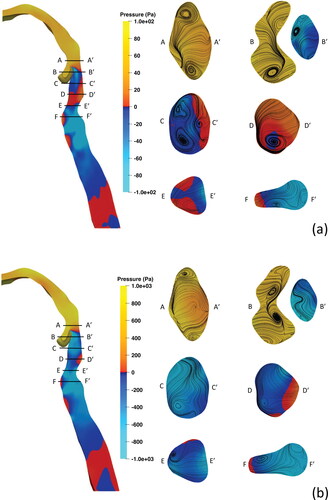
Figure 9. Pressure distribution on the URT wall for each flowrate presented from three views with left, middle, and right images being the left lateral, posterior, and right lateral views, respectively. (a) 30 L/min, (b) 60 L/min, (c) 120 L/min, (d) 180 L/min, and (e) 240 L/min.
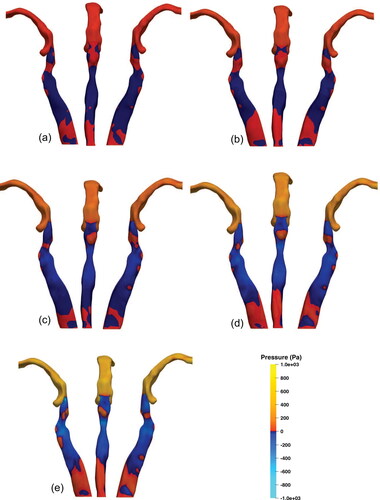
In the context of EILO, this demonstrates regions of the high positive and low negative pressures, creating a pressure differential, in close proximity to the regions prone to collapse which is reinforced as flow rate is increased. In the lateral supraglottis, the increase in flow rate reduces the pressure, which continues inferiorly to leave small areas of positive pressure near the glottis. Downstream of the glottis, an area of positive pressure on the anterior wall is observed due to the high-velocity flow of the laryngeal jet interacting with the anterior trachea. Posterior to this, in the region of the tracheal recirculation zone, negative gauge pressures is observed.
shows the pressure force acting on the regions of interest presented in . The pressure force is obtained by , where p is the pressure, and A is the surface area. The pressure forces in all hypopharyngeal subdivisions are positive at Q = 30 L/min then become negative at higher flow rates Q > 120 L/min in the UH and MH. The LH region exhibits a positive normal force at all flow rates in the LH, which peaks at 180 L/min with an average pressure of 84 Pa over the region. The high-pressure observed in the LH, occurs due to collision of the epiglottic jet against the downstream wall before it is redirected anteriorly through laryngeal inlet. The maximal negative forces were observed in the ULA and URA regions at all flow rates, shown in . These regions include the lateral margins of the epiglottic tip where peak velocities are observed in . In , the URP and ULP regions demonstrate inconsistency in their normal force values as higher flow rates are applied to the inlet. The URP has relatively low positive normal force at flow rates up to Q = 180 L/min, but at Q = 240 L/min drops significantly and becomes negative. The normal force of the ULP region is positive at low flow rates, which become negative at Q > 120 L/min and reaches a peak negative value at Q = 180 L/min.
Figure 10. Comparison of regions of interest. (a) Pressure forces acting on regions of interest in the original URT geometry and (b) normalised force comparison on regions of interest with different epiglottic angles. The forces are normalised with respect to the values of the lower hypopharyngeal (LH) region at each configuration. LH, lower hypopharynx; MH, middle hypopharynx; UH, upper hypopharynx; ULA, upper left anterior; URA, upper right anterior; ULP, upper left posterior; URP, upper right posterior; LLA, lower left anterior; LRA, lower right anterior; LLP. lower left posterior; lower right posterior; see for the relative positions.
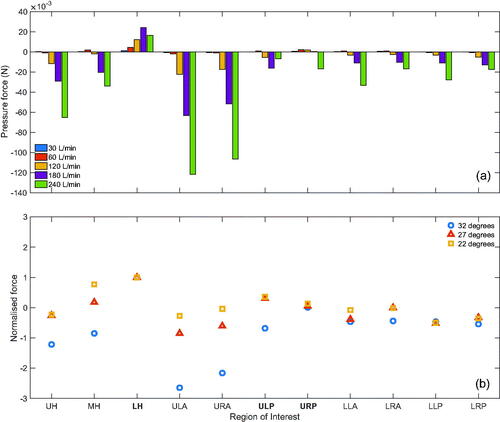
Figure 6. Lateral (left) and posterior (right) views of URT streamlines coloured by velocity magnitude for each inspiratory flow rate. (a) 30 L/min, (b) 60 L/min, (c) 120 L/min, (d) 180 L/min, and (e) 240 L/min.
Wall shear stress (WSS) was also considered at all flow rates. The region with the highest WSS values across all regions at all flow rates was UH with a peak value of 1.78 × 10– 3 N at 240 L/min, much smaller than the pressure force, and is not remarkable. The contribution of shear stresses on the loads exerted by air flow on the wall is very small in comparison to the normal forces and are unlikely to contribute to the collapse of these regions.
6.3. Effect of geometry
To investigate the significance of the geometry on the results discussed in this study, we consider two modified geometries in this section. The two geometric modifications from the original are achieved through anterior displacement of the epiglottis and are characterised by the angle of the epiglottis relative to the posterior oropharyngeal wall. The original geometry exhibits an epiglottic angle of 32 degrees, whereas modification 1 and modification 2 have angles of 27 degrees and 22 degrees, respectively. As previously discussed, the epiglottic projection into the URT causes a substantial increase in flow velocity, which likely dictates the downstream flow features observed in the supraglottis. Therefore, using these geometric modifications, we investigate effect of a geometric change on the force profile over the supraglottic and hypopharyngeal regions of interest. These cases were run with a steady, uniform flow rate of 180 L/min at the inlet. As previously described in Section 6.2, the LH region demonstrates the largest positive force across all regions and flow rates. Therefore, to better understand the distribution of forces and establish a profile of wall forces, each region is normalised by presenting it as a ratio of the LH force values for the respective geometry.
shows the distribution of forces relative to the LH values with close agreement between the 27- and 22-degree modifications. In the 32-degree geometry, the regions near the epiglottis exhibit much lower forces. The regions of the lower supraglottis (LLA, LRA, LLP, and LRP) across the modifications exhibit close agreement in values which suggests that the magnitudes of these forces are consistent, relative to the LH values of the same geometric configuration in this model. Relative forces in the upper regions of the supraglottis and hypopharynx are more variable, where the regions closest to the epiglottis (UH, MH, ULA, and URA) demonstrate the greatest variation. This is unremarkable as these are the regions in close proximity to the geometric modifications. This is in contrast with the posterior areas, URP and ULP, which are more closely related. These results demonstrate that wall forces in the lower supraglottic regions relative to the LH region are consistent between geometries of varying epiglottic geometries.
6.4. Further discussion
Our results demonstrate agreement with the general flow features identified by previous airflow studies through a URT geometry (Heenan et al. Citation2003, Citation2004; Ball et al. Citation2008a,Citation2008b; Pollard et al. Citation2012; Azarnoosh et al. Citation2016). It is shown that the flow topology remains consistent across all flow rates, but secondary flow features exhibit variation in their location as flow rates increases within the same geometry. The pressure field and subsequent wall forces exhibit variation in magnitude and distribution in the posterior supraglottic and lower hypopharyngeal regions, which is clearly evident at flow rates of 180 L/min and greater. In the context of EILO, these regions are in close proximity to areas that are observed to collapse during high intensity exercise. The presence of the epiglottic jet appears to cause high positive pressure forces in the lower hypopharyngeal region that increase with flow rate. This coupled with the negative pressure forces seen at higher flow rates in the upper posterior regions of the laryngeal inlet may be suggestive of a force differential facilitating the aerodynamic collapse of the supraglottis. This is in-line with the findings of Walsted et al. (Citation2018) who identified that all EILO patients in their cohort with an inspiratory flow rate of 180 L/min, or higher, at mid-inspiratory volume had moderate to severe laryngeal obstruction.
The flow rates considered in this computational model were steady and uniformly applied at the inlet.
We also observed that the velocity and pressure fields exhibit maximal values in close proximity to the epiglottis. The modifications considered here showed that the relative force profiles demonstrate variations in regions related to the epiglottis, but regions downstream were relatively consistent between the geometric configurations. This suggests that changes to the geometry may influence the force distribution locally but do not drastically influence relative wall forces and load distribution further away from the site of geometric change.
In this study, a single URT geometry (with some variable features) with a steady inspiratory flow is considered. The geometry omits several specific anatomical features that were not retained during creation of the geometry, which led to a simplification of the anatomy when compared to that observed in the patient. Future work should incorporate more detailed laryngeal anatomy and various anatomical configurations into the geometry to observe their influence on airflow. In real life, the breathing cycle demonstrates acceleration and deceleration of flow velocity occurring in inspiratory and expiratory directions. The unsteady oscillating flow pattern may differ in characteristics from the steady unidirectional flow studied in this work and should be explored in future research to ascertain its potential effect on the aerodynamic supraglottic collapse.
7. Conclusions
A k-ω RANS model is developed to numerically investigate the impact of steady inspiratory flow rates on airflow and air-induced forces in a computational URT model. The model is verified in comparison with available laboratory experiments and other numerical data. The URT geometry is developed from computed tomography data and several inspiratory flow rates are considered, ranging from Q = 30 L/min to Q = 240 L/min, to represent values observed during maximal exercise.
In this study, we find that the general flow topology and distribution of surface forces remain largely similar across the URT at lower flow rates, 30 L/min and 60 L/min. However, the supraglottic region exhibits variation in the velocity and pressure fields at flow rates greater than 120 L/min, which consequently leads to altered distribution of wall forces. These wall forces remain positive and localise in the lower hypopharynx, while becoming increasingly negative at the posterior supraglottis. These findings suggest that a hypopharyngeal-supraglottic pressure differential, exacerbated by high flow rates, may be a contributing factor that leads to the supraglottic collapse seen in EILO patients. This study provides the first analysis of inspiratory airflow at rates greater than 180 L/min. Further investigation is required to study the influence of geometric configurations and time-varying flow seen during the breathing cycle.
Disclosure statement
The authors report there are no competing interests to declare.
Funding
The author(s) reported there is no funding associated with the work featured in this article.
References
- Azarnoosh J, Sreenivas K, Arabshahi A. 2016. CFD investigation of human tidal breathing through human airway geometry. Procedia Comput Sci. 80:965–976.
- Ball C, Uddin M, Pollard A. 2008a. High resolution turbulence modelling of airflow in an idealised human extra-thoracic airway. Comput Fluids. 37(8):943–964.
- Ball CG, Uddin M, Pollard A. 2008b. Mean flow structures inside the human upper airway. Flow Turbulence Combust. 81(1–2):155–188.
- Banko AJ, Coletti F, Schiavazzi D, Elkins CJ, Eaton JK. 2015. Three-dimensional inspiratory flow in the upper and central human airways. Exp Fluids. 56(6):117.
- Brouns M, Jayaraju ST, Lacor C, De Mey J, Noppen M, Vincken W, Verbanck S. 2007. Tracheal stenosis: a flow dynamics study. J Appl Physiol. 102(3):1178–1184.
- Brouns M, Verbanck S, Beeck JV, Vanlanduit S, Lacor C. 2006. PIV on the flow of a simplified upper airway model. Proceedings of the 13th International Symposium on Applications of Laser Techniques to Fluid Mechanics.
- Choi J, Tawhai MH, Hoffman EA, Lin CL. 2009. On intra- and intersubject variabilities of airflow in the human lungs. Phys Fluids (1994). 21(10):101901.
- Collins TP, Tabor GR, Young PG. 2007. A computational fluid dynamics study of inspiratory flow in orotracheal geometries. Med Biol Eng Comput. 45(9):829–836.
- Cui X, Wu W, Gutheil E. 2018. Numerical study of the airflow structures in an idealized mouth-throat under light and heavy breathing intensities using large eddy simulation. Respir Physiol Neurobiol. 248(9):1–9.
- Cui XG, Gutheil E. 2011. Large eddy simulation of the unsteady flow-field in an idealized human mouth-throat configuration. J Biomech. 44(16):2768–2774.
- Den Toonder JM, Nieuwstadt FT. 1997. Reynolds number effects in a turbulent pipe flow for low to moderate Re. Physics of Fluids. 9(11):3398–3409.
- Eggels JGM, Unger F, Weiss MH, Westerweel J, Adrian RJ, Friedrich R, Nieuwstadt FTM. 1994. Fully developed turbulent pipe flow: s comparison between direct numerical simulation and experiment. J Fluid Mech. 268:175–210.
- Fretheim-Kelly Z, Engan M, Clemm H, Andersen T, Heimdal JH, Strand E, Halvorsen T, Røksund O, Vollsaeter M. 2022. Reliability of translaryngeal airway resistance measurements during maximal exercise. ERJ Open Res. 8(1):581–2021.
- Halvorsen T, Walsted ES, Bucca C, Bush A, Cantarella G, Friedrich G, Herth FJ, Hull JH, Jung H, Maat R, et al. 2017. Inducible laryngeal obstruction: an official joint European respiratory society and European laryngological society statement. Eur Respir J. 50(3):1602221.
- Heenan AF, Finlay WH, Grgic B, Pollard A, Burnell PK. 2004. An investigation of the relationship between the flow field and regional deposition in realistic extra-thoracic airways. J Aerosol Sci. 35(8):1013–1023.
- Heenan AF, Matida E, Pollard A, Finlay WH. 2003. Experimental measurements and computational modeling of the flow field in an idealized human oropharynx. Exp Fluids. 35(1):70–84.
- Issa RI. 1986. Solution of the implicitly discretised fluid flow equations by operator-splitting. Comput Phys. 62(1):40–65.
- Jasak H. 2009. OpenFOAM: open source Cfd in research and industry. Int J Nav Archit Ocean Eng. 1(2):89–94.
- Johansson H, Norlander K, Berglund L, Janson C, Malinovschi A, Nordvall L, Nordang L, Emtner M. 2015. Prevalence of exercise-induced bronchoconstriction and exercise-induced laryngeal obstruction in a general adolescent population. Thorax. 70(1):57–63.
- Johnstone A, Uddin M, Pollard A, Heenan A, Finlay WH. 2004. The flow inside an idealised form of the human extra-thoracic airway. Exp Fluids. 37(5):673–689.
- Kleinstreuer C, Zhang Z. 2003. Laminar-to-turbulent fluid-particle flows in a human airway model. Int J Multiph Flow. 29(2):271–289.
- Koullapis PG, Kassinos SC, Bivolarova MP, Melikov AK. 2016. Particle deposition in a realistic geometry of the human conducting airways: effects of inlet velocity profile, inhalation flowrate and electrostatic charge. J Biomech. 49(11):2201–2212.
- Lin CL, Tawhai MH, McLennan G, Hoffman EA. 2007. Characteristics of the turbulent laryngeal jet and its effect on airflow in the human intra-thoracic airways. Respir Physiol Neurobiol. 157(2–3):295–309.
- Liu X, Yan W, Liu Y, Choy YS, Wei Y. 2016. Numerical investigation of flow characteristics in the obstructed realistic human upper airway. Comput Math Methods Med. 2016:1–10.
- Menter FR. 1994. Two-equation eddy-viscosity turbulence models for engineering applications. AIAA J. 32(8):1598–1605.
- Menter FR, Kuntz M, Langtry R. 2003. Ten years of industrial experience with the SST turbulence model. Turbul Heat Mass Transf. 4(1):625–632.
- Mihaescu M, Murugappan S, Kalra M, Khosla S, Gutmark E. 2008. Large eddy simulation and Reynolds-averaged Navier-Stokes modeling of flow in a realistic pharyngeal airway model: an investigation of obstructive sleep apnea. J Biomech. 41(10):2279–2288.
- Mylavarapu G, Murugappan S, Mihaescu M, Kalra M, Khosla S, Gutmark E. 2009. Validation of computational fluid dynamics methodology used for human upper airway flow simulations. J Biomech. 42(10):1553–1559.
- Nielsen EW, Hull JH, Backer V. 2013. High prevalence of exercise-induced laryngeal obstruction in athletes. Med Sci Sports Exerc. 45(11):2030–2035.
- Patankar SV, Spalding DB. 1972. A calculation procedure for heat, mass and momentum transfer in three-dimensional parabolic flows. Int J Heat Mass Transf. 15(10):1787–1806.
- Pollard A, Uddin M, Shinneeb AM, Ball CG. 2012. Recent advances and key challenges in investigations of the flow inside human oro-pharyngeal-laryngeal airway. Int J Comut Fluid Dyn. 26(6–8):363–381.
- Røksund OD, Heimdal JH, Clemm H, Vollsaeter M, Halvorsen T. 2017. Exercise inducible laryngeal obstruction: diagnostics and management. Paediatr Respir Rev. 21:86–94.
- Røksund OD, Heimdal JH, Olofsson J, Maat RC, Halvorsen T. 2015. Larynx during exercise: the unexplored bottleneck of the airways. Eur Arch Otorhinolaryngol. 272(9):2101–2109.
- Shang Y, Dong J, Tian L, Inthavong K, Tu J. 2019. Detailed computational analysis of flow dynamics in an extended respiratory airway model. Clin Biomech (Bristol, Avon). 61:105–111.
- Shinneeb AM, Pollard A. 2012. Investigation of the flow physics in the human pharynx/larynx region. Exp Fluids. 53(4):989–1003.
- Stapleton KW, Guentsch E, Hoskinson MK, Finlay WH. 2000. On the suitability of k-ϵ turbulence modeling for aerosol deposition in the mouth and throat: a comparison with experiment. J Aerosol Sci. 31(6):739–749.
- Tabe R, Rafee R, Valipour MS, Ahmadi G. 2021. Investigation of airflow at different activity conditions in a realistic model of human upper respiratory tract. Comput Methods Biomech Biomed Engin. 24(2):173–187.
- Takano H, Nishida N, Itoh M, Hyo N, Majima Y. 2006. Inhaled particle deposition in unsteady-state respiratory flow at a numerically constructed model of the human larynx. J Aerosol Med. 19(3):314–328.
- Walsted ES, Faisal A, Jolley CJ, Swanton LL, Pavitt MJ, Luo YM, Backer V, Polkey MI, Hull JH. 2018. Increased respiratory neural drive and work of breathing in exercise-induced laryngeal obstruction. J Appl Physiol. 124(2):356–363.
- Walsted ES, Famokunwa B, Andersen L, Rubak SL, Buchvald F, Pedersen L, Dodd J, Backer V, Nielsen KG, Getzin A, et al. 2021. Characteristics and impact of exercise-induced laryngeal obstruction: an international perspective. ERJ Open Res. 7(2):195–2021.
- Xi J, April Si X, Dong H, Zhong H. 2018. Effects of glottis motion on airflow and energy expenditure in a human upper airway model. Eur J Mech B/Fluids. 72:23–37.
- Yan W, Tang C, Liu Y, Li G. 2019. Numerical study on abnormal airflow patterns and particle deposition characteristics in the realistic HUA model with pharyngeal obstruction. Powder Technol. 356:148–161.
- Zhang Z, Kleinstreuer C. 2004. Airflow structures and nano-particle deposition in a human upper airway model. Comput Phys. 198(1):178–210.