
 ?Mathematical formulae have been encoded as MathML and are displayed in this HTML version using MathJax in order to improve their display. Uncheck the box to turn MathJax off. This feature requires Javascript. Click on a formula to zoom.
ABSTRACT
As demand for regional and organically produced foodstuff has increased in Europe, the need has arisen to verify the products’ origin and production method. For food authenticity tracking (production method and origin), we examined 286 samples of wheat (Triticum aestivum), potatoes (Solanum tuberosum), and apples (Malus domestica) from different regions in Germany for their stable isotope compositions of oxygen, hydrogen, carbon, nitrogen and sulphur. Single-variate authentication methods were used. Suitable isotope tracers to determine wheat's regional origin were δ18O and δ34S. δ13C helped to distinguish between organic and conventional wheat samples. For the separation of the production regions of potatoes, several isotope tracers were suitable (e.g. δ18O, δ2H, δ15N, δ13C and δ34S isotopes in potato protein), but only protein δ15N was suitable to differentiate between organic and conventional potato samples. For the apple samples, 2H and 18O isotopes helped to identify production regions, but no significant statistical differences could be found between organically and conventionally farmed apples. For food authenticity tracking, our study showed the need to take the various isotopes into account. There is an urgent need for a broad reference database if isotope measurements are to become a main tool for determining product's origin.
1. Introduction
Using stable isotopes to trace the origin of agricultural products is a well-established approach [Citation1–3]. Tools for identifying food origins are urgently needed because of consumer demand for regional products. However, globalisation and free trade have led to much larger amounts of foreign products being sold on the German market. This makes it more and more difficult to trace food provenance [Citation4]. Along with an increase in food variety, the risk of mislabelling, either by accident or on purpose, also rises [Citation3].
Retail sales of organic products in Germany have increased to € 10 billion in 2017 [Citation5]. Organic food production is commonly more expensive than conventional food, and organic products usually sell for higher prices than the same goods produced conventionally [Citation6]. The European Community Council Regulation (834/2007, 889/2008) has delivered some practical standards to manage the labelling and the quality of organic productions [Citation7,Citation8]. Currently, the authenticity of organic products depends on enforcement of production standards through certification and inspection. As the actual origin is not readily perceptible for consumers, fraud at many stages along these supply chains, especially with regard to imported products and misuse, has a big potential to harm consumer trust and the ‘organic’ food market [Citation3].
The analysis of different stable isotopes has become a popular tool for determining or verifying the origin of foodstuffs [Citation1,Citation3,Citation9,Citation10]. Capuano et al. [Citation11] provide a more detailed review of studies applying multiple isotopes for authenticating foods provenance. Recent studies also demonstrate the potential of isotopes as biomarkers [Citation10–14]. For example, stable isotope analysis provides information on geographical origin, and whether food was produced in accordance with the EU regulations 834/2007 and 889/2008 on organic production.
Geological background, altitude [Citation15], climate [Citation16] and precipitation [Citation17,Citation18] cause a natural geographic variance in isotope ratios, but these are consistent within a given area. While stable water isotopes (2H and 18O) are suitable for differentiating large-scale regions [Citation19,Citation20], 13C, 15N and 34S isotopes provide details of product origins on smaller scale [Citation9,Citation21–26]. Plant water isotope composition (e.g. fruit water for apples) is determined by the natural variation in precipitation isotope signatures for 2H and 18O (data available via the Global Network of Isotopes in Precipitation [Citation27]). Thus, the water taken up by plants (tissue water) reflects the region where the plants were grown [Citation28]. Many food authenticity studies have used 15N isotope analysis to determine the geographical origin of plant products [Citation26,Citation29,Citation30], to distinguish between organic and conventional products [Citation6,Citation31,Citation32], or to find out more about nitrogen fertiliser application [Citation33]. Synthetic nitrogen fertilisers tend to have stable nitrogen isotope values close to zero, usually between –2 and +2 ‰ [Citation6], while manure shows values between +3.5 and +16.2 ‰ [Citation32] and the soil δ15N value is around +5 ‰ [Citation34]. In food authenticity studies, carbon isotope ratios are used to determine geographical origins [Citation26,Citation27,Citation29], analyse cultivars’ water efficiency [Citation35], plant cultivation methods, and to detect adulteration in wines and juices [Citation36,Citation37]. C3- and C4-plants differ in their carbon δ-values due to their carbon fixation strategies in the photosynthetic metabolism. The isotope ratios of carbon are further linked to the plant's water balance and regional climatic conditions [Citation35]. The isotope ratios of sulphur can be a helpful add-on when determining a plant product's origin [Citation38]. The δ 34S isotope values are influenced anthropogenically (e.g. via deposits from factory effluents) or geographically (for example via sea spray) and are mostly suitable as a local parameter [Citation39].
For our study, we analysed the isotopic compositions in wheat, potatoes and apples. These products are of worldwide importance for the food sector and of special importance for the European food market.
In 2017, the average world production of wheat was 771 million tons, and approximately 270 million tons were produced in Europe [Citation40]. There are incentives to fraud as different cultivars perform differently when milling to flour. The preferred varieties sell at premium prices [Citation41]. Studies by means of δ2H, δ13C and δ15N [Citation26,Citation28,Citation42,Citation43] have shown good discriminating possibilities for wheat when examining different regions within a country.
Potatoes are one of the world's most cultivated crop. The worldwide annual potato production in 2017 was 388 million tons [Citation40]. The global food market for potatoes is still rather limited as they are bulky and therefore rather expensive to transport. However, early potatoes are imported to Europe in spring from Israel and Egypt [Citation44]. Therefore, the authenticity of potatoes sold as regional products is important and needs to be controlled. Studies show that oxygen and sulphur isotope analysis makes it possible to distinguish between different growing areas [Citation29], and organic and conventional grown potatoes could be discriminated by oxygen isotope ratio analysis in plant-derived sulphate [Citation1].
Apple products are one of the seven foodstuffs most likely to be the target of fraud. This is especially true for apple juice [Citation20]. In total, 1.442 million litres of apple juice and nectars were consumed in Europe in 2017 [Citation45].
The aim of this study is to assemble a large reliable dataset for three agricultural plant products (wheat, potatoes and apples) and to test whether there are any systematic differences in oxygen, hydrogen, nitrogen, carbon and sulphur isotope compositions in these plants due to their method of production (organic vs. conventional farming). We further tested whether our multi-isotope approach is suitable for determining the regional geographical origin (within the FederalState of Hesse, Germany, or not). Since oxygen, hydrogen, nitrogen, carbon and sulphur are the most promising isotopes for determining or verifying the origin of foodstuffs, we adopted a multi-isotope approach in our study.
2. Material and methods
2.1. Sampling
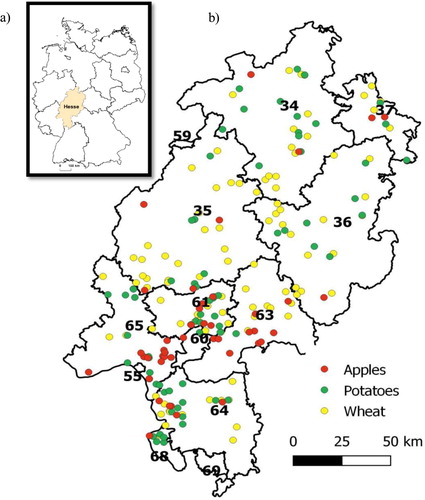
To test the regional origin and farming type of the products, a total of 286 plant product samples of wheat (N = 132), apples (N = 58) and potatoes (N = 96) were taken in 2013 and 2014 from regions within the Federal State of Hesse (Germany) and were separated according to their origin (address of the farm) (postal codes: 3 and 6). Additionally, samples from outside Hesse were taken by staff of the Research Institute for Organic Farming (FiBL) as well as bought from shops. The samples from outside Hesse regions within Germany as well as from outside Germany were randomly chosen. The samples were taken within the project ‘Watermark’ (see also Acknowledgements).
A standardised sampling procedure was used from Agroisolab and followed for all Hessian products: Wheat ears, apple fruits and potato tubers were sampled right before harvest. Sampling was performed by trained staff accompanied by the farmers. GPS references for the sampling locations were recorded, as well as postal codes, sampling dates, and organic or conventional farming type (). Each sample was accompanied by an individual document signed by the farmer containing individual farm and crop management data, a photo of the samples, crop variety and the farm's address. At each field site, samples were taken from four different locations within the same field. The samples were placed in one-liter bags, sealed, tagged with an individual barcode and sent to the Agroisolab laboratory within two days. With our sampling procedure, we could ensure that our samples were authentic and that no sample from the farms’ storage was mixed with products from another origin or farming method. The documentation sheets were sent to FiBL in Germany. In contrast to other studies [Citation46], in which samples were sent by farmers or control bodies to the analytical laboratory, our standardised procedure guarantees that all samples are authentic and represent a reliable database.
Figure 1. Map showing (a) sampling area in Germany and (b) the postal code areas in Hesse and the sampling locations of the three plant products.
summarises the number of conventionally and organically grown samples, the number of reference samples and the isotopes analysed for each plant product. Hessian samples are the sum of the number of organic samples and number of conventional samples from Hesse, so e.g. for wheat grain, there were 38 samples from organic and 70 samples from conventional fields taken, so altogether the data for samples from Hesse were 108 samples. Reference samples are the ones that were not from Hesse but from elsewhere.
Table 1. Number and characteristics of samples.
2.2. Sample preparation and isotope analysis
The stable isotopes of hydrogen, oxygen, nitrogen, carbon and sulphur in plant products were analysed on dried and pounded bulk samples from the apple's seeds, raw proteins (potatoes) and wheat. The samples with fat content (e.g. wheat, apple seeds) were extracted in a Soxlet apparatus for 6 h using dichloromethane. The comparison of common fat extracting agents (petroleum ether, diethyl ether, dichloromethane) showed that, taking the isotopic composition into account, all of them can be used equivalently [Citation39]. The extraction method followed the accredited Agroisolab's (Juelich, Germany) protocols based on a protocol developed within a different project [Citation39]. Dichloromethane was chosen as solvent because it is not flammable and therefore can be used for overnight extractions. The wheat samples were grinded in a ball mill to achieve a homogenous powder [Citation47]. For the fresh products such as potatoes and apples, the water fraction was gained through a modified gentle freeze-drying method developed at Agroisolab [Citation47]. This procedure allows a gentle separation of the water, so that isotope fractionating processes are avoided (e.g. Maillard reaction). The raw protein of potatoes was obtained by protein precipitation via Na2WO4 and acidification. The method is adapted from the processing according to AOAC 988.12. All raw proteins were washed three times before freeze drying. All solid samples were weighed in tin capsules (C, N, S) or silver capsules (O, H). Normally, silver capsules are preferred for stable isotope analysis of organic oxygen measured via high-temperature combustion. Stable isotope ratios were measured by continuous-flow isotope ratio mass spectrometry (CF-IRMS) in the following setup:
2.2.1. 18O/16O measurement of tissue water
The oxygen isotope ratios in the tissue waters were measured with a multi-flow-system with IRMS (Isoprime, Elementar, Manchester, UK). In principle the measurement uses an equilibration step of carbon dioxide with the tissue water.
2.2.2. 2H/1H measurement of tissue water
Elemental analyser (EA3000, Euro Vector, Pavia, Italy) in combination with IRMS (Isoprime, Elementar, Manchester, UK). The combustion tube was filled with chromium at a working temperature of 1050°C.
2.2.3. 2H/1H, 18O/16O measurement in organic
The high-temperature application uses HT-PyrOH (high temperature elemental analyser) with a covalently bonded silicon carbide tube (patented by Agroisolab) filled with glassy carbon chips and coal powder. Working temperature for pyrolysis is typically >1530°C. For higher precision, the isotopes are measured in a master/slave configuration with two isotope ratio mass spectrometers (IRMS, Isoprime, Elementar, Cheadle, UK). Each IRMS measures only one isotope ratio: 2H/1H or 18O/16O in organic. This configuration provides better stability because the magnetic field and accelerating voltage remain constant on each IRMS.
2.2.4. 13C/12C, 15N/14N measurement
Elemental analysis (EA3000, Eurovector, Milano, Italy) in combination with IRMS (Horizon, NU-Instruments, Wrexham, Wales). The combustion tube is filled with tungsten oxide and cobalt (II/III) oxide with silver coating, working temperature: 1021°C. After a water trap (magnesium perchlorate) the gases are reduced with copper, working temperature 600°C. Finally, N2 and CO2 are separated via a packed column (Porapak QS, 50/80, 3 m, 50°C).
2.2.5. 34S/32S measurement
Elemental analyser (EA3000, Eurovector, Milano, Italy) with IRMS (Isoprime, Cheadle, UK). A one tube combustion (oxidation and reduction in one tube) is used to avoid any issues caused by SO3. Combustion water is directly trapped with magnesium perchlorate at the end of the tube. Working temperature: 1000°C. SO2 separation via packed Teflon-column (Porapak, 50/80, 0.8 m).
All devices were operated in open split mode. All samples were measured up to four times. For normalisation, in-house standards were calibrated against international standards (Supplementary Table 2). The results were reported in δ-notation corresponding to international standards according to following general formula:
(1)
(1) Rsample = isotope ratio of the sample; Rstandard = isotope ratio of the corresponding international standard
R values describe the isotope ratios of 2H/1H, 13C/12C, 15N/14N, 18O/16O and 34S/32S, respectively. For oxygen and hydrogen, values are reported against the Vienna Standard Mean Ocean Water (V-SMOW); for carbon stable isotope ratios, the Vienna Pee Dee Belemnite (V–PDB) standard is used. Nitrogen isotope ratios are reported relative to IAEA-AIR standard (atmospheric air). Sulphur isotopes are expressed using the Vienna Canyon Diablo Troilite (V–CDT) standard. The results are described as δ2H, δ18O, δ15N, δ13C and δ34S values. The quality control of the measurements is secured through the lab's routine participation in European wide proficiency test (FIRMS) and IAEA international ring tests. Furthermore, the following reproducibility (1σ) of the isotope measurement is achieved in routine: δ18O(water) ≤ 0.2 ‰, δ2H(water) ≤1.5 ‰, δ15N ≤ 0.2 ‰, δ13C ≤ 0.2 ‰, δ34S ≤ 0.3 ‰, δ18O(organic) ≤ 0.3 ‰, δ2H(organic) ≤ 2.0 ‰.
2.3. Data analyses and statistical evaluation
To determine whether the isotopic compositions of the products can help to distinguish between different regions, samples were grouped using postal codes. Some products were divided only into two postal code regions, others with a larger number of samples were divided in up to four regions (for example postal codes 34/37, 35/36, 61/63, etc.). We grouped the Hessian samples according to farming method (organic or conventional) and analysed whether isotopic compositions of the plant products differed between the two production methods. All data were tested for normality using the Kolmogorov–Smirnov test and the Shapiro–Wilk test. Homoscedasticity was tested with the Levene's test. Depending on the results of these tests (normally distributed and homoscedastic), either Kruskal–Wallis rank sum tests or analyses of variances (ANOVAs) were applied. As posthoc test, Dunnett-T3 was applied to determine which groups were statistically significantly different (p ≤ 0.05).
As an extension to Bateman et al. [Citation6], we used the multivariate Gaussian (normal) density with the mean μ = (μ1, … μN) and covariance Σ = (Σ1, … ΣN) to represent the distribution of the isotope values of organic and conventional plant products in mixture models. Thus, the mean of each group (organic or conventional) of the measured individuals' δ-values can be used as an estimate of the mean of each population, and the standard deviation of each dataset gives an estimate of the standard deviation for the population. The probability density function p(x) of specific isotope values (x) is expressed as:
where the normal density
for the component is:
|.| is determinant.
is the weight that represents the proportion of a sample from different distributions. If
and
,
is the probability of a sample which belongs to the kth component.
Parameter estimations and hypothesis testing can be undertaken based on a likelihood framework. Given data y = (y1, … yM), the likelihood function of a mixture model with N components is: [Citation48]
3. Results and discussion
We were interested in whether mean values of different stable isotopes are useful to determine the origin (postal code region) and production method (organic vs. conventional) of foodstuffs when sampling very precisely and with authentic reference data.
in the Supplementary Information summarises means, standard deviations and statistical results for the regional and farming type comparison of the plant products’ water isotope composition (δ2H and δ18O).
3.1. Wheat
Comparing wheat samples, statistically significant differences for δ18O in lipids were found between the postal code regions for the organic samples. The Dunett-T3 post hoc test showed that the δ18O values were statistically significantly lower for postal code region 61/63 (+25.53 ‰) compared to region 35/36 (+26.39 ‰) (p = 0.04). However, there was neither a statistically significant difference between region 34/37 and 35/36 (p = 0.12) nor between region 34/37 and 61/63 (p = 1.0). Also, Kelly and Bateman [Citation32] stated that there might be limitations to finding differences between organic and conventional production in agricultural crops compared to horticultural crops [Citation32].
δ18O in lipids also showed statistically significant differences between the organically and conventionally produced wheat (). The samples from the organic farms were more enriched in δ18O compared to the samples from conventional farms. The modelled normal distribution curves for δ18O in lipids for organically and conventionally farmed wheat show a visible distinction between the two baselines. Comparing the values of wheat from Hesse and outside Hesse, statistically significant differences for δ2H in lipids, δ2H in organic matter and for δ18O in organic matter were found ().
Figure 2. (a) Boxplots for δ18O in lipids of conventionally and organically grown wheat, (b) histograms and modelled normal distribution curves for the organic and conventional wheat samples.
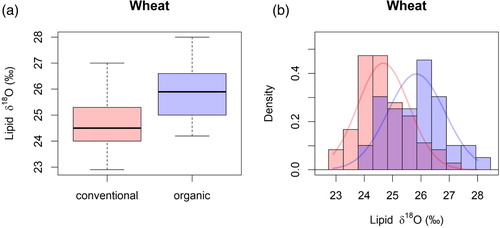
Figure 3. Boxplots for (a) δ18O and (b) δ2H in organic matter and (c) bulk δ15N of wheat from Hessian and Non-Hessian wheat samples.
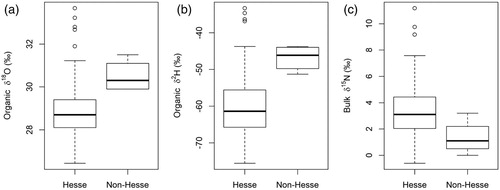
Since significant differences were not found between the postal code regions (except for organic samples) but were found between the larger areas (Hessian vs. non-Hessian samples) we conclude that water isotopes (2H and 18O) are a suitable tool for distinguishing between products from regions further apart, whereas on a smaller scale (postal code regions), they do not seem to be an appropriate tool. Other studies support this conclusion, as they found good discriminating possibilities for wheat when examining different regions within a country by means of δ2H, δ13C and δ15N [Citation26,Citation28,Citation42,Citation43]. Our comparison was done on a much smaller scale, where differences in precipitation isotopes are not as distinguishable.
Besides oxygen being taken up by plants through soil water, studies found that oxygen isotopes in wheat differ because of different evaporative conditions under which the plants were grown [Citation49]. The stomatal conductance could therefore be a reason for different oxygen values for the organic samples. It was shown before that plants with more open stomata are less enriched in 18O [Citation50]. For the present case, it could mean that the organic wheat plants differed in cultivars and thus stomatal conductance in the different regions, while this was not the case for the conventional ones (under the assumption that stomatal conductance can differ between cultivars). It could be conceivable that organic farms have a higher diversity of varieties than conventional ones.
For δ13C in lipids, the Kruskal–Wallis test did not show any significant differences between the postal code areas either for organically or for conventionally grown wheat samples. Means and standard deviations for δ13C in lipids of wheat ranged between – 33.5 ± 0.1 ‰ (postal codes 64–68) and –32.9 ± 0.8 ‰ (postal codes 35/36).
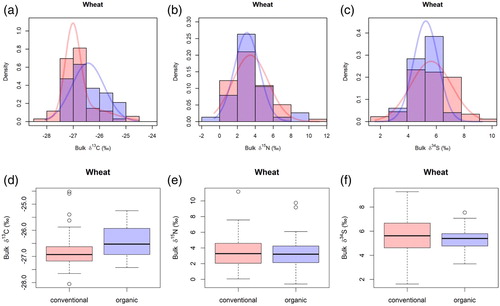
For δ13C, conventionally and organically grown wheat showed statistically significant differences ((a)). When comparing the modelled normal distributions for these isotopes, only δ13C was suitable to distinguish between conventionally and organically grown wheat ((d)). There were no statistically significant differences for the δ13C values of samples from Hessianand non-Hessian samples.
Figure 4. Boxplots for (a) bulk δ13C and (b) bulk δ15N and (c) bulk δ34S and modelled normal distributions for (d) bulk δ13C and (e) bulk δ15N and (f) bulk δ34S of conventionally and organically grown wheat.
For wheat in Hesse, the mean δ13C values were –26.71 ‰ in lipids, which were slightly more negative than values from a study by Luo et al. [Citation24], which ranged from −25.65 to −22.33 ‰. However, the authors had compared 35 wheat samples taken in Australia, USA, Canada and China to discriminate their geographical origin by means of δ13C and δ15N. In a study from India, Rashmi et al. [Citation26] found values between –24.62 and –27.84 ‰, and a discrimination between the regions was possible [Citation26].
Schmidt et al. [Citation31] showed that δ15N values were especially useful for discriminating organically and conventionally grown wheat, while Paolini et al. [Citation51] found for wheat that δ15N values were able to discriminate between the application of animal manure and synthetic fertilisers, but were not able to differentiate between synthetic nitrogen fertilisation or green manure from atmospheric nitrogen fixing legumes [Citation51].
In the study by Luo et al. [Citation24], δ15N values of wheat from Australia, USA, Canada and China ranged between +1.86 and +7.71 ‰. In China two different production regions for wheat could be discriminated by means of δ15N values (Jiangsu province and Shandong province) [Citation24]. Rashmi et al. [Citation26] tried to find differences between production regions within India for wheat and found δ15N values between +1.32 and +3.80 ‰, but no discrimination between the regions was possible. The same results were found in studies from Branch et al. [Citation41] and Longobardi et al. [Citation52], supporting our results that no discrimination between smaller regions is possible for wheat by means of δ15N, but we found statistically significant differences between Hessian and non-Hessian samples (see (c)). Differences in the manufacturer and amounts of fertiliser applied for the synthetic and organic fertilisers may explain the differences between the δ15N values of Hessian and non-Hessian samples.
For conventional samples, we looked at the δ34S differences among different regions. The post hoc test showed that the discrimination between region 35/36 and region 64/68 was not significant (p = 0.06), but region 35/36 had more positive mean values (5.80 ± 0.22 ‰) than region 64/68 (4.68 ± 0.34 ‰). Why sulphur was only suitable for discriminating between regions of conventionally grown wheat cannot be fully explained. Adams and Grierson [Citation53] examined δ34S values in plants. The natural abundances of sulphur isotopes were used, for example, for tracing deposition from the atmosphere and the impact of needles of Norway spruce (Picea abies) in northern German forests due to differences in the isotopic composition between soil and atmospheric SO2. However, soil microbial processes are still not fully explainable in terms of isotope fractionation processes. While mineralisation and immobilisation fractionate S isotopes, δ34S signatures of stream water or runoff are rarely studied. It is also uncertain whether uptake of SO2 by plants is attended by a noteworthy isotope discrimination [Citation53]. We did not find significant differences between the farming types for the δ34S or δ15N values ((b,c)).
3.2. Potatoes
While no significant differences were found for the organic potato samples on the postal code level, the ANOVA for δ18O values of conventional samples showed statistically significant differences (p = 0.03). Conventional samples from region 3 showed more negative values than from region 6, which was not true for the organic samples ((a)). For δ2H values of all Hessian samples, we found statistically significant differences between the postal code regions. The Kruskal–Wallis test confirmed these results. However, Hessian and non-Hessian samples could not be distinguished by means of δ18O isotope values or by δ2H values. This might be because samples from Israel and a range of European countries were all included in the group of non-Hessian samples, and the values measured were therefore rather heterogeneous.
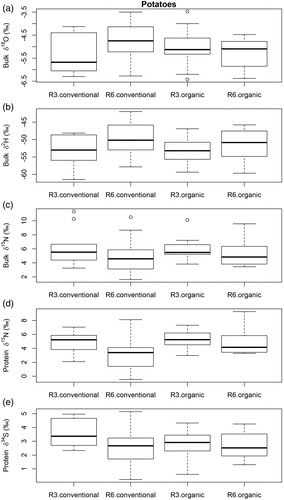
Figure 5. Boxplots for (a) bulk δ18O, (b) bulk δ2H, (c) bulk δ15N, (d) δ15N in protein and (e) δ34S in protein of conventionally and organically grown potatoes from region 3 (R3) and region 6 (R6.).
Potato is a water stress-sensitive crop, and is often irrigated during the growing season [Citation54]. This is also true for Hessian potatoes [Citation55]. Therefore, the water source of potatoes might not be predominately rain water, but groundwater. For example, potatoes cultivated in Idaho, USA, showed different δ18O values depending on whether they were irrigated with water from the Snake River or local groundwater, despite being in the same geographical region [Citation56].
In a study by Longobardi et al. [Citation52], potatoes’ δ18O values were statistically significantly different depending on the geographical region within Italy (Apulia, Tuscany and Sicily). The authors attribute this to the different climatic conditions to which the potatoes were subjected during their growth, especially due to the different cultivation cycles adopted.
Examining differences of δ15N in potato protein between postal code regions, the conventionally produced samples showed statistically significant differences between the regions (p = 0.00). For organic and conventional samples together, we found statistically significant differences for δ15N values (p = 0.04) and for δ15N in protein (p = 0.00). The same was true when samples from Hesse were compared with non-Hessian samples via Kruskal–Wallis test (for δ15N p = 0.05 and for δ15N in protein p = 0.05). The organic samples showed slightly more positive δ15N values in protein than the conventionally produced potatoes ((d)).
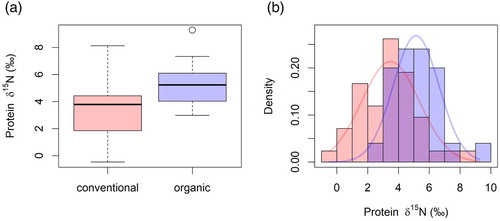
δ15N in protein was also useful for distinguishing between organic and conventional potato samples. The modelled normal distributions showed an overlap, their baselines were distinguishably different (). Compared to wheat and apples, less nitrogen fertiliser is applied to potatoes because nitrogen does not have such a big influence on the yield as it does for wheat [Citation57]. Therefore, the effect of fertilisation is rather small and the site-specific effects (soil N) are reflected in the δ15N values. Additionally, potato tubers reflect rather well the nitrogen content in the surrounding soil [Citation58] and therefore the soil conditions of the production region.
Figure 6. (a) Histograms and (b) modelled normal distributions for δ15N in protein of conventionally and organically grown potatoes.
Similar observations were made by Rogers [Citation34] for potatoes grown in New Zealand. Usually, animal manure shows more positive δ15N values than synthetic fertilisers, as animals eat plants (with δ15N values that reflect the soil N), and their body waste undergoes further 15N enrichment after excretion with onset of fractionation processes such as volatilisation of ammonia and denitrification or bacterial reworking of the nitrogen [Citation59–61]. Thus, the application of 15N depleted synthetic fertilisers would lower the overall soil δ15N value, whereas the application of 15N enriched organic fertilisers would increase the soil's δ15N value [Citation34]. This seems to be reflected in our δ15N values for potatoes.
For δ13C isotopes in protein of organic and conventional samples together, we could distinguish between postal code regions (p = 0.01; region 3: –27.9 ‰; region 6: –28.4 ‰) as well as between Hessian and non-Hessian samples for δ13C isotopes in organic matter (p = 0.00; Hesse: –26.1 ‰; Not-Hesse: –26.9 ‰). Rogers [Citation34] also identified δ13C in New Zealand as a suitable tracer for determining the geographical origin of potatoes. However, their plants’ carbon sources (CO2) showed different δ13C values in different regions. δ13C values of organic potatoes were more negative than those of conventional potatoes [Citation34], which was not the case in our study, but our δ13C values were comparable with the values of the study by Rogers [Citation34] which ranged between –24.5 and –27.0 ‰. Similar values were found in a study by Chung et al. [Citation29] of potatoes from different production regions within Korea. Longobardi et al. [Citation52] reported a regional variation for δ13C values in the same potato cultivar in Italian regions. Specifically, potato tubers cultivated in Apulia, Italy (–25.8 ‰) had higher δ13C values than those cultivated in Sicily, Italy (–26.4 ‰, p < 0.05). Hence, differences in δ13C appear to be associated with differences in local growing conditions [Citation42].
For δ34S isotopes in protein, we only found statistically significant differences in the conventional samples between postal codes 3 and 6 using the Kruskal–Wallis test (p = 0.05) ((e)). Chung et al. [Citation29] found that the δ34S values in potato tubers differed between cultivation regions within Korea and were also influenced by the type of cultivars. In general, δ34S values of agricultural products are mainly influenced by geological structures and their δ34S variation. However, the variability in δ34S remains poorly understood compared with other tracers [Citation62]. Industrial sulfate emissions may also influence the δ34S variation in the soil and agricultural products [Citation63] as well as atmospheric seawater [Citation29]. In our study, we attribute the observed variation in δ34S to differences in the geology/soil types.
3.3. Apples
For the Hessian apple samples, we found differences for δ18O (p = 0.04) and δ2H values (Kruskal–Wallis test; p = 0.05) between postal code regions 3 and 6. Apples from region 6 showed more positive δ2H and δ18O values (–48.5 ± 4.1 ‰ for δ2H; –3.8 ± 0.5 ‰ for δ18O) compared with samples taken in region 3 (–50.5 ± 2.6 ‰ for δ2H; –4.2 ± 0.5 ‰ for δ18O) ((a,b)).
Figure 7. Boxplots for (a) bulk δ18O, (b) bulk δ2H, (c) bulk δ15N and (d) bulk δ34S of conventionally and organically grown apples from region 3 (R3) and region 6 (R6).
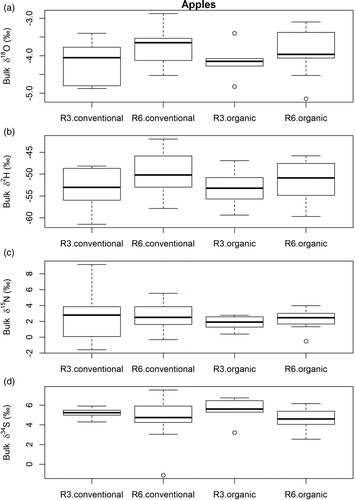
We observed δ2H values between –60 and –42 ‰. In a study by Bat et al. [Citation20] that compared Slovenian apples (measured as apple juice in 2011 and 2012) more positive δ2H values were found which ranged between –56.4 and –15.1 ‰ [Citation20]. δ18O values in Slovenian apple juice ranged from 0.9 to –4.8 ‰ [Citation20], in Italy from 1.1 to 3.0 ‰ [Citation25], while in our study δ18O values were between –5.2 and –2.9 ‰. In Romanian apples, δ18O values of −4.2 ‰ and δ2H values of −46.5 ‰ were found [Citation64]. Carter, Yates and Tinggi [Citation65,Citation66] showed that δ2H and δ18O values of ciders are predominately affected by the water available to the apple tree and evaporation [Citation65,Citation66]. Therefore, data of these studies shows that both between larger areas as countries and between smaller regions δ2H and δ18O can be indicators for apples’ origin.
The ANOVA did not show significant differences for δ13C. Mean δ13C values in region 3 were –26.7 ± 0.9 ‰ and for region 6 –26.2 ± 1.1 ‰. The δ13C values in our study were similar to values from a study by Lee and Wrolstad [Citation37] with δ13C values of –24.2 ‰. For Italian apples, Mimmo et al. [Citation25] observed values between –23.9 and –27.2 ‰ and Magdas et al. [Citation64] measured δ13C values in Romanian apples of −28.2 ‰. Thus, our results are comparable to other literature values.
In our study, δ15N values ranged from –0.5 to 9.2 ‰ with a mean value of 2.4 ‰, which is lower than the soil δ15N value. Mimmo et al. [Citation25] observed similar values, ranging between 1.1 and 3.0 ‰. We could not differentiate between different postal code regions on the basis of δ15N values in apples. Usually, apple trees are grown more extensively and less nitrogen fertiliser is applied [Citation65,Citation66]. Our study suggests that apple trees might have received less synthetic fertilisers and might have been fertilised in similar manners within Hesse, and therefore no significant differences were found for nitrogen isotopes. δ15N values in region 3 were 2.3 ± 2.7 ‰ and in region 6 2.5 ± 1.5 ‰.
δ34S isotopes could not be used to distinguish between different post code regions for apples either, possibly because the content of the amino acids cysteine and methionine, in which sulphur is mainly found in plants, is rather low compared to other amino acids and also compared to potatoes [Citation67,Citation68].
Because of statistical interferences between the farming types and regions, we were not able to distinguish between organically and conventionally farmed apples. In a comparable multi-isotope study, Bat et al. [Citation20] found that for Slovenian apples the most significant variables to distinguish between organically and conventionally cultivated fruits were δ15N values and antioxidant activity. However, the fertilising strategies for Hessian apples do not enable such a differentiation by means of δ15N.
4. Conclusions
Isotope analysis has proven to be a powerful tool in the authentification and tracing of our analysed agricultural plant products. Suitable indicators for wheat's regional origin were δ18O values and δ34S values. δ13C was the only isotope tracer that showed statistically significant differences between the organic and conventional wheat samples. For a visible separation between different production areas of potatoes, several isotope tracers were suitable (e.g. δ18O, δ2H, δ15N, δ13C and δ34S isotopes in potatoes’ protein), whereas only δ15N in protein was useful for distinguishing between organic and conventional potato samples. For the apple samples, water isotopes (2H and 18O) were able to distinguish between production regions. Due to statistical interferences between the farming types and production regions, we were not able to distinguish between organically and conventionally farmed apples.
Our study showed the need to analyse multiple isotopes for a higher discrimination between local and non-local products, or organically and non-organically produced plant products. Within the ‘Watermark’ framework, a large dataset of the isotopic compositions of Hessian foodstuffs was generated which lays the foundation for even broader authenticity controls of products sold on the German food market. In future, the aim should be to extend the existing Hessian database and to establish a German-wide isotope database, similar to other databases such as the British pork database (http://www.agroisolab.com/pork) or the British egg database (http://www.agroisolab.com/eggs). For a thorough comparison between foreign and German plant products, a larger reference dataset would also have been beneficial. One major future challenge will be to develop a harmonised global approach for food authenticity testing.
Future studies should consider using multi-element stable isotope methods and additionally could use other analytical methods such as DNA barcoding or microbiology, which are currently gaining increased attention in food traceability studies. It can be assumed that farming types will have a significant impact on overall microbial flora of food. A few studies have already demonstrated this for fruits and vegetables [Citation69–71].
Supplementary_information_200504.docx
Download MS Word (65.1 KB)Disclosure statement
No potential conflict of interest was reported by the author(s).
Data availability statement
The data that support the findings of this study are available from the corresponding author upon reasonable request.
Additional information
Funding
References
- Novak V, Adler J, Husted S, et al. Authenticity testing of organically grown vegetables by stable isotope ratio analysis of oxygen in plant-derived sulphate. Food Chem. 2019;291:59–67.
- Inácio CT, Chalk PM. Principles and limitations of stable isotopes in differentiating organic and conventional foodstuffs: 2. Animal products. Crit Rev Food Sci Nutr. 2017;57(1):181–196.
- Danezis GP, Tsagkaris AS, Camin F, et al. Food authentication: techniques, trends & emerging approaches. TRAC-Trends Anal Chem. 2016;85:123–132.
- Destatis. Federal Statistical Office. German exports in May 2019: +4.,5% compared to May 2018. 13.08.2019; Available from: https://www.destatis.de/EN/Press/2019/07/PE19_259_51.html
- Statista. Retail sales value of organic products in Europe in 2017, by country (in million euros). 13.08.2019. Available from: https://www.statista.com/statistics/632751/retail-sales-of-organic-products-europe/
- Bateman AS, Kelly SD, Woolfe M. Nitrogen isotope composition of organically and conventionally grown crops. J Agric Food Chem. 2007;55(7):2664–2670.
- Cioloş D. Introductory note by the EU Commissioner for Agriculture & Rural Development to IFOAM 2012: European Organic Regulations (EC) No 834/2007, 889/2008 and 1235/2008 An Evaluation of the First Three Years Looking for Further Development. 18.08.2019; Available from: https://biocyprus.org/NOMOTHESIA/ifoameu_reg_regulation_dossier_201204_en.pdf.
- Zhang Y. Application of isotopic analysis for food authenticity and traceability: progress and challenges [master thesis]. Charlottesville (VA): Department of Environmental Sciences, University of Virginia; 2015.
- Chung IM, Lee TJ, Oh YT, et al. Ginseng authenticity testing by measuring carbon, nitrogen, and sulfur stable isotope compositions that differ based on cultivation land and organic fertilizer type. J Ginseng Res. 2017;41:195–200.
- Laursen KH, Bontempo L, Camin F, et al. Advances in isotopic analysis for food authenticity testing. In: Downey G, editor. Advances in food authenticity testing. Amsterdam: Elsevier; 2016. p. 227–252. (Woodhead Publishing Series in Food Science, Technology and Nutrition).
- Capuano E, Boerrigter-Eenling R, van der Veer G, et al. Analytical authentication of organic products: an overview of markers. J Sci Food Agric. 2013;93(1):12–28.
- Camin F, Perini M, Bontempo L, et al. Potential isotopic and chemical markers for characterising organic fruits. Food Chem. 2011;125(3):1072–1082.
- Sturm M, Lojen S. Nitrogen isotopic signature of vegetables from the Slovenian market and its suitability as an indicator of organic production. Isot Environ Health Stud. 2011;47(2):214–220.
- Flores P, López A, Fenoll J, et al. Classification of organic and conventional sweet peppers and lettuce using a combination of isotopic and bio-markers with multivariate analysis. J Food Compos Anal. 2013;31(2):217–225.
- Poage MA, Chamberlain CP. Empirical relationships between elevation and the stable isotope composition of precipitation and surface waters: considerations for studies of paleoelevation change. Am J Sci. 2001;301(1):1–15.
- Chesson LA, Podlesak DW, Erkkila BR, et al. Isotopic consequences of consumer food choice: hydrogen and oxygen stable isotope ratios in foods from fast food restaurants versus supermarkets. Food Chem. 2010;119(3):1250–1256.
- Akers PD, Welker JM, Brook GA. Reassessing the role of temperature in precipitation oxygen isotopes across the eastern and central United States through weekly precipitation-day data. Water Resour Res. 2017;53(9):7644–7661.
- Rozanski K, Araguás-Araguás L, Gonfiantini R, et al. Isotopic patterns in modern global precipitation. In: Swart PK, Lohmann KC, Mckenzie J, editors. Climate change in continental isotopic records. Washington, DC: American Geophysical Union; 2017. p. 1–36. (Geophysical Monograph Series; 78).
- Brescia MA, Di Martino G, Guillou C, et al. Differentiation of the geographical origin of durum wheat semolina samples on the basis of isotopic composition. Rapid Commun Mass Spectrom. 2002;16(24):2286–2290.
- Bat KB, Eler K, Mazej D, et al. Isotopic and elemental characterisation of Slovenian apple juice according to geographical origin: preliminary results. Food Chem. 2016;203:86–94.
- Crittenden RG, Andrew AS, LeFournour M, et al. Determining the geographic origin of milk in Australasia using multi-element stable isotope ratio analysis. Int Dairy J. 2007;17(5):421–428.
- Guo BL, Wei YM, Pan JR, et al. Stable C and N isotope ratio analysis for regional geographical traceability of cattle in China. Food Chem. 2010;118(4):915–920.
- Bontempo L, Lombardi G, Paoletti R, et al. H, C, N and O stable isotope characteristics of alpine forage, milk and cheese. Int Dairy J. 2012;23(2):99–104.
- Luo D, Dong H, Luo H, et al. The application of stable isotope ratio analysis to determine the geographical origin of wheat. Food Chem. 2015;174:197–201.
- Mimmo T, Camin F, Bontempo L, et al. Traceability of different apple varieties by multivariate analysis of isotope ratio mass spectrometry data. Rapid Commun Mass Spectrom. 2015;29(21):1984–1990.
- Rashmi D, Shree P, Singh DK. Stable isotope ratio analysis in determining the geographical traceability of Indian wheat. Food Control. 2017;79:169–176.
- Global Network on Isotopes in Precipitation (GNIP). Vienna: International Atomic Energy Agency (IAEA). [cited 2019 Aug 18]. Available from: https://www.iaea.org/services/networks/gnip
- Liu H, Guo B, Zhang B, et al. Characterizations of stable carbon and nitrogen isotopic ratios in wheat fractions and their feasibility for geographical traceability: A preliminary study. J Food Compos Anal. 2018;69:149–155.
- Chung IM, Kim JK, Jin YI, et al. Discriminative study of a potato (Solanum tuberosum L.) cultivation region by measuring the stable isotope ratios of bio-elements. Food Chem. 2016;212:48–57.
- Camin F, Bontempo L, Perini M, et al. Stable isotope ratio analysis for assessing the authenticity of food of animal origin. Compr Rev Food Sci Food Saf. 2016;15:868–877.
- Schmidt HL, Rossmann A, Voerkelius S, et al. Isotope characteristics of vegetables and wheat from conventional and organic production. Isot Environ Health Stud. 2005;41(3):223–228.
- Kelly SD, Bateman AS. Comparison of mineral concentrations in commercially grown organic and conventional crops–Tomatoes (Lycopersicon esculentum) and lettuces (Lactuca sativa). Food Chem. 2010;119(2):738–745.
- Bateman AS, Kelly SD, Jickells TD. Nitrogen isotope relationships between crops and fertilizer: implications for using nitrogen isotope analysis as an indicator of agricultural regime. J Agric Food Chem. 2005;53(14):5760–5765.
- Rogers KM. Nitrogen isotopes as a screening tool to determine the growing regimen of some organic and nonorganic supermarket produce from New Zealand. J Agric Food Chem. 2008;56(11):4078–4083.
- Farquhar GD, Richards RA. Isotopic composition of plant carbon correlates with water-use efficiency of wheat genotypes. Aust J Plant Physiol. 1985;11:539–552.
- Reid LM, O’Donnell CP, Downey G. Recent technological advances for the determination of food authenticity. Trends Food Sci Technol. 2006;17(7):344–353.
- Lee HS, Wrolstad RE. Stable isotopic carbon composition of apples and their subfractions-juice, seeds, sugars, and nonvolatile acids. J Assoc Off Anal Chem. 1998;71(4):795–797.
- Hermanowski R, Boner M, Volz B, et al. Wasserzeichen. System zur Kontrolle von Erzeugnissen mit Regionalauslobung mittels der Analytik stabiler Isotope: Durchführung eines Praxistests [Watermark. System for the control of products with regional labelling using the analysis of stable isotopes: practical test.]; FKZ 28–1–91.024-13, Final report. Frankfurt: Research Institute for Organic Agriculture (FiBL); 2015. German.
- Boner M. Überprüfung der Authentizität von Rindfleisch (Bio) mit Hilfe der stabilen Isotope der Bioelemente [Dissertation]. Bonn: Landwirtschaftliche Fakultät, Rheinische Friedrich-Wilhelms-Universität; 2006. German.
- FAOSTAT. Crops. 2019. 13.08.2019; Available from: http://www.fao.org/faostat/en/#data/QC.
- Branch S, Burke S, Evans P, et al. A preliminary study in determining the geographical origin of wheat using isotope ratio inductively coupled plasma mass spectrometry with 13C, 15N mass spectrometry. J Anal At Spectrom. 2003;18(1):17–22.
- Wu Y, Luo D, Dong H, et al. Geographical origin of cereal grains based on element analyser–stable isotope ratio mass spectrometry (EA-SIRMS). Food Chem. 2015;174:553–557.
- Wadood A, Guo B, Liu H, et al. Study on the variation of stable isotopic fingerprints of wheat kernel along with milling processing. Food Control. 2018;91:427–433.
- Agrarmarkt Informations-Gesellschaft mbH. [Very firm early potato market.] 18.08.2019; Available from: https://www.ami-informiert.de/ami-themen/ami-themen/single-ansicht?tx_aminews_singleview%5Baction%5D=show&tx_aminews_singleview%5Bcontroller%5D=News&tx_aminews_singleview%5Bnews%5D=12849&cHash=c13b33a907e536bc052aa61aaf0eed19
- European Fruit Juice Association. 2018 – Liquid Fruit Market Report. 18.8.2019; Available from: https://aijn.eu/files/attachments/.598/2018_Liquid_Fruit_Market_Report.pdf
- Chiocchini F, Portarena S, Ciolfi M, et al. Isoscapes of carbon and oxygen stable isotope compositions in tracing authenticity and geographical origin of Italian extra-virgin olive oils. Food Chem. 2016;202:291–301.
- Boner M, Förstel H. Stable isotope variation as a tool to trace the authenticity of beef. Anal Bioanal Chem. 2004;378(2):301–310.
- Fraley C, Raftery AE. Model-based clustering, discriminant analysis, and density estimation. J Am Stat Assoc. 2002;97(458):611–631.
- Barbour MM, Fischer RA, Sayre KD, et al. Oxygen isotope ratio of leaf and grain material correlates with stomatal conductance and grain yield in irrigated wheat. Funct Plant Biol. 2000;27(7):625–637.
- Barbour MM. Stable oxygen isotope composition of plant tissue: a review. Funct Plant Biol. 2007;34(2):83–94.
- Paolini M, Ziller L, Laursen KH, et al. Compound-specific δ1⁵N and δ13C analyses of amino acids for potential discrimination between organically and conventionally grown wheat. J Agric Food Chem. 2015;63(25):5841–5850.
- Longobardi F, Casiello G, Sacco D, et al. Characterisation of the geographical origin of Italian potatoes, based on stable isotope and volatile compound analyses. Food Chem. 2011;124(4):1708–1713.
- Adams MA, Grierson PF. Stable isotopes at natural abundance in terrestrial plant ecology and ecophysiology: an update. Plant Biol. 2001;3(4):299–310.
- Shock C, Flock R, Eldredge E, et al. Successful potato irrigation scheduling. E. S. Oregon State University; 2006. ((EM 8911-E)).
- Landesbetrieb Landwirtschaft Hessen. [Irrigation.] 18.08.2019; Available from: https://llh.hessen.de/pflanze/bewaesserung/
- Chesson LA, Valenzuela LO, O’Grady SP, et al. Hydrogen and oxygen stable isotope ratios of milk in the United States. J Agric Food Chem. 2010;58(4):2358–2363.
- Zvomuya F, Rosen CJ, Russelle MP, et al. Nitrate leaching and nitrogen recovery following application of polyolefin-coated urea to potato. J Environ Qual. 2003;32(2):480–489.
- Millard P. The nitrogen content of potato (Solanum tuberosum L.) tubers in relation to nitrogen application–the effect on amino acid composition and yields. J Sci Food Agric. 1986;37(2):107–114.
- Choi W-J, Lee S-M, Ro H-M, et al. Natural 15N abundances of maize and soil amended with urea and composted pig manure. Plant Soil. 2002;245:223–232.
- Kendall C. Tracing nitrogen sources and cycling in catchments. In: Kendall C, McDonnell JJ, editors. Isotope tracers in catchment hydrology. Amsterdam: Elsevier; 1998. p. 519–576.
- Wolterink TJ, Williamson HJ, Jones DC, et al. Identifying sources of subsurface nitrate pollution with stable nitrogen isotopes. Final report, August 1976–March 1978 (PB--80-102064), 1979.
- Thode HG. Sulphur isotopes in nature and the environment: an overview. In: Krouse HR, Grinenko VA, editors. Stable isotopes in the assessment of natural and anthropogenic sulphur in the environment. Chichester: John Wiley & Sons; 1991. p. 1–26.
- Pichlmayer F, Schöner W, Seibert P, et al. Stable isotope analysis for characterization of pollutants at high elevation alpine sites. Atmos Environ. 1998;32(23):4075–4085.
- Magdas DA, Dehelean A, Puscas R. Isotopic and elemental determination in some Romanian apple fruit juices. Sci World J. 2012;2012:1–7.
- Carter JF, Yates HSA, Tinggi U. Stable isotope and chemical compositions of European and Australasian ciders as a guide to authenticity. J Agric Food Chem. 2015;63(3):975–982.
- Schönberg G. Langjährige Auswirkungen unterschiedlicher Düngung und Bodenpflege auf den Ertrag von Apfelniederstämmen [Long-term effects of different fertilisation and soil care on the yield of low-growing apple trees]. Arch Hortic. 1979;27(8):411–426. German.
- abel consulting. [Nutritional values apple.] 07.08.2019; Available from: https://www.naehrwertrechner.de/naehrwerte/F110000/Apfel
- abel consulting. [Nutritional values potatoes unpeeled fresh.] 07.08.2019; Available from: https://www.naehrwertrechner.de/naehrwerte/K120111/Kartoffeln+ungesch%C3%A4lt+frisch
- Ottesen AR, White JR, Skaltsas DN, et al. Impact of organic and conventional management on the phyllosphere microbial ecology of an apple crop. J Food Prot. 2009;72(11):2321–2325.
- Leff JW, Fierer N. Bacterial communities associated with the surfaces of fresh fruits and vegetables. PloS One. 2013;8(3):e59310.
- Bigot C, Meile JC, Kapitan A, et al. Discriminating organic and conventional foods by analysis of their microbial ecology: an application on fruits. Food Control. 2015;48:123–129.
- FiBL. [Watermark.] 13.08.2019; Available from: https://www.fibl.org/en/locations/germany/work-areas-germany/quality-de/watermark.html.