
 ?Mathematical formulae have been encoded as MathML and are displayed in this HTML version using MathJax in order to improve their display. Uncheck the box to turn MathJax off. This feature requires Javascript. Click on a formula to zoom.
ABSTRACT
In Germany, river monitoring for tritium started in the early 1970s. Today this monitoring network consists of 50 stations and includes stable isotopes. The stable isotope time series to the end of 2021 are at least four years and for some stations up to 30 years long. Daily river water samples were collected during an extraordinary dry season from October 2018 until end of January 2019 from six selected stations of the Rhine and five stations of the Elbe basin. The most dominating stable isotope effects in river water are the seasonal and altitude effects, but also a continental effect is visible. The isotopes indicate snow and ice melt contributions in the Rhine and Danube during the summer months and a consecutive dilution of these signals by mixing with tributary rivers. Close to the coasts in northern Germany, stable isotope patterns reflect influence of seawater and tides. Daily patterns during the dry season 2018/2019 surprisingly do not exhibit extreme changes but rather trends of enhanced groundwater contribution. Long-term continual data across scales are important for comparing and identifying hydrological processes in German river basins of different size and mean catchment altitudes, and highlight the benefits of a co-organized national network.
1. Introduction
Stable isotope (2H, 18O) composition of river water is mainly determined by input composition of precipitation, snow and ice melt, and runoff components, such as surface flow, subsurface flow and groundwater. Depending on local and regional factors, influences from lakes or surface water structures (dams, irrigation, channels, etc.) might alter stable isotope patterns e.g. through evaporation. Recharge altitudes, time of recharge (season) as well as transport characteristics along the flow paths and influencing processes during transport (e.g. evaporation loss and mixing) of sub-catchments all have impacts on the stable isotope patterns at outlets of larger basins [Citation1–4]. During low flow conditions, river water contains larger proportions of groundwater and potentially reflects the isotope signal of relatively slow-moving water. In addition to hydrological and hydro-chemical information, isotope signals collected at river stations or basin outlets integrate site characteristic information on hydrological processes and upstream conditions and provide important information on river water evolution, which is necessary for decision-making in water management.
Isotopes in precipitation have been available on the global scale since the early 1960s, and these datasets are accessible via the IAEA/WMO global network of isotopes in precipitation (GNIP). Global patterns of precipitation were discussed based on available datasets at that time [Citation5–7]. Stumpp et al. [Citation8] and Klaus et al. [Citation9] summarized the stable isotope composition of precipitation for currently 29 active stations in Germany. A global network of isotopes in rivers (GNIR) was initiated in the early 2000s by the IAEA [Citation3,Citation4,Citation10,Citation11]. Several other countries established national networks and reported isotope data for e.g. Austria, the USA and Switzerland [Citation12–15].
Continuous river water monitoring in Germany conducted by the Federal Institute of Hydrology (BfG) was originally organized to monitor environmental radioactivity in river water, suspended material and sediments [Citation16], but today stable isotopes are monitored at these stations, too. River water stable isotope patterns in Germany were discussed earlier for nine large river basins [Citation17] and seven sampling sites in the Weser river basin [Citation18]. Sampling campaigns for the Rhine river basin, also including 13C of dissolved inorganic carbon (DIC), were published by Buhl et al. [Citation2]. Many other research institutes in Germany collect and analyse stable isotope data, and recently an initiative was initiated that aims to connect all different isotope laboratories into a German Isotope Network (GIN) to enable continuous monitoring of precipitation, river and groundwater for tritium and stable isotopes.
With a continuous monitoring of up-to-date 29 precipitation and 50 surface water stations (one station per 12,331 and 7152 km2, respectively), GIN is currently probably one of the densest active national water isotope networks. Time scale aspects, spatial (lateral) distribution and area coverage of stations in a network play a fundamental role in isotope investigations and representation of characteristics of a countrywide network. In comparison to other countries and regions, in Germany these aspects are highly variable. For large-scale basins, usually, numerous different authorities are responsible for infrastructure maintenance and sampling, often performed under different standards and regulations. For an appropriate characterization of large-scale patterns, handling a growing amount of logistics and information is necessary. The most obvious restrictions for properly assessing large-scale hydrological processes are limited data resolution and availability of only short observation periods. For river basins, continuous long-term series of stable isotopes, especially of high time resolution, are still rather rare. There are already longer-term daily streamflow isotope records for smaller experimental catchments, but less so for large rivers. Precipitation is usually collected on a monthly basis, but can nowadays be sampled at higher resolution (event based, daily, or even higher), because laboratory capacities are extending [Citation19,Citation20]. Even in situ atmospheric vapour monitoring is becoming more feasible with new techniques. For river water, daily time series are still labour intense (sampling), and therefore long-term monitoring resolution is often on weekly or monthly base.
The aim of this work is (I) to summarize the currently available stable isotope time series for large rivers in Germany and to introduce the objectives of the GIN initiative. Further, (II) to exemplify river isotope patterns in Germany using data of some of the stations in comparison to earlier work [Citation16–18]. We also aim (III) to discuss data analysis related to time series and climate change impacts and to (IV) demonstrate potentials of higher resolution sampling (space and time) of 2H and 18O patterns as well as (V) to highlight challenges of long-term continuous sampling and endorse the importance of nation-wide networks for isotopes in rivers.
2. Overview of major German river basins and GIN river stations
Structuring river basins according to long-term yearly mean discharge (MQ) at national borders, the largest rivers in Germany are the rivers Rhine, Danube, Elbe, Odra, Weser and Ems [Citation21]. The rivers Rhine, Elbe, Weser and Ems drain into the North Sea, the Odra into the Baltic Sea and the Danube into the Black Sea (, ). All rivers differ in discharge regime, catchment size, catchment altitude and stream length. In addition to precipitation input, all these parameters indirectly influence the stable isotope patterns observed in river water. Below, a short summary table of the river basins is given, following comparative statistics provided by BMU/HAD [Citation21] for the hydrological period 1961–1990. More detailed hydrological information on the German river basins are given e.g. by [Citation2,Citation17] or via the online information platform UNDINE (www.undine.bafg.de) provided by the BfG.
Figure 1. Location of stations for precipitation (circles, colour codes indicate responsible institute), river water (blue triangles) continuously sampled and analysed for isotopes (2H, 3H, 18O) within the German Isotope Network (GIN) and meteorological Stations Koblenz-Andernach and Potsdam.
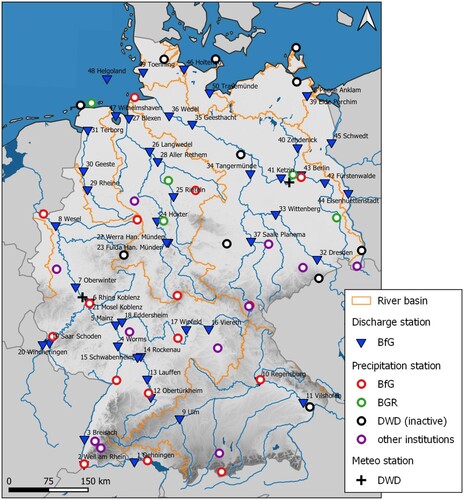
Table 1. Compilation of main characteristics of major river basins in Germany [Citation21].
Coordinates and elevation as well as mean catchment elevation (E), mean catchment area (A) and river length (L, in km distance to the sea) of each GIN river station are shown in . It has to be mentioned that many canals connect the river basins in northern and southern Germany (e.g. Rhine–Main–Danube canal, North-Sea Baltic-Sea canal, Weser–Elbe canal). Although canals are in direct exchange with river water, to our experience the influence on river isotope patterns by canals is of minor importance, because canals are separated by watergates and often also from groundwater by concrete.
Table 2. River basin, sampling site, WMO code and coordinates, of all 50 river water sampling stations of the German Isotope Network (GIN) as well as approximated catchment area (A), mean catchment altitude (E), flow length (L), mean discharge (MQ) and sampling period (T), number of samples analysed (N), mean stable isotope values with standard deviations and regression parameters for river water lines (RWL).
The coastal stations Wilhelmshaven, Helgoland, Tönning, Travermünde (all North Sea coast) and Holtenau (Baltic Sea) (stations 46–50) are also monitored within GIN. All these stations but also the stations Blexen at the outlet of the Weser basin (station 27) and Wedel at the outlet of the Elbe (station 36) are influenced by seawater and especially for the North Sea stations by coastal tides.
3. Climate
Climate conditions in Germany are highly variable from the alpine regions in the south to the maritime coast in the northern part. Generally, climate conditions are humid and temperate with long-term yearly mean temperatures of 8.2 °C and yearly precipitation of 789 mm yr–1. In the highlands of the southeast catchment, the climate is more continental with temperatures averaging from 16 °C in July to –3 °C in January. Here, annual precipitation averages 1000 mm yr–1, reaching local maxima of 1600 mm yr–1 in the mountains. The northern lowlands have a marine climate type with average temperatures of approximately 17 °C in July and near 2 °C in January. Precipitation usually varies between 600 and 850 mm yr–1 [Citation22]. The year 2018 in Germany was an extraordinary year in comparison to the long-term records of the German Weather Service (DWD). It was the warmest (10.4 °C), driest (590 mm yr–1) and sunniest (2020 h) year since the beginning of records in 1881. According to DWD, the months from April to November all classify as warmer, dryer and sunnier (long-term mean for Brandenburg is 1634 h) as prior years recorded.
4. Methods
At all river stations monthly discharge-amount weighted river water samples were collected by the BfG. Routine sampling procedures for discharge were described by [Citation16,Citation17]. Mixed daily subsamples are collected using automatic samplers (SP III-XY-36, Maxx Mess- und Probenahmetechnik GmbH, Germany), as 30 min/50 ml subsample each filled in one bottle. Daily samples were subsequently accumulated into monthly samples in the laboratory at the BfG and shipped to different laboratories for stable isotope measurements: Institute of Groundwater Ecology at Helmholtz Institute in Munich (HMGU), Institute for Hydrology at Freiburg University (IHF), Leibniz Institute for Applied Geophysics (LIAG) and BGR in Hannover. HMGU analysed nine stations, which were evaluated and reported by Reckerth et al. [Citation17]. Laboratory analyses conducted at IHF have been described in [Citation18]. A Thermo Fisher Delta-S IRMS connected to an equilibration unit and H-device was used for δ18O and δ2H measurements, respectively. From 2008 to 2011 samples were measured at LIAG using a Thermo Scientific Delta-Plus IRMS connected to a Gasbench and H-device. Since 2012 at BGR, either a Picarro L2120-i or L2140-i laser absorption spectrometer (LAS) was used with post-correction scheme following van Geldern et al. [Citation23]. All stable isotope values are given as δ-values in per mil (‰) against the international standard Vienna standard mean ocean water (V-SMOW, normalized to V-SMOW/SLAP scale) for water samples as defined by Equation (1),
(1)
(1) where RSA (−) denotes the isotope ratio of 2H/H or 18O/16O of a sample and RST (−) of the standard respectively. Because water samples were analysed at different laboratories, using different analytical methods over a long period, we follow recommendations by Halder et al. Citation2015 [Citation11] in assuming an analytical error up to ±0.2 ‰ for δ18O and ±2.0 ‰ for δ2H. For LAS measurements, high contents of dissolved organic carbon (DOC) can cause problems because of potential interference with the used water absorption bands. Usually a data correction software flags samples with high DOC interference for repetition or discard, which approximately was the case for less than 0.5 % of the samples.
Daily precipitation height (mm), monthly sum of daily precipitation height (mm) and monthly mean of daily temperature means at 2 m height (°C) for weather stations Andernach-Koblenz and Potsdam are derived from DWD provided at the Climate Data Center (CDC) internet site [Citation22]. The two selected climate stations intent to represent local differences between the German Rhine basin and the northern part of Germany. Because of the extraordinary dry summer and autumn season of 2018 and lowest records for water levels of all German rivers, such low-flow situations provide unique information on base flow composition. Therefore daily samples were collected at six stations of the Rhine (Breisach, Weil am Rhein, Worms, Koblenz, Koblenz-Mosel, Wesel) and five stations of the Elbe (Dresden, Wittenberg, Tangermünde, Geesthacht, Wedel) basin.
5. Results
5.1. Long-term isotope patterns
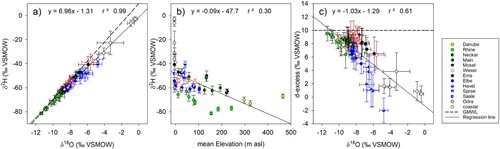
Long-term mean δ18O, δ2H and d-excess values with variabilities given as standard deviations of all 50 GIN stations are summarized in and . At least four years (some stations from 2018 to 2021) but up to 30-year observations are available. In general, the stable isotope values cluster according to river basins (see different symbols and colour sheme of online version in ) and the δ-values get more negative with increasing mean catchment altitudes. For stations in northern Germany a downward shift from the global meteoric water line (GMWL) is visible because of increasing evaporation and mixing with seawater, e.g. for coastal stations Blexen in the Weser basin, Travemünde, Tönning, Holtenau and Helgoland (which is an island station) ((a)). (b) shows δ2H values against mean catchment altitude. The three Danube stations (yellow symbols) have the highest mean altitudes above 300 m but do not show the lowest δ-values. The stations of the Rhine River do not explicitly follow an altitude trend. Öhningen, right after Lake Constance and upstream of the contribution of the Aare River, has the most negative δ-values of all German river stations. The station at Breisach shows lower mean δ2H values than the station Weil am Rhein, which has a higher mean altitude. This could be due to river input from Black Forest or groundwater contribution from the upper Rhine valley. An overall regression line for δ2H versus altitude shown in (b) indicates a slope of −0.09 and an intercept of −47.7 when using all stations, and a slope of −0.05 and intercept of −54.1 when ignoring the coastal (sea water) influence with a slightly better correlation of R2 0.30 ((b)). Plotting d-excess vs. δ18O ((c)) the northern German basins differ from the southern (alpine) basins because of influence of sea water for the coastal stations and evaporation induced lower d-excess values. The stations in northeast Germany probably also reflect impacts of an increasing continental effect.
Figure 2. Long-term mean values and variability (given as standard deviation) for (a) δ2H vs. δ18O values, (b) δ18O values vs. mean catchment elevation and (c) d-excess vs. δ18O values of large rivers in Germany.
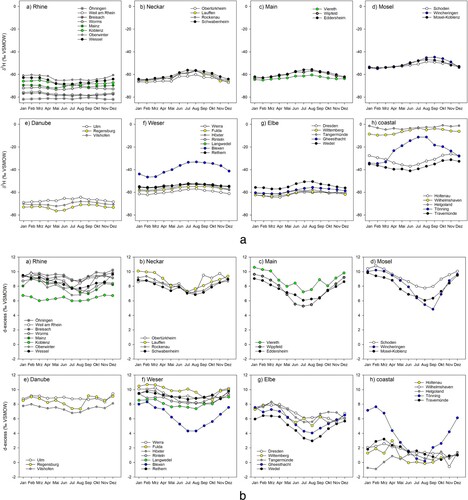
Long-term mean monthly δ2H and d-excess values for most of the GIN stations are compared in . The δ2H patterns reflect seasonal variation and an altitude effect as well as consecutive mixing with contributing tributaries. Pluvial discharge regimes have lowest δ2H and highest d-excess values in winter like it is found in precipitation; for pluvio-nival discharge regimes, those minima/maxima shift to spring or even summer. Therefore, alpine basins show lowest δ-values in summer, the basins draining the lower mountains in the middle and northern Germany show lowest values in winter. For the Rhine stations ((a)) the alpine stations have lower δ2H values (between −75 and −85 ‰) than the more northern basins Neckar and Main (between −50 and −70 ‰) and the Mosel (between −40 and −60 ‰). In addition, the Weser River stations expose a mixing from higher altitude basins Fulda and Werra and in the lower part by contributing water from the Aller basin ((f)). The more positive δ-values and higher amplitudes of the most northern station in the Weser basin at Blexen are caused by the influence of seawater during tides.
Figure 3. Long-term mean monthly δ2H values (upper panel) and calculated d-excess values (lower panel) for (a) Rhine (b) Neckar (c) Main (d) Mosel (e) Danube (f) Weser (g) Elbe and (h) coastal stations.
An interpretation of long-term trends of δ18O composition and d-excess patterns is shown in . For the longest time-series of the Rhine basin at station Lustenau in Austria and Koblenz in Germany as well as for the rivers Neckar at Schwabenheim and Mosel at Koblenz, 12-point-running mean values are shown in comparison to monthly samples in (a). In (b) d-excess values are shown for the same stations, calculated when both δ18O and δ2H values are available. (c) shows d-excess time series starting in 2003 for comparison.
Figure 4. Long-term monthly time series at stations Lustenau/Rhine, Schwabenheim/Neckar, Koblenz/Mosel and Koblenz/Rhine for (a) δ18O and (b) d-excess values including 12-points running mean patterns (as thicker lines). Shorter time series are show in (c) as 12-points-running mean patterns of d-excess for stations at Danube, Main, Weser, Elbe and Odra basin for comparison.
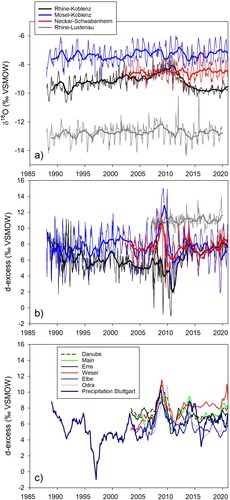
Comparing the long-term 12-point running mean values of δ18O and d-excess values indicate temperature or climate-related impacts. The δ18O values in (a) indicate rising trends until 2010 and decreasing values from 2010 to 2015 followed by a slow rise from 2015 to 2018 for the Rhine station. The Weser at Intschede indicates decreasing values from 2002 to 2006 and three negative peaks in 2006, 2011 and 2014. The running mean values smooth out most of the seasonality that is visible for almost all river stations in Germany.
5.2. Short-term isotope patterns
Short-term isotope patterns of selected German rivers are presented in . After an extraordinary warm and dry summer in 2018 with only minor rain events starting in October, discharge was on record lows until the beginning of December ( upper panel). The isotope values given as a 4-day running mean aim to exclude analytical noise. In the Rhine basin on the left-hand side, δ2H values tend to smoothly decline until the beginning of December at all given stations when larger rainfall occurred. The Mosel River (yellow circles) shows a steeper decline and a less pronounced rise probably due to different weather conditions. The Elbe basin on the right-hand side also shows a declining δ2H pattern until the end of January 2019 and different behaviour for the two stations Geesthacht and Wedel, which is most likely caused by tides. The d-excess series of both basins show rising trends, which either reflect enhanced groundwater contribution or seasonal impacts, except Wedel station (Elbe basin) that again reflects seawater impacts.
Figure 5. Precipitation (for DWD-stations Andernach-Koblenz and Potsdam [Citation22]) and discharge patterns (for BfG stations at Koblenz, Rhine and Tangermuende, Elbe) and δ2H and d-excess values of high-temporal and monthly resolution following the very dry and low-flow summer/autumn period from October 2018 to end of January 2019 at stations of the Rhine and Elbe basins.
![Figure 5. Precipitation (for DWD-stations Andernach-Koblenz and Potsdam [Citation22]) and discharge patterns (for BfG stations at Koblenz, Rhine and Tangermuende, Elbe) and δ2H and d-excess values of high-temporal and monthly resolution following the very dry and low-flow summer/autumn period from October 2018 to end of January 2019 at stations of the Rhine and Elbe basins.](/cms/asset/f89f469f-b7b5-4cfb-ab63-a35c1511c74a/gieh_a_2127702_f0005_oc.jpg)
6. Discussion
6.1. Impacts on long-term stable isotope patterns
Stable isotope data, especially long time series, can be a major contribution to climate change research. The analysis and interpretation of isotope changes in river water have the potential to develop similar importance for the study of short-medium-term effects of climate change as stable isotope climate proxies have for understanding long-term paleoclimate changes. So far, only river stations with alpine catchments were interpreted for climate change signals and changes were attributed to increasing environmental temperature along the moisture transport path and decreasing snow covers. For example, stable isotope patterns of Danube river water were interpreted from more than 50-year-long data series at Vienna station by Wyhlidal et al. [Citation12]. However, for high-altitude catchments also glacier recession might contribute to river isotope patterns. In Germany, the longest time series are from the stations Koblenz at the Rhine River and the Mosel River, both starting in 1988. In , the seasonal pattern of each station (thin lines) is overprinted by 12-point running means (thicker lines) and is shown in comparison to the stations Schwabenheim (Neckar) and Lustenau (Rhein). Similar comparisons were shown including the station Lustenau [Citation12]. The Danube δ18O series showed a rising trend until 2009 and a decrease of about 0.5 ‰ between 2010 and 2015 [Citation12] which is comparable with the observations at the alpine Rhine stations. In contrast to data from the Danube basin in Austria, the Rhine series do not show a clear climate trend. The almost 20-year time series of the seven stations in the Weser River basin do not show an explicit climate trend either, most likely because the catchment area of the Weser does not include higher altitude glacial dominated regions. The other GIN time series that are starting in 2015 and 2018 are probably too short for an interpretation of climate change impacts. There is no clear explanation yet for the unexpected isotope and d-excess patterns in 2009–2012 for most of the German river stations available at that time ((c)). We do not see these patterns in the data sets of Austria and Switzerland. Therefore, for the Rhine basin, a reason could be attributed either to the Upper Rhine Valley or to large-scale meteorological patterns, as shown in other studies [Citation14]. δ18O precipitation data for 2010 are lower than the long-term mean values, most likely due to a lower NAO-Index. This is not yet proven but further highlights that a research need to understand such large-scale patterns. If trends of drier years will continue, longer stable isotope time series of river water will be powerful for an interpretation of changing precipitation patterns and groundwater contribution to river water.
6.2. Patterns related to general isotope effects in precipitation
The typical isotope effects in precipitation (seasonality, altitude, continental) can be detected in the river water at all German stations, dampened and with a temporal offset, making it an important tool for studying hydrological and hydro-ecological processes, as shown in many other studies [Citation12–15,Citation17,Citation18,Citation24–28]. Seasonal patterns with different amplitudes for each station are visible for most rivers, especially for the Mosel, Main, Neckar and Weser basins ((a–h)). For stations influenced by alpine meltwater, often an opposite phase is visible with values that are more positive in winter and more negative in summer (e.g. station Weil am Rhein, in southern Germany). All other time series indicate seasonality with lower values in late winter and similar to the seasonality of precipitation. An altitude effect is characterizing all German river stations. Stable isotopes are the most robust proxies for recharge altitude estimations of springs or river stations (mean basin altitude). Altitude effects are visible for basins through clusters in . Contributing tributaries e.g. Neckar, Main and Mosel for the Rhine basin ((a–d)) and Fulda, Werra and Aller for the Weser basin ((f)) demonstrate consecutive mixing and overprinting of river altitude signals. For the Weser basin, the influence of seawater mixing during tides is visible at the Blexen station. Evaporation influence and lower d-excess values correlate with stream length and distance from the coast because river water evaporation is enhanced with increasing flow distance. Notably, interference and overlapping occur for all stable isotope effects at variable magnitude for most river stations.
6.3. Higher resolution sampling of river water stable isotopes during a dry period in 2018
During extended periods with low flow conditions, river water isotopes are expected to not follow the long-term seasonal patterns and can be influenced by higher contributions from groundwater or lack of precipitation of a specific season. For the Adige catchment in Italy, it was shown that the drought in 2017 led to higher δ-values due to a lack of fall and winter precipitations throughout the entire catchment [Citation29]. For other regions, δ-values can be more negative if groundwater contributions are dominating and if the groundwater is recharged mainly by winter precipitation. Short-term (daily) patterns over a period of four-months for six stations from the Rhine and Elbe basin shown in reflect groundwater influence for the investigated areas. The summer and autumn of 2018 were extremely dry, and there was little rain in September, October and November 2018. The general decreasing trends are similar for all Rhine stations and similar for the Elbe stations because of draining out of all fast water components in the catchments and an increase of older (more negative) groundwater. A one-year series for daily δ18O values for 2012 was published by Wyhlidal [Citation12], taken from the Danube at station Tulln close to Vienna. This data set correlates well with monthly values of the same station and allowed a more detailed interpretation of snowmelt, precipitation and base-flow influence, although 2012 was not an extraordinarily dry year. The Tulln series proves that monthly values (mean values as well as grab-samples) represent long-term patterns and that high-resolution sampling is of additional benefit for in-depth interpretations.
6.4. Potentials of strong national isotope networks
Many studies showed how spatial river water patterns (in comparison to e.g. precipitation, drinking water) and spatial mapping of isotope concentrations ‘isoscapes’ for river water and groundwater are of large interdisciplinary value. In Germany, stable isotope data is available for some rivers since the beginning of 2000 [Citation17,Citation18]. In addition, the currently monitored river stations serve as basis for basin-wide modelling and mapping approaches. Including isotopes into large-scale modelling allows a calibration and validation of existing models and improves physically based (hydrological and hydrogeological) models. Stable isotopes were implemented into atmospheric circulation and regional hydrological models (e.g. [Citation30–33]). However, the implementation of river water stable isotope values into large-scale hydrological and hydrogeological models is still rare. This is probably because stable isotope series of rivers and groundwater are often not available on higher resolution in space and time.
Beside global initiatives for monitoring isotopes in precipitation and surface water that started already in the 1960s and 2012, respectively [Citation34], several governmental networks exist e.g. in Austria (ANIP) [Citation12], the USA (USNIP) [Citation14], Switzerland (NISOT) [Citation15] and Canada (CNIP) [Citation34]. Monitoring of these networks is ongoing and for some countries performed on consultant contracts. In Germany, a continuous sampling and observation of tritium concentrations (and other radioactive isotopes in water, suspended matter and sediments) have been conducted since the 1970s within a federal task to monitor environmental radioactivity, funded by the government and conducted by BfG. The analysis of water stable isotopes has mainly been voluntarily by individual research groups. Within a new initiative, it is foreseen to organize an isotope network by cooperation with several partners. So far, there has been no organized approach to ensure long-term continuous observations of isotopes (3H, 2H, 18O and possibly others) together with hydro-chemical and other hydro-meteorological parameters in Germany. Today about 30 precipitation stations and 50 river stations mainly co-organized by BfG, DWD and HMGU recently published by Schmidt et al. [Citation16] as well as German universities, research institutes and companies contribute to the network. This eventually allows a compilation of continuous and higher resolution isotope data as database for different disciplines such as hydrology, hydrogeology, meteorology, ecology, environmental and health sciences as well as interdisciplinary studies and future modelling approaches. At the same time, further challenges and benefits of such an observation network would be that sample loads are carried on more laboratories, which would allow monitoring of higher resolution (time and space). It allows developing and adapting best sampling strategies and optimizing analytical and post-analytical methods (e.g. weighing procedures) of participating stations and labs. Laboratory cross checks and comparison tests could improve long-term analytical performance [Citation35,Citation36]. Within an established sampling network like GIN, additional side studies and additional parameters (other isotopes) preferably with a long-term focus are easy to implement. Of course, data of all German stations will contribute to strengthen the already established networks such as GNIR and GNIP.
For a new design of a national river isotope network, from our experience we would recommend to add isotope-sampling sites to as many as possible already existing discharge stations. A national river isotope monitoring network should ideally be designed for a long-term observation (>5 years) to obtain valuable time series. All major rivers should be covered by several sampling stations. Sampling should be done on a monthly or at least quarterly basis to capture seasonal effects. Sampling and maintenance should be self-sufficient and as low as possible to minimize supervision required per station; analytical capabilities should be planned ahead to minimize sample storage requirements. Often, national monitoring programmes exist already for other purposes (water quality and quantity measurements) or organized by state authorities that could be used to jump on.
7. Conclusion
Stable isotope time series of river water from 50 stations in Germany are available from at least January 2018 and planned to continue into the future. The time series reflect altitude, seasonal and continental effects similar to precipitation but influenced and overprinted by time delayed meltwater of alpine glacier and snow inputs for the alpine basins and enhanced groundwater signals in the northern basins. In northern Germany, an increasing influence of evaporation (negative d-excess values) and seawater signals (tides) is visible. Indications of climate change impacts on river water, as shown for Austrian rivers, are not visible from German stations, probably because most of the time series are not yet long enough. However, d-excess anomalies might be due to local or regional climate patterns. Daily observations in the very dry autumn in 2018 and winter of 2019 reflect base flow values and indicate groundwater contributions for some river basins. Because global initiatives mainly rely on contributions by national networks, we think that networks funded and established country or region-wide could enhance understanding of our environment by providing long-term stable isotope patterns. We urge to actively connect all interested isotope laboratories into networking, by comparing analytical performance and collectively collecting and providing these important measurements. This would allow improving analytical performance and sharing sample load within the network but most of all ensuring continuous observations on most representative spatial resolution.
Acknowledgements
All colleagues at BfG for sampling activities and Annika Linkhorst for their support preparing data sets for . Thanks to Christian Birkel and an anonymous reviewer for helping to improve this manuscript.
Disclosure statement
No potential conflict of interest was reported by the authors.
Additional information
Funding
References
- Fritz P. River waters. In: Gat JR, Gonfiantini R, editors. Stable isotopic hydrology: deuterium and oxygen-18 in the water cycle. Vienna: International Atomic Energy Agency; 1981. p. 177–201. (IAEA Technical Report Series; 210).
- Buhl D, Neuser RD, Richter DK, et al. Nature and nurture: environmental isotope story of the River Rhine. Naturwissenschaften. 1991;78:337–346.
- Gibson JJ, Aggarwal PK, Hogan J, et al. Isotope studies in large river basins: a new global research focus. EOS, Transactions American Geophysical Union. 2002;83(52):613–617.
- Aggarwal PK, Alduchov O, Araguás Araguás L, et al. New capabilities for studies using isotopes in the water cycle. Eos Trans AGU. 2007;88(49):537–538.
- Craig H. Isotopic variations in meteoric waters. Science. 1961;133(3465):1702–1703.
- Rozanski K, Araguás-Araguás L, Gonfiantini R. Isotopic patterns in modern global precipitation. In: Swart PK, Lohmann KC, Mckenzie J, Savin S, editors. Climate change in continental isotopic records. Washington, DC: American Geophysical Union; 1993. p. 1–36. (Geophysical Monograph Series; 78).
- Terzer S, Wassenaar LI, Araguás-Araguás LJ, et al. Global isoscapes for δ18O and δ2H in precipitation: improved prediction using regionalized climatic regression models. Hydrol Earth Syst Sci. 2013;17(11):4713–4728.
- Stumpp C, Klaus J, Stichler W. Analysis of long-term stable isotopic composition in German precipitation. J Hydrol. 2014;517:351–361.
- Klaus J, Chun KP, Stumpp C. Temporal trends in δ18O composition of precipitation in Germany: insights from time series modelling and trend analysis. Hydrol Process. 2015;29(12):2668–2680.
- Vitvar T, Aggarwal PK, Herczeg AL. Global network is launched to monitor isotopes in rivers. Eos Trans AGU. 2007;88(33):324–326.
- Halder J, Terzer S, Wassenaar LI, et al. The global network of isotopes in rivers (GNIR): integration of water isotopes in watershed observation and riverine research. Hydrol Earth Syst. Sci. 2015;19(8):3419–3431.
- Wyhlidal S, Rank D, Schott K, et al. Analysis of isotopic signals in the Danube River water at Tulln, Austria, based on daily grab samples in 2012. Isot Environ Health Stud. 2014;50(4):448–460.
- Kendall C, Coplen TB. Distribution of oxygen-18 and deuterium in river waters across the United States. Hydrol Process. 2001;15(7):1363–1393.
- Welker JM. ENSO effects on δ18O, δ2H and d-excess values in precipitation across the U.S. using a high-density, long-term network (USNIP). Rapid Commun Mass Spectrom. 2012;26(17):1893–1898.
- Schotterer U, Schürch M, Rickli R, et al. Wasserisotope in der Schweiz. Neue Ergebnisse und Erfahrungen aus dem nationalen Messnetz ISOT [Water isotopes in Switzerland. Latest findings of the National ISOT Network]. GWF Wasser Abwasser. 2010;90:1073–1081. German.
- Schmidt A, Frank G, Stichler W, et al. Overview of tritium records from precipitation and surface waters in Germany. Hydrol Process. 2020;34(6):1489–1493.
- Reckerth A, Stichler W, Schmidt A, et al. Long-term data set analysis of stable isotopic composition in German rivers. J Hydrol. 2017;552:718–731.
- Koeniger P, Leibundgut C, Stichler W. Spatial and temporal characterization of stable isotopes in river water as indicators of groundwater contribution and confirmation of modelling results; a study of the Weser river, Germany. Isot Environ Health Stud. 2009;45(4):289–302.
- Munksgaard NC, Zwart C, Haig J, et al. Coupled rainfall and water vapour stable isotope time series reveal tropical atmospheric processes on multiple timescales. Hydrol Process. 2019;34(1):111–124.
- Stevenson JL, Birkel C, Neill AJ, et al. Effects of streamflow isotope sampling strategies on the calibration of a tracer-aided rainfall-runoff model. Hydrol Process. 2021;35(6):e14223.
- BMU. Hydrologischer Atlas von Deutschland (HAD); 2003. German.
- DWD Climate Data Center (CDC). Recent monthly and daily station observations (precipitation, temperature) for Germany, quality control for recent data not completed yet, version recent, last accessed: 06/09/2019.
- Van Geldern R, Barth JAC. Optimization of instrument setup and post-run corrections for oxygen and hydrogen stable isotope measurements of water by isotope ratio infrared spectroscopy (IRIS). Limnol Oceanogr Methods. 2012;10(12):1024–1036.
- Miljević N, Golobočanin D, Ogrinc N, et al. Distribution of stable isotopes in surface water along the Danube River in Serbia. Isot Environ Health Stud. 2008;44(2):137–148.
- Ogrinc N, Kanduč T, Stichler W, et al. Spatial and seasonal variations in δ18O and δD values in the River Sava in Slovenia. J Hydrol. 2008;359(3-4):303–312.
- Kattan Z. Estimation of evaporation and irrigation return flow in arid zones using stable isotope ratios and chloride mass-balance analysis: case of the Euphrates River, Syria. J Arid Environ. 2008;72(5):730–747.
- IAEA. Monitoring isotopes in rivers: creation of the global network of isotopes in rivers. Vienna: International Atomic Energy Agency; 2012. (IAEA-TECDOC-1673).
- Laonamsai J, Ichiyanagi K, Patsinghasanee S. Isotopic temporal and spatial variations of tropical rivers in Thailand reflect monsoon precipitation signals. Hydrol Process. 2021;35:e14068.
- Chiogna G, Skrobanek P, Sheikhy Narany T, et al. Effects of the 2017 drought on isotopic and geochemical gradients in the Adige catchment, Italy. Sci Total Environ. 2018;645:924–936.
- Hoffmann G, Jouzel J, Masson V. Stable water isotopes in atmospheric general circulation models. Hydrol Process. 2000;14(8):1385–1406.
- Sturm K, Hoffmann G, Langmann B, et al. Simulation of δ18O in precipitation by the regional circulation model REMOiso. Hydrol Process. 2005;19(17):3425–3444.
- Stadnyk TA, Delavau C, Kouwen N, et al. Towards hydrological model calibration and validation: simulation of stable water isotopes using the isoWATFLOOD model. Hydrol Process. 2013;27(15):3791–3810.
- IAEA/WMO. Global Network of Isotopes in Precipitation. The WISER Database. Available from: http://isohis.iaea.org. 2020.
- Gibson JJ, Holmes T, Stadnyk TA, et al. 18O and 2H in streamflow across Canada. J Hydrol Reg Stud. 2020;32:100754.
- Wassenaar LI, Terzer-Wassmuth S, Douence C, et al. Seeking excellence: an evaluation of 235 international laboratories conducting water isotope analyses by isotope-ratio and laser-absorption spectrometry. Rapid Commun Mass Spectrom. 2018;32(5):393–406.
- Wassenaar LI, Terzer-Wassmuth S, Douence C. Progress and challenges in dual- and triple-isotope (δ18O, δ2H, Δ17O) analyses of environmental waters: An international assessment of laboratory performance. Rapid Commun Mass Spectrom. 2021;35(24):e9193.