
ABSTRACT
Characterization of the groundwater flow systems is important for sustainable water resource management decision-making. We have used vertical profiles of electrical conductivity (EC) and water temperature taken at 2 m intervals during drilling of 109 boreholes, and samples for stable isotope analysis (δ18O, δ2H) taken from 47 boreholes to characterize groundwater recharge, flow and discharge. 222Rn measurements and piezometric evidence were used to complement results from the EC and stable isotopes. The converging evidence shows that groundwater in the study area is characterized by a mix of two different groundwater flow systems: i) the deep groundwater systems are connected to the regional groundwater flow originating from the highlands, outside the surface water basin, ii) the shallow groundwater systems get recharge from local rains. The local recharge zones are located in highly urbanized and industrialized zones posing risk to recharge reduction and pollution. Therefore, attention should be given to protect groundwater resources from contamination and increase groundwater resilience to climate change.
1. Introduction
Proper characterization of groundwater flow systems must be used as an important basis for sustainable water resource management decision-making. Groundwater flow is characterized by hierarchically nested groundwater flow lines representing local, intermediate (sub-regional), and regional flow systems [Citation1]. Passing through interconnected cracks and pore spaces of geological materials-aquifers [Citation2,Citation3], groundwater can move from a few meters (local flow) to hundreds of kilometers (regional flow) [Citation4]. Many authors explained the different dynamics of how groundwater moves in different geological settings [Citation1,Citation5–11]. More generally, the shallow groundwater flows and discharges to local wetlands and streams. Whereas, deeper groundwater travels long distances and feeds the wetlands and rivers far downstream from its source [Citation4]. Most hydrological and hydrogeological models are designed based on such characterization of the groundwater flows. In many instances, catchments are considered self-contained systems with the groundwater basin having similar catchment as the corresponding surface water divide [Citation12].
Aquifers in arid and semi-arid regions of the world derive a significant portion of their recharge from adjacent mountains either through stream infiltration in the mountain front zone or from subsurface flow from the bounding highlands [Citation13]. Understanding mountain recharge systems in terms of distinguishing between mountain front (local recharge system) and mountain block recharge (regional recharge system) is important to conceptualize and manage groundwater resources in the mountain-bounded basins [Citation13–19].
The study area is the upper and middle Awash River sub-basins in central Ethiopia. The Awash River basin is the most utilized, urbanized, and populated river basin [Citation20,Citation21]. It accommodates major urban settlements, small to large-scale irrigation schemes, and industrial zones. Together with surface water abstraction for irrigation, groundwater is the main water supply source for industries, urban and rural communities, and irrigation [Citation22].
The Awash River basin is located in the tectonically active Main Ethiopian Rift (MER). The hydrology of the basin is complex due to dense cross-cutting lineaments [Citation23,Citation24]. The physiography of the basin comprises a plateau, escarpment, and rift [Citation25]. It is also characterized by complex stratigraphy with pre-rift plateau basalts, Addis Ababa basalt, Nazareth Series volcanics, Quaternary basalts, and post-rift domes (Wechecha, Furi Trachytic, and Rhyolitic domes and Entoto, Becho Rhyolites) [Citation26,Citation27] one coming over the other. The Nazareth Series volcanic is an interfingering of basalts and ignimbrites and is the most widespread formation in the basin.
Conceptualization of the groundwater flow system has been done in the Awash River basin [Citation23–25,Citation28–30]. There is a regional groundwater system that extends from the plateau towards the rift through structurally controlled conduits or hydrologic windows [Citation23]. Regardless of the geological complexity of the region, studies tend to simplify the conceptualization by categorizing the aquifer systems into upper and lower basaltic aquifers [Citation24].
Based on the assumption that the groundwater supply wells are fed by regional groundwater flow originating from recharge in the highlands, and therefore groundwater is resilient to climate variations, more and more groundwater exploration has been done to supply the ever-increasing population growth and industrialization mainly in the upper Awash sub-basin. More than 300 boreholes have been drilled in this area for the municipality, irrigation, industries, and different private owners under a government-promoted self-supply policy. Among these, in Addis Ababa city, Akaki, South Ayat, Legedadi, and Sebeta Tefki well fields (located in the upper Awash sub-basin), deep boreholes were drilled to supply Addis Ababa city [Citation31]. In Becho plain (located in the upper Awash sub-basin), and Alliadege plains (located in the middle Awash), deep boreholes were drilled to supply large-scale irrigation schemes [Citation32].
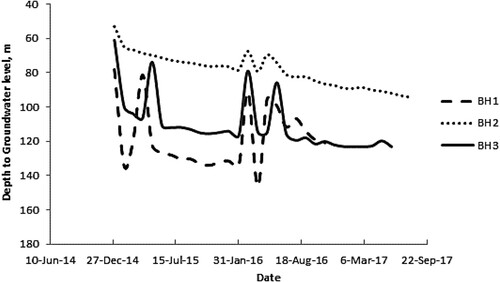
Based on most of the aforementioned studies, the Akaki well field is recharged by subsurface groundwater inflow from the highlands. The rapid decline in groundwater level as also observed by [Citation28] in the major well fields (e.g. Akaki well field) evokes the need to revisit the conceptual model of groundwater flow in the region. Large drawdowns are observed in several solitary boreholes and well fields. As shown in , some of the boreholes in well fields around Addis Ababa show water level decline exceeding 30 m. The rapid groundwater level decline has also led to the abandonment of the old Akaki well field or the deepening of the boreholes to reach the new dynamic water level. This by itself necessitates the need for an in-depth understanding of the groundwater flow dynamics with particular emphasis on groundwater recharge sources, aquifer storage and size, interconnectivity between the various aquifers, and groundwater discharge processes in the region.
Figure 1. Water level decline in three boreholes in the Akaki well field supplying the city of Addis Ababa.
The purpose of this study is to characterize the groundwater flow system using converging evidence from the use of environmental tracers. In this work stable isotopes of water molecules (2H and 18O), electrical conductivity (EC), temperature, and the radioactive isotope 222Rn were used together with piezometric evidence. This study intends to generate important information for the sustainable utilization of groundwater resources for different competing users in the upper and middle Awash sub-basins. It will inform the ongoing groundwater flow modeling works [Citation22]. The study further aims to delineate recharge zones and their protection. Furthermore, this study will add a new perspective to show the importance of in-depth analysis of the groundwater system through vertical profiling of EC, temperature and isotope analyses for a better characterization of the groundwater flow system.
2. Materials and method
2.1. Study area
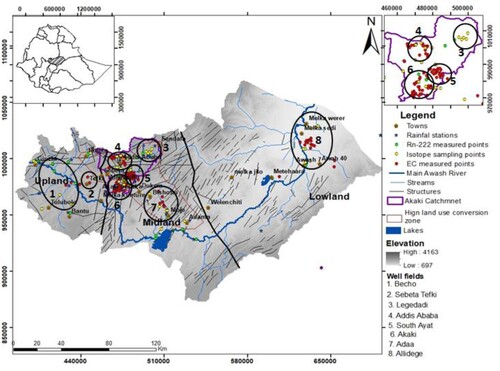
The Awash River basin is the fourth largest and most-utilized river basin in Ethiopia, with total areal coverage of 110,000 km2 [Citation20,Citation33]. The focus of this study, the upper and middle Awash River sub-basins are located within the geographic coordinate of 385663–694245 Easting and 872041–1068839 Northing, with total aerial coverage of about 30,000 km2 (). More focus is given to the shallow and deep groundwater systems of the upland (Becho area) and the midland (Legedadi, Addis Ababa, South Ayat, Akaki, Ada’a (Bishoftu and Mojo)) regions. To check the consistency of the analysis, additional samples were analyzed from further downstream at the lowland (Alliadege plain) ().
Figure 2. Location map of the research area (upper Awash sub-basin from Ginchi to Koka reservoir, middle Awash sub-basin from downstream of Koka to Melka Werer).
The physiography is characterized by plateau, rift escarpment, and rift floor with elevation ranging from 697 to 4163 m a.s.l. The rainfall pattern is dominantly bimodal in nature with the highest rainy season starting in July and extending to September while the light rains occur from March to May. Fifteen years of meteorological data (2000–2015) compiled from eighteen stations () show the average annual rainfall and temperature of the upland area is 1037 mm and 15 °C, the midland area is 952 mm and 19.3 °C and the lowland area is 761 mm and 23.63 °C, respectively.
The land use and land cover in the Awash River basin is mainly characterized by farmland, forest cover, shrubland, grassland, and built-up areas. Rapid land use and land cover change strongly affect water resources, especially in regions that experience seasonal water scarcity [Citation34] like the Awash River basin. Rapid land use and land cover change is observed mainly in the upper Awash River sub-basin due to rapid expansion of urbanization, population growth, and development of industrialization. According to [Citation35], built-up areas in the Awash River basin have increased by 225 % from 1988 to 2018 at the expense of forest and shrubland. A higher level of deforestation combined with population growth, urbanization, and cropland expansion has impacted the available water resources in the area. shows the highly converted regions from farmland to urban settlements and industrial zones. According to FAO, the area is covered by clay, clay loam, sandy loam, loam, and loamy sand [Citation36]. The central part of the area is covered by clay and sandy loam clay soils. Most of the escarpments are covered by loam and sandy loam soils.
2.2. Methodology
2.2.1. Study design
We compiled, generated and used four types of datasets. The first is the vertical EC and temperature profile measured during drilling. The EC and temperature profile readings have been taken from 109 boreholes and measured at every 2 m depth interval at the time of drilling lasting between the years 2010 and 2021. The depth of the boreholes varies between 30 and 500 m. The second is the stable water isotope dataset (δ2H, δ18O) measured on 47 water supply boreholes sampled from the subset of the 109 boreholes distributed along the highland lowland altitudinal transect of the study area. The 47 borehole water samples were taken in 2021 and 2022. The third is the 222Rn measured on stream waters draining the study area. Lastly, we employed piezometric water level data constructed from the static water level information recorded at the time of drilling.
We constructed a piezometric map using ArcMap 10.8 software by taking the static water level of drilled boreholes to map the interconnection between surface water and groundwater. R programming code was used to construct the various plots.
To organize the large dataset generated on the EC and temperature profile from the 109 boreholes, we systematically organized the data to show the vertical and lateral distribution of these parameters across the highland lowland transect regrouping the boreholes into seven aquifer regions (Becho, Sebeta Tefki, Addis Ababa city, South Ayat, Akaki, Ada’a, and Alliadege) shown in . The variations in the measured parameters were investigated across the seven coherent aquifer regions. Each aquifer region is identified by its local surface water catchment. Six of the aquifer regions fall in the upper Awash Basin and one aquifer region falls distant from the six aquifer regions. The distant aquifer region, (the Alliadege well field), located in the Middle Awash Basin, was included in this analysis to investigate the presence of the regional groundwater flow discharging several hundred kilometers away from the site of recharge.
To systematically evaluate the variations in isotopic signatures in the 47 boreholes in terms of groundwater dynamics of different groundwater systems, we categorized the boreholes from which the samples have been taken into different depth and location categories. The drilling depth has been categorized as shallow (< 150 m), intermediate (150–300 m), and deep (> 300 m). Based on the locations where they are found in the basin, the boreholes were clustered into three categories (upland, midland, and lowland). Variations in isotopic composition were then investigated for the different clusters.
To investigate seasonal changes in groundwater dynamics and their connection to surface waters, the water isotope data from the 47 boreholes and the 222Rn data on stream waters were generated in two different seasons (dry and wet). We collected 47 samples in August 2021 for the wet season and 28 samples in March 2022 for the dry season.
2.2.2. Tracers
The EC and temperature parameters were used in this study because of the apparent ease of their measurement and the usefulness of these tracers in understanding groundwater flow patterns. EC and temperature are proven tracers for their significant role in understanding the groundwater flow path [Citation13,Citation37]. EC has a direct relationship with total dissolved solutes [Citation38], and an ionic concentration increases along the groundwater flow path due to rock–water interaction and long residence time. Under normal conditions, temperature increases with depth following the geothermal gradient [Citation39]. Thus EC and temperature could be good tracers for analyzing the interconnectivity between different flow paths.
Isotopes of water molecules are very useful to understand the groundwater flow system and provide information on hydrological processes and the source of groundwater [Citation40,Citation41]. For this study, the isotope ratios of hydrogen (2H/H) and oxygen (18O/16O) are used to characterize the groundwater flow system of the upper and middle Awash River sub-basins.
Radon-222 is a radioactive noble gas produced from radium-226 as part of the decay series of uranium-238 to lead-206 [Citation42]. 222Rn naturally occurs in higher concentrations in groundwater. Since its half-life is only 3.82 days and degasses when exposed to the surface, it is found in low concentrations in surface water bodies. It is the most reliable radioactive isotope to investigate surface and groundwater interconnection [Citation9,Citation42–47]. In this study, the Radon snapshot survey during the dry and wet seasons was integrated with the aforementioned tracers to investigate the connection between surface and groundwater interactions influencing the general groundwater flow system. In this regard, the 222Rn in situ measurements conducted along the main course of the Awash River and tributaries inform whether groundwater recharged in the highlands returns to the rivers or is distributed to the groundwater system downstream.
2.2.3. Sampling and analysis
Hand-held devices (HannaTM 98312) with automatic temperature compensation accompanied by daily calibration were used to measure the EC and temperature of the borehole waters during drilling.
The samples for isotope analysis were collected in 50 ml polyethylene sample bottles from the boreholes having different depths ranging from less than 30 m to more than 500 m. The H/O isotope analyses were performed at the Center for Water Resources Research laboratory, University of KwaZulu Natal, South Africa, using the Los Gatos Laser Isotope Machine DLT100. The long-term standard deviation of the laboratory is 0.2 ‰ for δ18O and 2.5 ‰ for δ2H.
The 222Rn concentration was measured at 23 points (tributary streams and main Awash River) using a RAD7 Electronic Radon Detector, fitted with a big bottle (2.5 L) system for high sensitivity (Durrige Company Inc 2020) (). The measurements were taken both during the dry season (March 2021) and the wet season (July 2021). The detection limit of the device is on the order of 40 Bq/m3. Counting is based on the principle of liquid–gas-membrane extraction [Citation48]. An extraction module, which consists of hollow vinyl fibers, allows radon stripping from the water of interest into a connected closed-air loop. The water temperature was measured to convert 222Rn in the air to 222Rn in water. The overall standard deviation varies between 15 and 20 %, higher for low radon content. Radon counting was conducted for a period of 1 h in four cycles. The first two readings were discarded and the average of the last two readings was taken as the mean 222Rn composition of the specific water point.
To augment the EC, temperature, stable isotopes and 222Rn measurements, a groundwater level contour map is produced to see the groundwater flow path and the gaining and losing segments of the river reaches. Around 330 spatially distributed groundwater level measurements were used to construct the piezometric surface using ArcMap 10.8 software with Inverse Distance Weighting (IDW) interpolation scheme. The groundwater level measurement data is a one-time static water level data of the deep boreholes taken before starting to conduct the well pump test.
3. Results
3.1. Electrical conductivity and temperature
The electrical conductivity (EC) and temperature measurements from 109 deep boreholes collected at 2 m depth intervals during drilling were plotted as a heatmap in . The average EC and temperature heatmap plots with depth were constructed based on systematically taken measurements as listed from upstream to downstream regions (Becho, Sebeta Tefki, South Ayat, Addis Ababa, Akaki, Ada’a, and Alliadege well fields).
Figure 3. Heatmap of the electrical conductivity (µS/cm) profile. The numbers in the brackets indicate the number of boreholes from which the vertical profile records were taken.
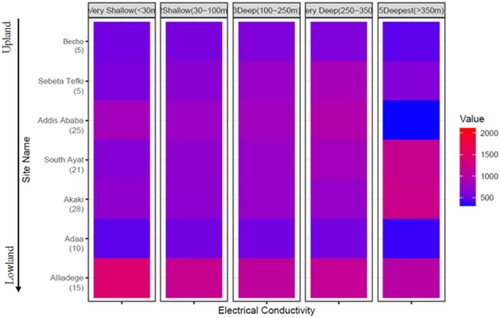
EC values show an increasing trend with depth and follow this trend in all areas except in Addis Ababa, Akaki, and Alliadege well fields. For instance, in Addis Ababa city, the average EC value is higher at shallow levels at the depth of 30 m (884 μS/cm) probably showing input from polluted surface waters into the shallow groundwater from the urban and industrial sources. From 30 m up to 350 m depths, the EC value at Addis Ababa follows a natural trend and gradually increases with depth, whereas in the deep layers below 350 m, EC decreases to 320 μS/cm due to dilution.
Moving from South Ayat to Akaki an increase in EC is observed. Except for the relatively high EC value at shallow depth in the Akaki well field (up to 30 m), EC increases with depth in both well fields. EC is expected to get higher along the groundwater flow path from upstream to downstream. Considering the Akaki well field located immediately downstream of Addis Ababa, this well field is expected to have higher EC compared to the Addis Ababa region. However, EC values do not show an increasing pattern from Addis Ababa to Akaki. The average value of EC measurements at Akaki located downstream of Addis Ababa city showed lower values (735 μS/cm) compared with the average EC value at Addis Ababa pocket wells (827 μS/cm). Ada’a area EC value is low and noticeably different from the rest of the other well fields.
Further downstream at Alliadege plain, the boreholes drilled at the Alliadege well field showed that the very shallow (< 30 m) groundwater system has slightly higher EC (1500 μS/cm) than the deeper system (1011 μS/cm). This implies there are two distinct groundwater flow systems in the region recharged by different sources.
Temperature variation is observed with depth in all the locations except Ada’a and Addis Ababa (). As expected due to the geothermal gradient, the temperature is generally increasing with depth. At Ada’a plain there is no significant variation in temperature with depth (23.7 °C). Uniquely at Addis Ababa, the temperature gradually increases from the surface (13 °C) to 350 m depth (24.3 °C) and suddenly drops after 350 m (13.2 °C). A similar pattern is observed from the EC measurement at Addis Ababa. Fast-moving regional groundwater flow passing through highly permeable geological formations referred to as hydrological windows [Citation23] may cause low temperature and EC in the deeper groundwater systems.
Figure 4. Heatmap of temperature profile. The numbers in the brackets indicate the number of boreholes from which the vertical profile temperature records were taken.
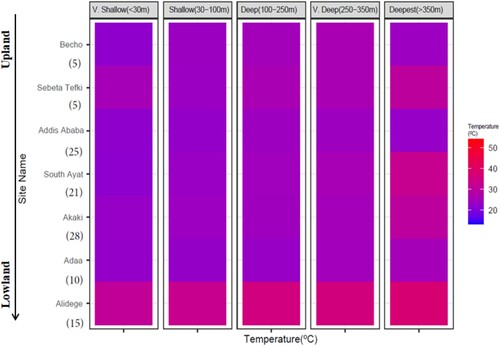
Except for the low-temperature anomalies noted at Ada’a (23.7 °C), the temperature gradually increases as we move from the upstream Becho area (24.1 °C) to the downstream Alliadege plain (35.1 °C).
At Sebeta Tefki, the temperature value is higher (25.5 °C) at shallow depth (< 30 m) compared with the temperature from 30 to 100 m depth (24.2 °C). below 100 m depth, the temperature follows the natural geothermal gradient. Geothermal hot springs are roughly aligned northwest–southeast along the Ambo–Wenchi–Butajira lineaments [Citation49]. The lineaments are fed by dykes and aligned volcanic plugs which favor the formation of hypothermal springs in the region [Citation27]. Sebeta–Tefki area is located in this region, and the high temperature is observed in the very shallow wells is related to the hypothermal springs from the dykes and plugs.
3.2. Stable isotopes (18O, 2H)
The isotopic compositions of H/O from all samples show a general depletion in heavy isotopes (18O, 2H) compared with the weighted mean isotopic signature of rainfall at Addis Ababa (). The δ18O and δ2H of summer rainfall at the IAEA station in Addis Ababa is –2.5 and –5 ‰, respectively (http://isohis.iaea.org).
Figure 5. The δ18O-δ2H plot of the groundwater samples from the shallow (< 150 m), intermediate (150–300 m), and deep (> 300 m) boreholes drilling depth compared with the weighted mean isotopic composition of rainfall in Addis Ababa city.
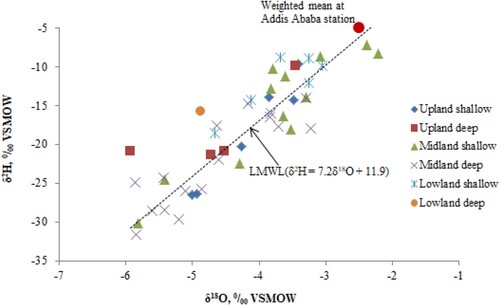
In both dry and wet seasons, the observed isotopic composition of all boreholes spread horizontally regardless of the location (upland, midland, lowland) and vertically based on the drilling depth of the boreholes from which the samples were collected (shallow, intermediate, deep) (, ).
Table 1. The groundwater samples from the boreholes taken during the dry season for isotope analysis (δ18O and δ2H).
The isotopic composition of both shallow (No 5 in ) and deep (No 7 in ) groundwater samples at Becho well field showed low δ-values. Both Akaki and Addis Ababa well fields isotopic signature show enriched 2H/18O signature on the Western side and depleted signature on the Eastern side.
At Alliadege plain the isotopic composition of the shallow system is characterized by high (mixing with from Awash River) and the deep groundwater by low δ-values (due to recharge from the adjacent escarpment).
3.3. Radioactive isotope (222Rn)
The high 222Rn concentrations in the upstream part of the main Awash River show that there is groundwater contribution to the river. Though smaller compared to the main Awash River, the groundwater contribution is also observed in the upstream tributaries (). Unlike the upstream part of the river, which is gaining from the groundwater, evidence for groundwater discharge into Awash River at Alliadege is lacking. The lower end of the Awash river in the study area shows low 222Rn content. A similar pattern is observed in both wet and dry seasons. However, as shown by the range of 222Rn concentration, there is more groundwater contribution during the dry season (0–1500 Bq/m3) () than in the wet season (0–500 Bq/m3) (, and ).
Figure 6. 222Rn concentration map showing 222Rn distribution for in-situ measurements conducted during (a) the dry and (b) the seasons.
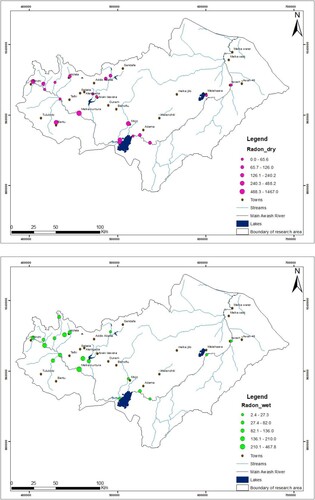
Table 2. 222Rn in-situ measured values in different water sources during the dry season.
Table 3. 222Rn in situ measured values in different water sources during the wet season.
3.4. Groundwater level contour map
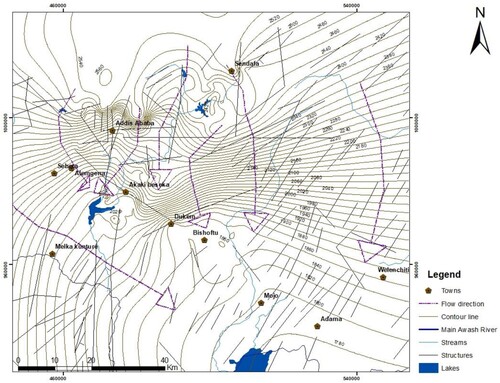
Hydraulic head patterns can be used to identify groundwater flow paths [Citation13]. There are several ways the shape of the hydraulic head contours can be examined to investigate the relationship between the groundwater and surface water features. Besides the powerful use of radon as groundwater tracers, one of the analyses is by looking at the shape of the hydraulic head contours adjacent to a river to identify losing and gaining river conditions. Besides, widely spaced hydraulic head contours indicate the focused recharge area due to highly permeable formation [Citation13]. Accordingly, the hydraulic head contours constructed using ArcMap 10.8 software with groundwater level data records from more than 330 wells show the groundwater flows from the Northern and Eastern escarpments towards the rift.
There may be uncertainties in the piezometric map () constructed from unevenly distributed water wells. However, some conclusions can be drawn from the figure. Groundwater contours show a flow pattern following the general topography. The hydraulic gradient is high in most parts of the area. However, the wider curvature of the head contour (low hydraulic gradient) observed at Ada’a and Akaki is an indication of local recharge () and results from the high hydraulic conductivity of the Quaternary basalts underlying the areas. The wider hydraulic head contour map shows that the Akaki and Ada’a areas become locally recharged by highly permeable formation mirroring the evidence from the EC and the isotopic composition. The convergence of contours to the streams in the highland areas (around Addis Ababa) reveals groundwaters discharging into the streams.
Figure 7. The groundwater contour map showing the wider hydraulic head contours at the Akaki and the Ada’a well fields.
4. Discussion
4.1. Groundwater flow dynamics
The stable isotope results of the research area taken from different well fields located at highland, midland and lowland show that there may be more than one flow system in the region of each of the well fields, not only one continuous regional groundwater flow connecting the highland recharge zones to the lowland discharging points [Citation26,Citation29,Citation50] (see i.e. ). But, rather dominated by a mix of both regional groundwater flow from the highlands and compartmentalised shallow groundwater aquifers replenished by local recharge.
The isotopic composition at Becho shows a depleted 2H/18O signature of both deep (No 7 in ) and shallow (No 1 in ) boreholes, indicating the Becho aquifer is connected to the regional groundwater flow system. The low EC value from the shallow to the deep groundwater system is also consistent with the depleted heavy H/O isotopes at Becho. Becho area is a flood plain characterized by thick silt and clay soils (5–15 m) [Citation27], which may impede local groundwater recharge. The involvement of local recharge contributing to the upland region seems insignificant.
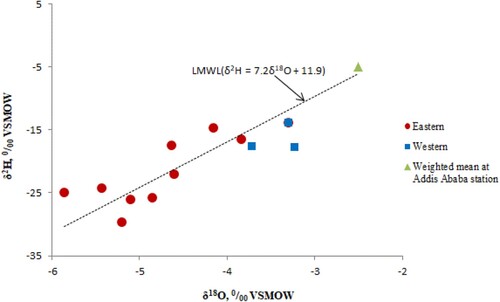
The midland part of the investigated area (Legedadi, South Ayat, Addis Ababa, Akaki, and Ada’a (Bishoftu and Mojo area)) signifies a groundwater flow system of heterogeneous nature. The western side of Akaki and Addis Ababa city showed a more enriched 2H/18O (). This indicates that the aquifer is mainly recharged by local rains and streams. The isotopic signature of most of the boreholes drilled on the western side of Addis and Akaki is plotted close to the weighted mean isotopic composition of rainfall in Addis Ababa city () signifying local recharge by rains and the streams.
Figure 8. The δ18O-δ2H plot of the borehole samples taken from the eastern and western sides of Addis Ababa (AA) and Akaki.
The lower EC value at the deeper groundwater system (below 350 m depth) in Addis Ababa may reflect a lateral inflow of groundwater from the highlands through fractured bedrocks (could be connected with regional recharge source), while the upper groundwater system (above 350 m depth) following the natural trend of EC with depth could be recharged by a local source. This may be due to a distinct groundwater recharge source for the upper and lower aquifer system. In the meantime, the relatively low average EC value recorded in Akaki area than in the upstream of it (Addis Ababa area) could be the result of a disconnected groundwater flow system from the plateau towards the rift.
Aquifers in Bishoftu show high δ18O/δ2H-values compared to the South Ayat, an area immediately North East of Bishoftu but separated by the large Yerer Trachyte dome. The difference in isotope pattern may indicate the disconnection between the two aquifer systems. The regional flow from the highland on the western side was revealed to be hindered by Trachytic domes forming local groundwater divides [Citation26].
The average EC value of boreholes at Ada’a entirely shows a signature of groundwater dilution (500 μS/cm) in all the groundwater systems regardless of depth. This shows the groundwater recharge is mainly from local sources. The stable isotopic signature of groundwater samples from the deep boreholes at Mojo in the Ada’a plain indicated low δ18O/δ2H-values. This implies that the Mojo aquifers are connected to recharge originating from the highlands as regional subsurface flow.
There are two distinct groundwater flow systems in the lowland Alliadege plain. The shallow boreholes’ isotopic composition indicated high δ18O/δ2H-values (No 43 in ), whereas the deep boreholes showed low δ-values (No 45 in ). The high isotopic composition of shallow groundwater at Alliadege could be due to the mixing of the groundwater with the Awash River. The mix of the lower Awash River with the groundwater is manifested by the relatively high isotopic signature downstream at Alliadege. The isotopic signature of Awash River shows enriched 18O/2H [Citation47]. However, compared with the well fields upstream (No 38 in ), the deep groundwater system of the Alliadege plain shows high δ18O/δ2H-values (No 45 in ). This could be related to the short distance travel of water from the adjacent escarpment. The relatively low EC value (1011 μS/cm) of the deep groundwater registered at Alliadege also confirms the low residence time. Our 222Rn measurements proved that the lower Awash River is a losing river to the groundwater where Alliadege plain is located. The low 222Rn concentrations (2000 Bq/m3) in the downstream part of the main Awash River is an indication that the groundwater is recharged by the river. The head contours downstream of Awash River also showed a curvature pointing in the downstream direction due to the mounding induced by groundwater recharge from the Awash River.
Even though the deep groundwater portrays an isotopically enriched, unlike the depleted isotopes (No 19 in ) on the eastern side of Addis Ababa and Akaki where the deeper system is connected to the continuous regional flow from the plateau, and the deep groundwater at Alliadege is comparatively enriched (No 45 in ). Besides, the EC measurements of the lowland at Alliadege show a decreasing pattern with depth. The higher EC (1533 μS/cm) at shallow depth is due to leaching from the top layer (alluvial lacustrine deposit). The deeper groundwater showed lower EC values (1011 μS/cm). The low EC and relatively enriched isotopes reflect the groundwater may not travel a long distance, but rather recharged by very close recharge zones from the adjacent escarpments. Had the lowland deeper groundwater system been recharged from the regional groundwater flow, the EC measurements would have resulted in higher EC as a result of long-distance travel and high residence time. Kebede [Citation27] has also confirmed that the shallow groundwater in this region is recharged by seepage from the Awash River and the subsurface inflow from adjacent highlands.
4.2. Groundwater recharge zone protection
The isotope analyses and EC measurements proved that the investigated area is characterized by both shallow groundwater systems fed by local recharge sources and deep systems connected to the regional flow from the plateau. The shallow groundwater systems (i.e. Addis Ababa, Akaki, Ada’a (Bishoftu, Mojo)) are located where the land use and land cover are dominantly urban settlements and industrial zones. The conversion of farmlands and shrublands to high urbanization and industrialization is also noticed in the past couple of decades [Citation35].
Addis Ababa city and Akaki areas are highly polluted areas due to poor waste management practices from urban and industrial sources [Citation51]. This poor waste management practice leads to the contamination of shallow groundwater points by anthropogenic pollutants. The pollution is manifested by higher EC of shallow boreholes at Addis Ababa pocket wells (884 μS/cm) and Akaki (837 μS/cm). The potential conversion of farmlands to urban settlements and industrial zones in the Ada’a plain (Bishoftu and Mojo areas) poses a threat to the shallow groundwater resources.
4.3. Implications for water resource management and climate resilience
The impact of drought on groundwater security has received much less attention [Citation52]. However, climate variability and change influence groundwater systems [Citation53,Citation54]. According to Lapworth et al. [Citation55], shallow aquifers containing young groundwater are most susceptible to inter-annual climate variability whereas older water is resilient to current climate change. MacDonald et al. [Citation56] also stated relatively deeper (boreholes) are more climate-resilient than shallow (springs and hand-dug wells) groundwater systems.
In this study, both EC measurements with vertical profiling of depth and systematically taken water samples for isotope analyses from the well fields aligned along the upland to the lowland areas were used to distinguish the shallow and deep groundwater systems. The shallow groundwater systems in most of the areas are dependent on local recharge sources and the deep systems are recharged by groundwater transfer from the highland. The scale of groundwater recharge is very important to characterize the resilience of groundwater supplies to both increased abstraction and climate change [Citation57].
Especially in the hotspot areas (Addis Ababa, Akaki, and Ada’a) where high groundwater abstraction occurs for domestic and industrial uses [Citation22], both shallow and deep systems supply the ever-increasing demand. The shallow groundwater systems are evidenced by 18O/2H enriched signals at Addis Ababa (No 20 in ), Akaki (No 26 in ), and Ada’a plain (No 33 in ).
According to Demlie et al. [Citation28], a groundwater level decline has already been observed in the Akaki well field. Since the shallow systems are more vulnerable to climate change and variability [Citation54,Citation55], more stress may be imposed on the groundwater supply sources for the major urban settlements and industries in the future.
5. Conclusions
This study characterizes the groundwater flow systems based on recorded vertical profiling of EC and temperature with depth in 2 m intervals. We have systematically organized sampling for isotope analyses taken from shallow (< 150 m), intermediate (150–300 m), and deep (> 300 m) groundwater drilling depths at upland (Becho area), midland (Addis Ababa, Akaki, Bishofu, Mojo), and lowland (Alliadege plain) regions of the upper and middle Awash River sub-basins. Dry and wet seasons 222Rn in-situ measurements and piezometric evidence were also used to supply the EC, temperature and analysis of stable water isotopes.
The evidence from the multiple methodological approaches shows that the Awash River cannot simply be represented by a singular and continuous flow system connecting the highland recharge zones to the lowland discharging points. Rather, the groundwater flow system is characterized by a spectrum of flow systems including (i) both shallow and deep aquifers dominantly recharged by the regional groundwater flow from the plateau (Becho area), (ii) aquifers, where the shallow systems are compartmentalised (largely recharged by local sources), and the deep systems, connected to the regional groundwater flow (Legedadi, eastern side of Addis Ababa and Akaki), and (iii) deep groundwater systems recharged by the adjacent escarpments (Alliadage plain). As shown by enriched 18O/2H signature in groundwater and piezometric evidences, the shallow groundwater system at Alliadege is recharged by the Awash River.
Except for the upland (Becho area), and deep groundwater systems in the midland and lowland, most of the shallow groundwater prospect sites in the investigated area are recharged by local sources. These important local recharge zones such as Addis Ababa pocket wells, Akaki well fields, and Ada’a plain are located in highly urbanized areas and where there is an expansion of industrial zones. Since these well fields are the water supply sources of major settlements and industries in the region, the highest attention should be given to protect the groundwater resources from potential contamination.
The heterogeneity of the groundwater flow systems in the volcanic aquifers of central Ethiopia should be carefully noted to properly conceptualize and define the boundary conditions in the hydrological and hydrogeological models. In this study, both aquifers connected to the continuous flow from the plateau and locally recharged compartmentalised shallow aquifers are observed with noticeable variations in the shallow and deeper groundwater systems.
Author contributions
KH, BB, SK, and TA: conceptualization and writing. KH, BB: field data collection and data compilation. All authors contributed to the article and approved the submitted version.
Acknowledgment
The authors acknowledge the logistics support by Addis Ababa University, Water and Land Resource Center, School of Earth Sciences, University of KwaZulu-Natal, Addis Ababa Water and Sewerage Authority, Ministry of Water and Energy-Ethiopia, Ethiopian Construction Design and Supervision Works Corporation (Water and Energy Design and Supervision Sector) and Ethiopian Meteorological Agency.
Disclosure statement
No potential conflict of interest was reported by the author(s).
Additional information
Funding
References
- Toth J. A theory of groundwater motion in small drainage basins in central Alberta, Canada. J Geophys Res. 1962;67(11):4375–4388. doi:10.1029/JZ067i011p04375
- Cook PG, Land C, Osmond G. A guide to regional flow in fractured rock aquifers. Henley beach: CSIRO; 2003.
- Fetter CW. Applied hydrogeology. 4th ed Upper Saddle River (NJ): Pearson Education Prentice Hall; 2014.
- Schaller MF, Fan Y. River basins as groundwater exporters and importers: Implications for water cycle and climate modeling. J Geophys Res. 2009;114:D04103, doi:10.1029/2008JD010636
- Myers AC, Finnegan PJ, Breedlove JD. Analysis of water-level data and ground-water flow modeling at Fort Riley, Kansas. Lawrence (KS): U.S. Geological Survey; 1999; Water-Resources Investigations Report; 99-4115.
- Praamsma T, Novakowski K, Kyser K, et al. Using stable isotopes and hydraulic head data to investigate groundwater recharge and discharge in a fractured rock aquifer. J Hydrol. 2009;366(1–4):35–45. doi:10.1016/j.jhydrol.2008.12.011
- Strydom T, Nel JM, Nel M, et al. The use of radon (Rn-222) isotopes to detect groundwater discharge in streams draining Table Mountain Group (TMG) aquifers. Water SA. 2021;47(2):194–199.
- Dassi L, Zouari K, Faye S. Identifying sources of groundwater recharge in the Merguellil basin (Tunisia) using isotopic methods: implication of dam reservoir water accounting. Environ Geol. 2005;49:114–123. doi:10.1007/s00254-005-0069-0
- Cartwright I, Cendón D, Currell M, et al. A review of radioactive isotopes and other residence time tracers in understanding groundwater recharge: Possibilities, challenges, and limitations. J Hydrol. 2017;555:797–811. doi:10.1016/j.jhydrol.2017.10.053
- Karroum M, Elgetta M, Elmandour A, et al. Geochemical processes controlling groundwater quality under semi arid environment: A case study in central Morocco. Sci Total Environ. 2017;609:1140–1151. doi:10.1016/j.scitotenv.2017.07.199
- Mechal A, Birk S, Dietzel M, et al. Dynamique de l’écoulement des eaux souterraines dans le système aquifère complexe du bassin de la Rivière Gidabo (Rift éthiopien): une approche multi-proxy. Hydrogeol J. 2017;25(2):519–538. French. doi:10.1007/s10040-016-1489-5
- Gutentag ED, Heimes FJ, Krothe NC, et al. Geohydrology of the high plains aquifer in parts of Colorado, Kansas, Nebraska, New Mexico, Oklahoma, South Dakota, Texas, and Wyoming. Alexandria, VA: U.S. Geological Survey; 1984. (USGS Professional Paper; 1400-B).
- Bresciani E, Cranswick RH, Banks EW, et al. Using hydraulic head, chloride and electrical conductivity data to distinguish between mountain-front and mountain-block recharge to basin aquifers. Hydrol Earth Syst Sci. 2018;22:1629–1648. doi:10.5194/hess-22-1629-2018
- Wilson JL, Guan H. Mountain-block hydrology and mountain-front recharge. In: Hogan JF, Phillips FM, Scanlon BR, editor. Groundwater recharge in a desert environment: The Southwestern United States. Washington, DC: American Geophysical Union; 2004. (Water Science and Application; 9).
- Wahi AK, Hogan JF, Ekwurzel B, et al. Geochemical quantification of semiarid mountain recharge. Ground Water. 2008;46(3):414–425. doi:10.1111/j.1745-6584.2007.00413.x
- Chavez A, Davis SN, Sorooshian S. Estimation of mountain front recharge to regional aquifers: 1. Development of an Analytical Hydroclimatic Model. Water Resour Res. 1994;30(7):2157–2167. doi:10.1029/93WR03369
- Manning AH, Solomon DK. Using noble gases to investigate mountain-front recharge. J Hydrol. 2003;275(3–4):194–207. doi:10.1016/S0022-1694(03)00043-X
- Manning AH, Solomon DK. An integrated environmental tracer approach to characterizing groundwater circulation in a mountain block. Water Resour Res. 2005;41(12):W12412, doi:10.1029/2005WR004178
- Kebede S, Travi Y, Stadler S. Groundwaters of the central ethiopian rift: Diagnostic trends in trace elements, δ18O and major elements. Environ Earth Sci. 2010;61(8):1641–1655. doi:10.1007/s12665-010-0479-5
- WGC. Issues paper water governance capacity awash basin, central Ethiopia review on content, institutional, relational layer. The Hague: Water Governance Center; 2013.
- Adeba D, Kansal ML, Sen S. Assessment of water scarcity and its impacts on sustainable development in Awash basin, Ethiopia. Sustain Water Resour Manag. 2015;1(1):71–87. doi:10.1007/s40899-015-0006-7
- Birhanu B, Kebede S, Charles K, et al. Impact of natural and anthropogenic stresses on surface and groundwater supply sources of the upper Awash sub-basin, Central Ethiopia. Front Earth Sci. 2021;9:656726, doi:10.3389/feart.2021.656726
- Kebede S, Travi Y, Asrat A, et al. Groundwater origin and flow along selected transects in Ethiopian rift volcanic aquifers. Hydrogeol J. 2008;16(1):55–73. doi:10.1007/s10040-007-0210-0
- Yitbarek A, Razack M, Ayenew T, et al. Hydrogeological and hydrochemical framework of Upper Awash River basin, Ethiopia: with special emphasis on inter-basins groundwater transfer between Blue Nile and Awash Rivers. J Afr Earth Sci. 2012;65:46–60. doi:10.1016/j.jafrearsci.2012.01.002
- Ayenew T, Kebede S, Alemyahu T. Environmental isotopes and hydrochemical study applied to surface water and groundwater interaction in the Awash River basin. Hydrol Process. 2008;22(10):1548–1563. doi:10.1002/hyp.6716
- Yitbarek A. Hydrogeological and hydrochemical framework of complex volcanic system in the Upper Awash River basin, Central Ethiopia: with special emphasis on inter-basins groundwater transfer between Blue Nile and Awash [thesis]. Poitiers: Université de Poitiers; 2009.
- Kebede S. Groundwater in Ethiopia: features, numbers and opportunities. Berlin, Heidelberg: Springer; 2013; (Springer Hydrogeology).
- Demlie M, Wohnlich S, Gizaw B, et al. Groundwater recharge in the Akaki catchment, central Ethiopia: evidence from environmental isotopes (δ18O, δ2H and 3H) and chloride mass balance. Hydrol Process. 2007;818:807–818. doi:10.1002/hyp.6273
- Ayenew T, Demlie M, Wohnlich S. Hydrogeological framework and occurrence of groundwater in the Ethiopian aquifers. J Afr Earth Sci. 2008;52:97–113. doi:10.1016/j.jafrearsci.2008.06.006
- Azagegn T, Asrat A, Ayenew T, et al. Litho-structural control on interbasin groundwater transfer in central Ethiopia. J Afr Earth Sci. 2015;101:383–395. doi:10.1016/j.jafrearsci.2014.10.008
- WWDSE. Groundwater resources development on prospective sites. Addis Ababa, Ethiopia; 2011.
- MoWR. Ethiopia: strategic framework for managed groundwater development. Federal Democratic Republic of Ethiopia, Ministry of Water Resources; 2011.
- Hemel R, Loijenga H. Set up of a water governance program in the awash river basin, central Ethiopia. Assessment of water governance capacity in the awash river basin. report. Den Haag, Netherlands: Water Governance Centre; 2013.
- Wagner PD, Bhallamudi SM, Narasimhan B, et al. Dynamic integration of land use changes in a hydrologic assessment of a rapidly developing Indian catchment. Sci Total Environ. 2016;539:153–164. doi:10.1016/j.scitotenv.2015.08.148
- Tadese M, Kumar L, Koech R, et al. Mapping of land-use/land-cover changes and its dynamics in Awash River Basin using remote sensing and GIS. Remote Sens Appl Soc Environ. 2020;19:100352.
- FAO. Soils of East Africa; 1998.
- Sakura ZESY, Aslam MAM. The use of temperature, stable isotopes and water quality to determine the pattern and spatial extent of groundwater flow: Nagaoka area, Japan. Hydrogeol J. 2005;13:650–651. doi:10.1007/s10040-005-0475-0
- Hem JD. Study and interpretation of the chemical characteristics of natural water. Reston (VA): U.S. Geological Survey; 1985; (USGS Water Supply Paper; 2254.
- Edmunds WM, Carrillo-Rivera JJ, Cardona A. Geochemical evolution of groundwater beneath Mexico City. J Hydrol. 2002;258(1–4):1–24. doi:10.1016/S0022-1694(01)00461-9
- Clark I. Groundwater geochemistry and isotopes. Boca Raton (FL): CRC Press, Taylor & Francis Group; 2015.
- Gat JR. Comments on the stable isotope method in regional groundwater investigations. Water Resour Res. 1971;7(4):980–993. doi:10.1029/WR007i004p00980
- Cook PG, Wood C, White T. Groundwater inflow to a shallow, poorly-mixed wetland estimated from a mass balance of radon. J Hydrol. 2008;354:213–226. doi:10.1016/j.jhydrol.2008.03.016
- Freyer K, Treutler HC, Dehnert J, et al. Determination of 222Rn in groundwater - recent applications for the investigation of river bank infiltration. Dresden: Hochschule für Technik und Wirtschaft; 1997.
- Schmidt A, Schlueter M, Melles M, et al. Continuous and discrete on-site detection of radon-222 in ground- and surface waters by means of an extraction module. Appl Radiat Isot. 2008;66(12):1939–1944. doi:10.1016/j.apradiso.2008.05.005
- Dimova NT, Burnett WC. Evaluation of groundwater discharge into small lakes based on the temporal distribution of radon-222. Limnol Oceanogr. 2011;56(2):486–494. doi:10.4319/lo.2011.56.2.0486
- Kebede S, Zewdu S. Use of 222Rn and δ18O–δ2H isotopes in detecting the origin of water and in quantifying groundwater inflow rates in an alarmingly growing lake, Ethiopia. Water (Switzerland). 2019;11(12):2591.
- Kebede S, Charles K, Godfrey S, et al. Regional-scale interactions between groundwater and surface water under changing aridity: evidence from the River Awash Basin, Ethiopia. Hydrol Sci J. 2021;66:450–463. doi:10.1080/02626667.2021.1874613
- Schubert M, Schmidt A, Paschke A, et al. In situ determination of radon in surface water bodies by means of a hydrophobic membrane tubing. Radiat Meas. 2008;43:111–120. doi:10.1016/j.radmeas.2007.12.017
- Abebe T, Mazzarini F, Innocenti F, et al. The Yerer-Tullu Wellel volcanotectonic lineament: a transtensional structure in central Ethiopia and the associated magmatic activity. J Afr Earth Sci. 1998;26(1):135–150. doi:10.1016/S0899-5362(97)00141-3
- Kebede S, Travi Y, Asrat A. Groundwater origin and flow along selected transects in Ethiopian rift volcanic aquifers. Hydrogeol J 2008;16:55–73. doi:10.1007/s10040-007-0210-0
- Yohannes H, Elias E. Contamination of rivers and water reservoirs in and around Addis Ababa City and actions to combat it. Environ Pollut Clim Change. 2017;1:116.
- Calow RC, MacDonald AM, Nicol AL, et al. Ground water security and drought in Africa: linking availability, access, and demand. Ground Water. 2010;48(2):246–256. doi:10.1111/j.1745-6584.2009.00558.x
- MacDonald AM, Calow RC. Developing groundwater for secure rural water supplies in Africa. Desalination. 2009;248(1–3):546–556. doi:10.1016/j.desal.2008.05.100
- Taylor RG, Scanlon B, Döll P, et al. Ground water and climate change. Nat Clim Chang. 2013;3(4):322–329. doi:10.1038/nclimate1744
- Lapworth DJ, MacDonald AM, Tijani MN, et al. Residence times of shallow groundwater in West Africa: implications for hydrogeology and resilience to future changes in climate. Hydrogeol J. 2013;21(3):673–686. doi:10.1007/s10040-012-0925-4
- Macdonald AM, Bell RA, Kebede S, et al. Groundwater and resilience to drought in the Ethiopian highlands. Environ Res Lett. 2019;14(9):0095003, doi:10.1088/1748-9326/ab282f
- Macdonald AM, Lark RM, Taylor RG, et al. Mapping groundwater recharge in Africa from ground observations and implications for water security. Environ Res Lett. 2021;16(3):034012, doi:10.1088/1748-9326/abd661