
 ?Mathematical formulae have been encoded as MathML and are displayed in this HTML version using MathJax in order to improve their display. Uncheck the box to turn MathJax off. This feature requires Javascript. Click on a formula to zoom.
ABSTRACT
Understanding the critical thresholds of dissolved oxygen (O2) that trigger adaptive physiological responses in aquatic organisms is long hampered by a lack of robust, non-lethal or non-invasive methodologies. The isotope fractionation of triple O2 isotopes (18O/17O/16O) during respiration is linked to the amount of oxygen utilised, offering a potential avenue for new insights. Our experimental research involved measuring the oxygen isotope fractionation of dissolved O2 in closed-system aquatic respirometry experiments with wild sticklebacks (Gasterosteus aculeatus). These fish were either naturally adapted or experimentally acclimated to hypoxic and normoxic conditions. The aim was to observe their oxygen usage and isotope fractionation in response to increasingly severe hypoxia. Initial observations revealed a progressive 18O enrichment from the preferential uptake of 16O to a dissolved oxygen threshold of 3–5 mg O2 L–1, followed by an apparent reversal in oxygen isotope fractionation, which is mixing of 16O and 17O with the remaining O2 pool across all populations and indicative of a systematic change in oxygen metabolism among the fish. Unexpectedly, sticklebacks adapted to hypoxia but acclimated to normoxia exhibited stronger oxygen isotope fractionation compared to those adapted to normoxia and acclimated to hypoxia, contradicting the hypothesis that hypoxia adaptation would lead to reduced isotope discrimination due to more efficient oxygen uptake. These preliminary experimental results highlight the novel potential of using dissolved O2 isotopes as a non-invasive, non-lethal method to quantitatively assess metabolic thresholds in aquatic organisms. This approach could significantly improve our understanding of the critical oxygen responses and adaptation mechanisms in fish and other aquatic organisms across different oxygen environments, marking a significant step forward in aquatic ecological and physiological research.
1. Introduction
Increasing interest in quantifying aquatic organisms’ oxygen (O2) uptake to estimate metabolic processes is driven by the need to improve our understanding of the ecological and evolutionary adaptations concerning rising stressors like environmental hypoxia [Citation1]. Intermittent-flow respirometry [Citation2] is often used as a minimally invasive method to obtain estimates of oxygen uptake as a surrogate for metabolic rates and to determine critical oxygen levels [Citation3] (e.g. Pcrit) that mark the boundaries of aerobic – anaerobic metabolism under increasing hypoxia (ca. <3 mg O2 L–1) or other stressors [Citation4,Citation5]. However, techniques for assessing whole organism oxygen responses lack insight at the tissue and cellular level [Citation6]. Moreover, methods to directly measure oxygen use within small animal tissues and organs are invasive or lethal, prohibiting repeated measurements across environmental contexts, thus restricting their ecological and evolutionary significance. Consequently, we need reproducible, non-invasive methodologies to augment our understanding of the ecological dissolved O2 thresholds that trigger beneficial adaptive physiological responses in aquatic organisms.
The stable isotopes of O2 (18O/17O/16O) have been used to measure metabolism in humans and terrestrial and aquatic communities [Citation7–9] but so far not for fish species or aquatic organisms using techniques like intermittent flow respirometry. The O2 isotope technique is based on the fundamental principle that the stable isotope ratios of ambient O2 (whether in air or water) will change as terrestrial or aquatic organisms consume it. This is because respiring organisms preferentially uptake the ‘lighter’ O2 isotopologues (i.e. 16O > 17O > 18O) due to faster reaction kinetics. While studies so far have mainly focused on 18O/16O ratios [Citation7,Citation8,Citation10], the use of three oxygen isotopologues can help to refine the resolution of measurements and offer additional insight. A recently promoted parameter, Δ′17O, capitalises on the far smaller differences between the rarer 18O and 17O isotopes caused by biogeochemical processes or isotopic gradients formed between mixing of distinctive biological oxygen pools [Citation10]. Most mass-dependent oxygen isotope fractionating processes (e.g. respiration, photosynthesis) result in δ17O changes about half that for δ18O (ca. 0.52 times), but biological respiration or mixing of O2 pools of different origins or processes could induce measurable changes in Δ′17O values [Citation11].
Fish preferentially uptake the 16O16O isotopologues of dissolved oxygen through their gills [Citation12] and bind isotopically ‘lighter’ oxygen to their haemoglobin [Citation13]. Respiration in fish is a multi-step process: dissolved O2 diffuses through the gill membranes to the blood cells, which subsequently interacts with blood haemoglobin. This process of molecular diffusion and biochemical reactions can each cause isotope fractionation of the O2 isotopes, with the net isotope fractionation dependent on the rate-limiting step. In a closed aquatic system, such as an experimental respirometry chamber, as fish respire the ambient dissolved O2 decreases and is generally expected to become progressively enriched in the heavier isotopologues following the well-known exponential Rayleigh effect [Citation7]. The Rayleigh effect describes systematic changes in the isotopic composition of O2 as respiration progresses under closed system conditions, like respirometry chambers. Following the Rayleigh principle, the oxygen isotopic composition of the remaining dissolved O2 over time can be expressed as:
(1)
(1) where δf is the oxygen isotopic composition of the remaining dissolved O2, δi is the initial isotopic composition of the O2 at the start of the experiments, ϵ is the isotope fractionation factor due to respiration (measured or assumed), and f is the measured concentration of O2 from the start to the end of the experiment expressed as a fraction (e.g. f = 0.8 means 20 % of O2 was consumed). Notably, the value of ϵ can be determined using sequential dissolved oxygen concentration and O2 isotopic measurements. It has been shown that for humans under some physiological states when the O2 uptake becomes limiting (e.g. heavy exercise, stress, lung disease), the discrimination (ϵ) of O2 isotopologues by respiration is greatly reduced [Citation7,Citation14]. This reduction in isotope fractionation may reveal novel information on the context dependency of metabolic processes.
In this study, for the first time, we performed oxygen isotopic respirometry experiments with three cohorts of wild sticklebacks (Gasterosteus aculeatus) [Citation15] adapted through several years of exposure in the wild and experimentally acclimated in the aquaria facilities to hypoxic and normoxic conditions. For our experiments, fish were habituated in respirometry chambers under fully aerated conditions to establish their routine metabolic rate (RMR) [Citation16]. After establishing their RMR, we closed the chambers and monitored the decrease in dissolved O2 in the chamber driven solely by fish respiration using optical probes. We hypothesised that sticklebacks adapted or acclimated to hypoxic conditions would exhibit more efficient oxygen uptake (i.e. lower isotope fractionation) than their normoxic conspecifics and consequently exhibit lower oxygen isotope fractionation of O2. However, this hypothetical pattern turned out to be more complex than we expected.
2. Materials and methods
2.1. Fish species
We used the three-spined stickleback (G. aculeatus) for this new oxygen isotope respirometry test. Sticklebacks have colonised and adapted to different freshwater habitats in the Northern Hemisphere, including streams and lakes that already exhibit extreme hypoxia [Citation17]. Sticklebacks have a fast growth rate and are easy to rear and study in captivity; hence, they are an excellent model for addressing evolutionary responses to hypoxia. We used two stickleback populations obtained from near Hamburg, Germany, for our experiments. The first population was collected from the Lottbek River on the outskirts of Hamburg (53.684°N, 10.136°E) at a site that rarely experiences hypoxia, the lowest oxygen level being 6.7 mg O2 L–1 (i.e. Normoxia-adapted population). The other stickleback population was collected from the Ottersbek River near Hamburg city centre (53.576°N, 9.965°E), which experiences intensive summer hypoxia events (as low as 1.1 mg O2 L – 1; [Citation18]) since 2012 (i.e. Hypoxia-adapted population). Once these fish were brought to the University of Turku, fish from each population were bred. The offspring of the Normoxia-adapted population were reared in a normoxia environment, i.e. with a minimum of 90 % oxygen saturation in the water (9.9 ± 0.1 mg O2 L – 1). The progeny of the Hypoxia-adapted population was split equally and reared either in a normoxia environment or an intermittent hypoxia environment that had a minimum of 90 % oxygen saturation from 07:00 to 19:00 and 32 ± 5 % oxygen saturation (3.7 ± 0.6 mg O2 L–1) from 19:00 to 07:00. These conditions were chosen to mimic the natural summer oxygen fluctuation patterns when oxygen decrease during the night due to community respiration [Citation19]. Oxygen concentrations in the fish-holding aquaria were controlled and maintained using oxygen optical probes (Loligo Systems, Denmark) connected to an automated N2 sparging tank. The photoperiod was held at 12 h light and 12 h dark. Fish were fed according to their life stage with commercial feed (JBL NovoTom, TetraMin Baby, TetraMin flakes) and live Artemias. The water temperature was initially set at 17 ± 0.5 °C from the egg stage to 9 months old, then to 15 ± 0.5 °C. The fish used in our experiments were 20 months old and weighed 2.2 ± 0.2 g (mean ± SE) with fork lengths of 62 ± 3 mm. Fish were fasted for 24 h before being tested. We use the following abbreviations for the oxygen treatments: a Normoxia-adapted population reared in a normoxia environment (Normox-normox), a Hypoxia-adapted population reared in a normoxia environment (Hypox-normox), and a Hypoxia-adapted population reared in a hypoxic environment (Hypox-hypox).
2.2. Respirometry tests
Fish respirometry tests were conducted using bespoke chambers submerged in a 60-L tank filled with continuously aerated water thermoregulated at 15 °C. A simplified schematic of the closed-system fish respirometry system submerged in the reservoir tank is depicted in . Two respirometry chambers made of clear Plexiglas (25 cm long, 7 cm outside diameter, internal volume 0.96 L, Loligo Systems, Denmark) were used, each allowing sufficient room for the fish to move freely. The O-ring sealed endplates could be removed to add or remove fish and had hose barbs to connect to recirculating or aeration pump tubing (total 73 cm long, 1 cm O.D., internal volume 60 mL), a flushing pump (Eheim GmbH), and a sampling ‘chimney’ (190 cm long, 1 cm O.D.) added to one end to normalise the chamber with atmospheric pressure. The recirculating submersible pump maintained a gentle flow rate of 5 L per min through the chamber, ensuring complete and rapid water mixing without forcing the fish to swim (exercise) against the current. One minor modification to the standard chamber was adding a 200 cm long 1/8″ gas and O2 impermeable PTFE tubing inside the chimney tubing, fixed through a drilled hole in the downstream chamber endplate, and held in place with a rubber O-ring. This allowed us to draw 12 mL (2 duplicates) isotope sample volume water samples from inside the chamber under closed-system conditions during the experiment while simultaneously replenishing the removed water through the chimney to ensure no pressure changes or physical disturbances to the fish in the chamber. An optical dissolved oxygen probe (PyroScience GmbH.) was fitted into a probe holder in the recirculating loop and connected to a Firesting O2 optical oxygen meter (PyroScience GmbH) to measure the dissolved O2 every 4 sec and log the O2 concentrations for subsequent data analysis. These optical probes were calibrated before each test using air-saturated water at 15 °C.
Figure 1. Simplified diagram (not to scale) of the respirometry system with added ‘chimney’ and a PTFE sampling tube. A submersible pump recirculated chamber water at 5 L/min. A 0.125-cm OD PTFE tube was connected to a 3-way valve and gastight syringe to draw O2 isotope samples from the respirometry chamber via the chimney. An online optical sensor and thermocouple measured O2 concentration and water temperature in real time. The setup and procedures closely follow that of [Citation2].
![Figure 1. Simplified diagram (not to scale) of the respirometry system with added ‘chimney’ and a PTFE sampling tube. A submersible pump recirculated chamber water at 5 L/min. A 0.125-cm OD PTFE tube was connected to a 3-way valve and gastight syringe to draw O2 isotope samples from the respirometry chamber via the chimney. An online optical sensor and thermocouple measured O2 concentration and water temperature in real time. The setup and procedures closely follow that of [Citation2].](/cms/asset/fe951678-828e-40f1-a67d-cd1fc6b26a9c/gieh_a_2366470_f0001_oc.jpg)
For the initial test, we used 5 sticklebacks (12.1 g total biomass) of the Hypoxia-adapted population maintained in a hypoxia environment. Owing to the slow overall respiration response of so small total fish biomass relative to the water volume in the chamber, and thereby limiting the achievement of hypoxic conditions within a reasonable timeframe (ca. < 6 h), we used 10 sticklebacks for the two subsequent tests (22.9 and 19.4 g total biomass for the Hypoxia-adapted population in the normoxia environment and the Normoxia population in the normoxia environment, respectively). This increase in fish biomass allowed each respirometry chamber oxygen level to achieve hypoxia conditions (ca. 2 mg O2 L–1) in ca. 4 h. Before starting the tests, the respirometry chamber endplates were kept open in the large reservoir tank for several hours to ensure no residual air bubbles were sticking to the tubing or inner Plexiglas chamber walls. The fish were transferred around 12:00 into the respirometry chambers and allowed to habituate to the chamber for ca. 2.5 h under fully oxygenated flow conditions to minimise stress from environmental disturbance. The fish’s RMR was measured during the last hour of the habituation period using six measuring cycles with 2 min. of open-system flushing and 8 min of closed-system (). After the RMR measurements were completed, the respirometry chambers were closed from the flushing pump (t = 0, START), and the dissolved oxygen subsequently declined in the chambers solely due to fish respiration under closed-system conditions. The O2 decline was monitored in real time with in-line optical oxygen probes. The isotope sample collections and fish oxygen consumption were timed based on each ca. 1 mg O2 L–1 (10 % O2 saturation) decline in dissolved oxygen concentration. This process was continued until a loss of equilibrium was observed in the fish (at approximately 2–3 mg O2 L–1), after which the chamber was aerated to avoid fish mortality. The tests were stopped (END) when the chamber dissolved oxygen concentration declined over several hours from ca. 10 mg O2 L – 1 (100 % oxygen saturation) to as low as 1.7 mg O2 L–1 (17 % oxygen saturation), or earlier if the fish showed signs of loss of equilibrium or distress. After the final water sampling and oxygen consumption measurements, the respirometry chambers were opened by removing the endplates from the aerated outer tank. The fish were allowed to recover in fully oxygenated conditions before returning to their regular aquaria. Control water samples were also taken from the large outer reservoir water tank and the respirometry chamber for O2 stable isotope analyses before and after each test to affirm atmospheric equilibrium for dissolved oxygen with a measured starting δ18O value of +24.8 ‰ (VSMOW) at 100 % saturation at 15 °C. Each respirometry chamber was sterilised before the experiments to eliminate the potential confounding effects of microbial biofilm development affecting net respiration and oxygen consumption. Blank oxygen consumption (Controls) measured in the empty chambers before and after each of the fish measurements proved the absence of bacterial respiration.
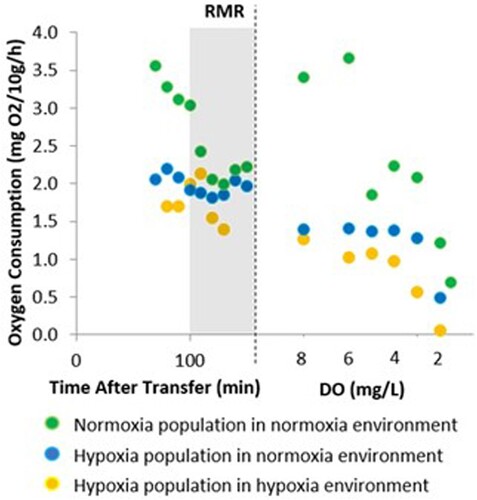
Figure 2. Measured oxygen consumption rates in each of the three respirometry tests. The routine metabolic rate (RMR) after the habituation time is the shaded area after which the isotope experiment was started under closed-system conditions.
During the oxygen decline, the fish metabolic rate of oxygen consumption (MO2) was calculated using 2-min slopes of decline in dissolved oxygen concentrations in the respirometry chambers. Slopes of oxygen consumption (either during RMR or during oxygen decline) were estimated using the software Labchart™, multiplied by the volume of the chamber and recirculation loop tubing minus the volume of the fish, corrected by the background bacterial respiration (none) and standardised to 10 g of fish biomass. MO2 was thus expressed in mg O2/10 g/h. Fish RMR was determined as the average MO2 over the six cycle’s slopes.
2.3. Water sample collection and O2 stable isotope measurements
Water samples were collected in duplicate for triple-oxygen isotope measurements in sterilised 12-mL Exetainers™ closely following the sample collection method described previously [Citation20]. Each Exetainer vial was sterilised (200 °C) and by adding 10 µL of a saturated HgCl2 solution to poison the collected water sample to eliminate potential post-sampling biological activity that could alter the O2 isotopes.
Water samples from the respirometry chamber were collected by attaching a 100 mL gastight syringe with a 3-way Luerlok valve to 0.125 cm OD PTFE tubing fed into the respirometry chamber through the chimney. Chamber water at each target O2 level was gently drawn into the gastight syringe (to avoid degassing) and discarding the initial dead volume of the PTFE tubing (16 mL). Next, 12 mL of freshly drawn respirometry chamber water was collected and filled into the bottom of the Exetainer with a short length of 0.125 cm PTFE tubing and gently but rapidly filling the Exetainer from base to brim and avoiding bubbles or reaeration. The Exetainer was immediately sealed with the septum-lined cap. The preserved water samples were stored cold (5 °C) until stable O2 isotope analyses. This technique was shown to be efficient with experimental blanks. The concentration of dissolved O2 in the respiration chamber corresponding to the stable isotope sample was taken from the optical probe at the sampling time. All stable isotope samples for dissolved O2 were collected in duplicate.
For each sampling time step, a total of 40 mL (16 mL dead water in the tubing + 12 × 2 mL isotope samples) had to be drawn from the closed system respirometry chamber at declining oxygen levels and with increasing oxygen isotope enrichment. After the isotope sample was collected, the chimney had to be replenished with 40 mL of aerated reservoir water to avoid chamber water drawdown. The reservoir water was maintained at 100 % oxygen saturation and 15 °C with a δ18O value of +24.6 ‰ to ensure consistency in sampling. This chimney replenishment constituted a potential 4 % volumetric ‘reaeration’ of the respirometry chamber after each sample collection. An isotope and oxygen mass-balance mixing model assuming full mixing, revealed that this replenishment with aerated water had a near negligible effect on the chamber δ18O values. In the worst-case scenario (e.g. at 20 % O2 saturation, +28.0 ‰), this 40 mL replenishment would result in a small δ18O decrease to +27.8 ‰, a −0.2 ‰ change that is close to instrumental measurement uncertainty (±0.16), and a 0.4 % rise in oxygen saturation which we observed quickly dissipated. Moreover, the chimney was a static water column located outside of the water recirculation system, so the effect was likely smaller due to the unmixed standing water and diffusive mixing. In future studies, reducing the required sample volume for isotopic measurements and minimising the tubing and chimney lengths would be beneficial to further reduce potential sampling effects.
In the stable isotope laboratory, we followed the analytical procedure of Barth et al. [Citation20]. Briefly, each Exetainer had 3 mL of its water displaced by pure Helium gas followed by orbital shaking for 30 min to partition dissolved O2 into the vial Helium headspace. Sample vials were loaded onto a headspace autosampler connected to a ThermoFisher GasBench™ purification system and ThermoFisher Delta Plus™ isotope-ratio mass-spectrometer (IRMS). Stable isotope analysis of the extracted O2 gas was conducted by transferring the headspace mixed-gas (e.g. O2, N2, CO2, H2O) headspace through a water and CO2 trap and into a gas sampling loop via a double-holed needle. The sample in the gas loop was then directed into a packed 5-Å-molecular sieve capillary column, where the O2 was chromatographically separated from the other gases and admitted into the isotope-ratio mass spectrometer. The IRMS was tuned to m/z ratios of 32/33/34, thus enabling the determination of the triple-isotope 18O/16O and 17O/16O ratios of the dissolved O2. External standards consisted of atmospheric air samples in helium-flushed vials with 1.5–17 ppt O2 in He and assigned δ18O and δ17O isotope values of +23.88 and +12.61 ‰ (VSMOW), respectively, for single-point normalisation of the results relative to the VSMOW-SLAP reference scale. Measurement uncertainty based on control standards after applicable linearity and drift corrections were ±0.16 and ±0.11 ‰ for δ18O and δ17O, respectively.
For expressing triple-oxygen isotope delta value (δ) notations, we used the linearised ‘prime’ expressions [Citation12]:
(2)
(2) and
(3)
(3) For determining the oxygen isotope fraction factor (αr) for aerobic respiration, we used:
(4)
(4) and
(5)
(5) We used the Rayleigh model to explain the initial progression of oxygen isotopes because each test started with the same isotopic and oxygen composition. The isotope fractionation factors for respiration (αr) relative to 16O were determined by regressing the initial linear segment (>5–10 mg O2 L–1, see results) of δ′18Ο and δ′17Ο vs (ln (f)) to obtain αr and in ‰ where ln(f) was the proportion of the starting O2 left in the respiration chamber.
To determine the 17O-excess value (Δ′17O) in our respirometry experiments – or the differential oxygen isotope fractionation in 17O/16O versus 18O/16O from mass-dependent expectations in biological processes – we used the linear relationship:
(6)
(6) The value of λ17/18 in Equation (6) is generally assumed to be a constant for all mass-dependent isotope fractionating processes like aerobic respiration. Aquatic community respiration is generally assumed to have a fixed λ17/18 value of 0.518 based on one study [Citation11]. However, recent studies have suggested that λ17/18 can exhibit a wide range of values, depending on the organism or the pathway-specific differences in oxygen consumption (e.g. aerobic vs anaerobic respiration) [Citation10]. In this work, instead of using the assumed value of 0.518 we empirically determined the λ17/18 value for each experiment by:
(7)
(7) using the respiration relationship observed for these oxygen isotopes during the initial linear stage of aerobic respiratory oxygen consumption from air-saturated conditions to the δ′18O isotopic inflection point. At oxygen concentrations of < 5 mg O2 L–1 we assumed the λr derived for each respirometry experiment (for each adapted fish population) to determine Δ′17Onorm. By normalising Δ′17O to the initial linear aerobic respiration portion of the curve – which is a mass-dependent isotope fractionating process that should have Δ′17O = 0 for each adapted fish population – we used subsequent differences (Δ′17Onorm) to detect processes that differentially altered the 17O/16O versus 18O/16O ratios. In our study, this normalisation step helped to clearly illustrate the switchover of oxygen isotopic fractionation and the continuing evolution of environmental oxygen with increasing hypoxia and respiration.
3. Results and discussion
Closed-system RMR values of experimental groups ranged from 2.17 mg O2/10 g/h (Normox-normox) and 1.91 mg O2/10 g/h (Hypox-normox) to 1.74 mg O2/10 g/h (Hypox-hypox) as shown in .
All stable isotope and oxygen concentration results and time trends were plotted in (data in Supplemental Materials). As anticipated, the rise in δ′18O values with diminishing O2 in ambient water due to aerobic respiration of fish initially conformed to linear respiration isotope fractionation trend expectations [Citation12,Citation21], starting from initial air-saturated conditions (δ′18Ο +24.6 ‰, VSMOW) and reaching peak δ′18Ο values from +28.5 ‰ (Hypox-normox) to +28.0 ‰ (Normox-normox) and +27.5 ‰ (Hypox-hypox) at oxygen conditions between 3 and 5 mg O2 L–1. However, for all experiments, below 3–5 mg O2 L–1, despite the dissolved oxygen concentrations still linearly decreasing (: A1–2 to C1–2), an unexpected reversive shift occurred in the δ′18Ο values of dissolved O2 and reduced the δ−values (and to a lesser extent δ′17Ο) to about +26.5 ‰ (Hypox-normox), + 25.5 ‰ (Normox-normox), and +25.0 ‰ (Hypox-hypox) by oxygen concentrations of 2 mg O2 L–1. At this point the tests were terminated to avoid fish mortality (: A3-4 to C3-4). Whereas mass-dependent isotope relationships between δ′18Ο/δ′17Ο (λr) values for aquatic community respiration usually fluctuate around 0.518–0.520 [Citation11,Citation12], the observed biological oxygen isotope fraction between 18O/16O and 17O/16O in our tests was significantly higher with λr values of 0.726 for Normox-normox, 0.719 for Hypox-hypox, and 0.649 for Hypox-normox populations. The Δ′17O normalised values in our respirometry experiments, as expected, were initially zero (; A6 – C6, lower right, shaded box). This was a typical Δ′17O for respiration; however, these values exhibited a marked increase below a threshold of ∼ 4–5 mg O2 L–1. This reversive triple-oxygen isotopic shift contradicted marine and aquatic community respiration studies where δ′18Ο usually linearly increases with declining oxygen, and the Δ′17O value remains zero. However, it is worth pointing out that all these earlier aquatic studies did not test below ca. 50–70 % oxygen saturation levels [Citation12,Citation21] like we did in this experiment.
Figure 3. Results of triple-oxygen isotope respirometry experiments for three groups of sticklebacks adapted to Normox-normox (A) Hypox-normox (B), and Hypox-hypox (C) from the Start to End of each closed-system experiment. The upper four panels (A1 – C4) reveal declining respiration rates and the δ′18O and δ′17O responses to declining ambient oxygen levels under closed-system respirometry. Red crosses mark the δ′18O and δ′17O isotopic threshold or reversal (A3 – C6), demarking the onset unload of depleted O2, possibly caused the Bohr/Root effect, which occurred under hypoxia conditions around 3–5 mg O2 L–1.
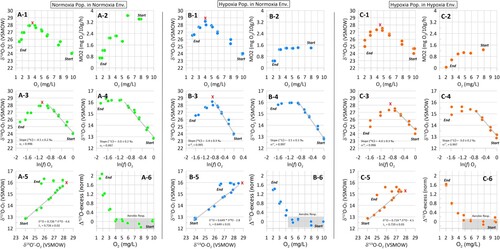
The δ′18Ο and δ′17Ο isotope fractionation factor ϵ (; A3–4 to C3–4, middle panels) for the initial linear respiration trend revealed distinctions in oxygen utilisation between these stickleback populations. For δ′18Ο, the isotope fractionation factors (ϵ) ranged from –4.0 to –5.4 ‰, and for δ′17Ο they ranged between –3.0 and –3.5 ‰. Oxygen isotope fractionation detected in the Hypox-normox population was higher than in the other two populations (i.e. Normox-normox and Hypox-hypox), which showed similar isotope fractionation values. This finding contradicted our hypothesis that stickleback adaptation to a hypoxic environment would result in less oxygen isotope fractionation due to the more efficient oxygen uptake compared to normoxia-adapted conspecifics [Citation17]. Overall, the oxygen isotope respiration isotope fractionation factors determined for the sticklebacks were considerably lower than those measured in ‘community’ aquatic environments (e.g. lakes, streams, sediments, oceans) that are dominated by microbial or dark respiration (ϵ of –15 to –25 ‰; [Citation22]). We found only one O2 isotope study of salmonids that observed low 18Ο isotope fractionation factors of –5.5 to –7.7 ‰. However, these were from an experiment conducted under high (100–70 %) oxygen saturation environments [Citation21].
Using a pre-sterilised closed-system respirometry system allowed us to exclude other potential processes that can alter dissolved O2 isotopic ratios in natural environments, particularly gas exchange by reaeration with atmospheric O2 or respiration from microbial biofilm. Therefore, any changes in the isotopic composition of dissolved O2 inside the chamber resulted solely from the tested fish’s physiological responses to experimentally induced progressive environmental hypoxia. The initial observed process of O2 isotopic fractionation was reasonably explained by the classical aerobic respiration model (shaded areas; ), which preferentially uptakes lighter isotopes and leads to a relative increase of heavier O2 isotopes in the ambient water. However, we observed that this process reverted, and the relative proportion of heavier isotopes in the ambient water sharply decreased once O2 reached 3–5 mg O2 L–1 (e.g. 30–50 % of saturation in this experiment). Fish could induce this shift in isotopic ratio either by (i) a release of lighter O2 isotopes from their body or (ii) by a preferential uptake of heavier O2 isotopes from the ambient water. The later mechanism seems highly unlikely, because it contradicts stable isotope kinetics where lighter isotopes always react faster and are preferentially taken up by biochemical processes (e.g. diffusion through the biological membrane of fish gills). Therefore, the remaining viable explanation for the observed pattern is the unloading (e.g. back diffusion) and mixing of ‘light’ O2 from the fish body into the ambient water, or by other yet unknown processes.
The diatomic O2 involved in biochemical cellular processes in the fish body is eventually broken and bound to carbon and retained in biomolecules of fish tissues or released as respiratory CO2 from the body. Importantly, in this study CO2 concentration and its oxygen isotopes were not measured; however, because dissolved CO2 rapidly exchanges O atoms with ambient or body H2O it would not retain any O2-derived signal [Citation20]. The largest secondary pool of depleted O2 in the closed respirometry system (i.e. including the body of experimental fish and ambient water) is O2 bound to haemoglobin in fish blood [Citation23]. Indeed, studies on humans indicate that oxy-haemoglobin formation is the prevalent step in determining the final O2 isotope fractionation factor [Citation7,Citation24]. Even though O2 binding to haemoglobin is a dynamic reversible process and the exchange of oxygen between water and blood takes place continuously, haemoglobin preferentially retains or releases the ‘lighter’ O2 isotopes and hence maintains a depleted isotopic gradient [Citation7,Citation24]. Consequently, any processes leading to a release of haemoglobin-bound O2 [Citation25] and reducing the capacity of haemoglobin to bind O2 could cause the unloading of 18O-depleted O2 from fish to ambient water.
Interestingly, the O2 isotopic shifts we observed coincided with the beginning of diminishing oxygen uptake of the experimental fish (), a common adaptation of fishes to increasingly hypoxic environments. Therefore, we may speculate that a release of the 18O-depleted O2 correlated with physiological processes like an acute response to hypoxia by unloading ‘light’ O2 from haemoglobin back to the tissues, including the gills. Therefore, this O2 could thus stem from the onset of Bohr and/or Root effects. The Bohr effect describes the influence of pH on haemoglobin’s oxygen binding affinity, whereas the Root effect refers to the reduction in oxygen binding capacity at low pH, as primarily observed in fish haemoglobin [Citation23,Citation25]. It has been shown that under hypoxia, blood acidosis from CO2 or lactate can lead to muscle partial pressure of oxygen (PO2) increases by 65 %, a mechanism that can double O2 delivery to body tissues [Citation23]. We hypothesise the same process could be unloading isotopically depleted O2 from fish blood to mix back vial the gills into the ambient water. While releasing O2 from the body under hypoxic stress does not appear to be a beneficial response to hypoxic conditions, it is important to note that the process is happening at very low thresholds of ambient O2. Therefore, even a tiny amount of isotopically depleted O2 released by the experimental fish and subsequently mixing with the ambient water oxygen is easily detectable using high precision isotope-ratio mass spectrometry as changes in the ambient O2 isotopic ratios.
As the observed reversion of O2 isotopes was an unanticipated finding, our study was not designed to specifically investigate or detect this effect or how it could be potentially related to depleted O2 unloading from haemoglobin and the onset of a Root or Bohr effect. Thus, further experimental testing and replication (and with other species) are required to affirm this potential process and linkage. For example, concomitantly measuring dissolved CO2 in ambient water would be useful. This would require an altered experimental setup to enable more water withdrawal per sample (e.g. 100 mL each). This in turn could compromise the limits for O2 isotope samples or for smaller organisms. In the current study design, we reached hypoxic conditions in the respirometry closed-system chambers by letting the fish consume O2. This consumption is associated with a concomitant rise in ambient dissolved CO2. As we did not measure ambient CO2, we cannot determine if the purported release of depleted O2 was related to an ambient CO2 increase or to internal blood acidosis caused by advanced hypoxia. Further controlled experimental set-ups rapidly reducing O2 levels using an automated N2 sparging tank would contribute to teasing apart these two effects. In addition, quantification of oxygen partial pressure in the fish blood and muscle tissue could also provide information on levels of acidosis, but such internal measurements require lethal sampling. Using larger fish might allow us to measure oxygen uptake rate and O2 fractionation on an individual basis. This would also help to allow for repeated non-lethal blood sampling. When combined with additional controls of CO2 levels in the set-up, bigger fish could be ideal to help verify the proposed mechanism at play. Moreover, it may also be useful to conduct O2 tracer tests using different 18O2 isotope enrichments of the dissolved O2 and then measure δ18O in sub-samples of blood haemoglobin oxygen to detect the degree of oxygen isotope uptake and directly determine oxygen isotope fractionation.
In conclusion, this novel pilot experiment is the first to use dissolved O2 triple-isotopes of ambient water in respirometry as a proxy that shows previously unknown responses and repeatable patterns of oxygen isotopic fractionation that are clearly related to a physiological response of fish to stress from systematic hypoxia thresholds (e.g. 3–5 mg O2 L–1). This allowed us to quantify environmental oxygen concentration tolerance thresholds which were previously based on observational or behavioural responses or invasive blood sampling measurements. It could be anticipated that these experiments (under varying temperatures, stress, and hypoxia) may be useful for establishing guidelines for regulatory frameworks for environmental health monitoring. Similar oxygen isotope respirometry experiments could be conducted using marine or freshwater fish species or other aquatic organisms to help establish metabolism thresholds for watershed or ecosystem health management purposes. While further experiments are needed to elucidate the proposed biochemical mechanisms at play, O2 isotopic sampling appears to open a new and non-invasive proxy for exploring deep physiological processes in aquatic organisms, such as evolved survival mechanisms in response to environmental or physiological stress.
Author contributions
LIW and LZ conceived the project. LIW, LZ, BK, and AC designed the experiment. LIW and AC conducted respirometry experiments. LIW and JACB conducted stable isotopic analyses. LIW and LZ wrote the manuscript with input from all authors.
Supplemental Material
Download Zip (11.8 KB)Acknowledgments
We thank Konsta Pätsi and Elina Chiesa for their help in the maintenance of the fish and Robert van Geldern and Christina Schubert for assistance with the isotope analyses. We thank Clive Trueman and 4 journal reviewers for providing critical comments to improve the initial submission.
Disclosure statement
No potential conflict of interest was reported by the author(s).
Data availability
The experimental datasets are found in Supplemental Materials.
References
- Jenny JP, Francus P, Normandeau A, et al. Global spread of hypoxia in freshwater ecosystems during the last three centuries is caused by rising local human pressure. Glob Change Biol. 2016;22:1481–1489. doi:10.1111/gcb.13193
- Killen SS, Christensen EAF, Cortese D, et al. Guidelines for reporting methods to estimate metabolic rates by aquatic intermittent-flow respirometry. J Exp Biol. 2021;224:jeb242522. doi:10.1242/jeb.242522
- Fry F. Fish physiology. Fish Physiol. 1971;6:1–98. doi:10.1016/S1546-5098(08)60146-6
- Rogers NJ, Urbina MA, Reardon EE, et al. A new analysis of hypoxia tolerance in fishes using a database of critical oxygen level (Pcrit). Conserv Physiol. 2016;4:cow012. doi:10.1093/conphys/cow012
- Fu SJ, Brauner CJ, Cao ZD, et al. The effect of acclimation to hypoxia and sustained exercise on subsequent hypoxia tolerance and swimming performance in goldfish (Carassius auratus). J Exp Biol. 2011;214:2080–2088. doi:10.1242/jeb.053132
- Wood CM. The fallacy of the Pcrit - are there more useful alternatives? J Exp Biol. 2018;221:jeb163717. doi:10.1242/jeb.163717
- Epstein S, Zeiri L. Oxygen and carbon isotopic compositions of gases respired by humans. Proc Natl Acad Sci USA. 1988;85:1727–1731. doi:10.1073/pnas.85.6.1727
- Luz B, Barkan E. The isotopic composition of atmospheric oxygen. Glob Biogeochem Cycl. 2011;25:GB3001.
- Venkiteswaran JJ, Schiff SL, Wassenaar LI. Aquatic metabolism and ecosystem health assessment using dissolved O2 stable isotope diel curves. Ecol Appl. 2008;18:965–982. doi:10.1890/07-0491.1
- Miller MF, Pack A. Why measure 17O? Historical perspective, triple-isotope systematics and selected applications. Rev Mineral Geochem. 2021;86:1–34. doi:10.2138/rmg.2021.86.01
- Juranek LW, Quay PD. Using triple isotopes of dissolved oxygen to evaluate global marine productivity. Annu Rev Mar Sci. 2013;5:503–524. doi:10.1146/annurev-marine-121211-172430
- Ash JL, Hu H, Yeung LY. What fractionates oxygen isotopes during respiration? Insights from multiple isotopologue measurements and theory. ACS Earth Space Chem. 2019;4:50–66. doi:10.1021/acsearthspacechem.9b00230
- Tian G, Klinman JP. Discrimination between 16O and 18O in oxygen binding to the reversible oxygen carriers hemoglobin, myoglobin, hemerythrin, and hemocyanin: a new probe for oxygen binding and reductive activation by proteins. J Am Chem Soc. 1993;115:8891–8897. doi:10.1021/ja00073a001
- Zanconato S, Cooper DM, Armon Y, et al. Effect of increased metabolic rate on oxygen isotopic fractionation. Respir Physiol. 1992;89:319–327. doi:10.1016/0034-5687(92)90090-J
- Grøtan K, Østbye K, Taugbøl A, et al. No short-term effect of salinity on oxygen consumption in threespine stickleback (Gasterosteus aculeatus) from fresh, brackish, and salt water. Can J Zool. 2012;90:1386–1393. doi:10.1139/cjz-2012-0121
- Chabot D, Steffensen JF, Farrell AP. The determination of standard metabolic rate in fishes. J Fish Biol. 2016;88:81–121. doi:10.1111/jfb.12845
- Regan MD, Gill IS, Richards JG. Metabolic depression and the evolution of hypoxia tolerance in threespine stickleback, Gasterosteus aculeatus. Biol Lett. 2017;13:20170392. doi:10.1098/rsbl.2017.0392
- Prokkola JM, Nikinmaa M, Lubiana P, et al. Hypoxia and the pharmaceutical diclofenac influence the circadian responses of three-spined stickleback. Aquat Toxicol. 2015;158:116–124. doi:10.1016/j.aquatox.2014.11.006
- Altieri AH, Gedan KB. Climate change and dead zones. Glob Change Biol. 2015;21:1395–1406. doi:10.1111/gcb.12754
- Barth JAC, Tait A, Bolshaw M. Automated analyses of 18O/16O ratios in dissolved oxygen from 12-mL water samples. Limnol Oceanogr Meth. 2004;2:35–41. doi:10.4319/lom.2004.2.35
- Kiddon J, Bender ML, Orchardo J, et al. Isotopic fractionation of oxygen by respiring marine organisms. Glob Biogeochem Cycl. 1993;7:679–694. doi:10.1029/93GB01444
- Mader M, Schmidt C, van Geldern R, et al. Dissolved oxygen in water and its stable isotope effects: A review. Chem Geol. 2017;473:10–21. doi:10.1016/j.chemgeo.2017.10.003
- Rummer JL, McKenzie DJ, Innocenti A, et al. Root effect hemoglobin may have evolved to enhance general tissue oxygen delivery. Science. 2013;340:1327–1329. doi:10.1126/science.1233692
- Widory D. Oxygen and nitrogen isotopic fractionations during human respiration. CR Biol. 2004;327:729–734. doi:10.1016/j.crvi.2004.07.001
- Root R, Irving L. The effect of carbon dioxide and lactic acid on the oxygen-combining power of whole and hemolyzed blood of the marine fish Tautoga onitis (Linn.). Biol Bull. 1943;84:207–212. doi:10.2307/1538003