
ABSTRACT
Iron deficiency is a public health problem that affects all age groups. Its main consequence is anemia, but it can also affect cognitive functions. Although the negative effects of iron deficiency on cognitive function have been extensively described, the underlying mechanism has not been fully investigated. Thus, to gain an unbiased insight into the effects of iron deficiency (ID) on discrete brain regions, we performed a proteomic analysis of the striatum and hippocampus of adult rats subjected to an iron restricted (IR) diets for 30 days. We found that an IR diet caused major alterations in proteins related to glycolysis and lipid catabolism in the striatum. In the hippocampus, a larger portion of proteins related to oxidative phosphorylation and neurodegenerative diseases were altered. These alterations in the striatum and hippocampus occurred without a reduction in local iron levels, although there was a drastic reduction in liver iron and ferritin. Moreover, the IR group showed higher fasting glycaemia than the control group. These results suggest that brain iron content is preserved during acute iron deficiency, but the alterations of other systemic metabolites such as glucose may trigger distinct metabolic adaptations in each brain region. Abnormal energy metabolism precedes and persists in many neurological disorders. Thus, altered energy metabolism can be one of the mechanisms by which iron deficiency affects cognitive functions.
Introduction
Iron is an essential micronutrient for vital functions such as oxygen transport and cellular respiration [Citation1]. In the central nervous system (CNS), it also participates in metabolism of neurotransmitters and myelination of neurons [Citation1]. Iron uptake into the CNS occurs mainly through the transferrin receptor (TfR) located on endothelial cells that compose the blood brain barrier (BBB) [Citation2]. The end-feet of astrocytes that are in contact with BBB assist the iron uptake as well as the transport of other macro and micronutrients [Citation2]. On the other hand, how iron is excreted from the brain is not well understood and it appears to accumulate during aging in discrete brain regions [Citation1].
Iron deficiency (ID) is the most common nutritional deficiency and can affect all age groups. Although the main consequence of ID is anemia, insufficient iron can also affect cognitive functions and generate behavioral changes even before the manifestation of anemia [Citation3,Citation4]. The mechanism that produces this cognitive impairment has been linked to altered dopaminergic neurotransmission [Citation5,Citation6]. Dietary iron restriction can also reduce dopamine metabolite, DOPAC and HVA, in the striatum, but not in hippocampus [Citation7]. Moreover, altered iron metabolism induced by genetic modifications results in oxidative imbalance and failure of cellular respiration in dopaminergic circuitry [Citation8]. Thus, alterations in the dopaminergic system can contribute to the poor cognitive performance of iron deficient individuals.
However, different brain areas have distinct neurochemistry and play distinct roles in cognitive functions. Moreover, given the essential roles of iron in energy metabolism, it is plausible to speculate that ID may produce broader effects on brain functions beyond the dopaminergic system, and these effects may vary depending on the brain regions. In fact, dietary iron restriction has been shown to increase lipid peroxidation in the hippocampus but not in striatum [Citation7]. Increased production of reactive oxygen species (ROS) can damage cell components, leading to the development of several diseases. Indeed, most sporadic neurodegenerative diseases are believed to occur due to the excessive formation of ROS [Citation9].
As described above, the striatum and hippocampus have distinct responses to dietary iron restriction regarding dopamine metabolism and lipid peroxidation [Citation7]. In order to better understand these region-specific responses to iron deficiency, we performed an unbiased proteomic analysis of these brain regions in three-month-old rats subjected to an iron restricted (IR) diet. Our data showed that an IR diet induced distinct protein profiles in each region with major changes in metabolic enzymes. These alterations occurred without changes in local iron levels. However, hyperglycemia was observed in the IR group, suggesting that during acute iron deficiency, alterations in systemic metabolites can influence brain metabolism.
Methods
Dietary iron restriction
Three-month-old male Wistar rats weighing 253–371 g were obtained from the Center for Development of Experimental Medicine and Biology (CEDEME, UNIFESP, Brazil). The animals were randomly distributed in two groups: a control group (CTL) fed with a normal diet containing 45 ppm of iron and the iron deficient group (IR) fed with restricted diet containing only ∼3 ppm of iron. The feed for the animals was purchased from Research Diets Inc, USA (cat # D100012G and D0372501N), and details about its composition are included at the end of the supplementary information. The animals were housed in a temperature-controlled room (23 ± 2°C) with a 12/12 light/dark cycle, and had free access to water and food during the 4-week feeding period. The food was removed 2 h prior to euthanasia. All experimental procedures were approved by the Research Ethics Committee of UNIFESP (CEUA N° 9806251113) and performed in accordance with the Guide for the Care and Use of Laboratory Animals – National Research Council, NIH Publication NO85-23 (2011 revision).
Tissue collection
Rats were euthanized by decapitation and the whole brain was collected. Using a brain slicer matrix, the striatum and hippocampus were collected. Brain areas were recognized using a brain atlas [Citation10]. Blood samples were collected and centrifuged at 1500 g for 10 min at room temperature. Livers were cannulated and perfused with 20 mL of PBS containing enoxaparin (4 μg/mL). After tissue exsanguination, the medial fragment of the left lateral lobe was collected for analysis.
Glycaemia
Blood glucose levels were measured using Accu-Check Active (Roche).
Red blood cell count
Blood samples were collected with EDTA, and further diluted (1:400) with sodium citrate (150mM) containing 0.8% formaldehyde. The erythrocytes were counted using Neubauer hemocytometer.
Iron levels
Tissues were homogenized in PBS, heated at 75°C for 10 min and centrifuged at 1600 g for 10 min. 30 µl of the supernatants were mixed with 30 µl precipitation solution (1N HCl and 10% trichloroacetic acid) and heated at 95°C for 1 h. Samples were cooled to room temperature, vortexed and centrifuged at 1600 g for 10 min. The supernatants were then mixed with chromogen solution (0.508 mmol/l ferrozine, 1.5 mol/l sodium acetate, 1.5% thioglycolic acid) and incubated for 30 min at room temperature. Finally, absorbance was measured at 562 nm.
Western blot analysis
Tissues were homogenized in lysis buffer [Tris 50 mM pH 8, NaCl 150 mM, EDTA 10 mM, triton-x100 1%, Sodium deoxycholate 0.5%, complete™ Protease Inhibitor Cocktail (Roche), Phosphatase Inhibitor Cocktail set II (Millipore)] and centrifuged at 3000 g for 5 min to collect the post-nuclear supernatant. Following SDS-PAGE, proteins were transferred to PVDF membrane, which was incubated with TBST (NaCl 150 mM, Tris 50 mM, pH 7.4, Tween-20 0.1%) supplemented with 5% BSA for 1 h. Proteins of interest were detected using primary antibodies (supplementary information), HRP- conjugated secondary antibodies and Luminata Forte Western HRP substrate (Millipore). Digital images of membranes were acquired using the Alliance Mini gel documentation system (UVITEC). Ponceau S staining was used as the loading control [Citation11]. Each protein of interest was analyzed in two gels. A distinct set of eight biological samples was loaded in each gel (4 CTL and 4 IR). Thus, each group had eight biological samples loaded in two gels. To correct gel-to-gel variation, Ponceau-normalized data were further divided by the mean of the CTL samples assayed in the same gel. When each biological sample was assayed in duplicate, the mean of the technical replicates was shown as the final result. All normalizations performed for western blot data analysis are shown in Table S1.
Sample preparation of proteomic analysis
Tissues were homogenized in lysis buffer (50mM NH4HCO3, 1% sodium deoxycholate and protease inhibitors), and then centrifuged for 30 min at 14,000g and 4°C. Proteins of supernatants (200 µg) were diluted in 500 µl of NH4HCO3 (50 mM) containing 5 mM of DTT. After incubation for 30 min at 60°C, 10 mM of iodoacetoamide was added and further incubated for an additional 30 min in the dark. Proteins were digested with trypsin (Promega) overnight at 37°C. After digestion, the samples were centrifuged at 14,000 g for 15 min at 4°C. Supernatants were filtered through 0.22μm centrifugal filters for 4 min at 12000 g, and then transferred to glass vials for LC-MS/MS analysis.
Mass spectrometry
The LC-MS/MS analyses were performed in nanoAcquity UPLC (Waters) coupled to a Synapt G2 HDMS mass spectrometer (Waters). Samples were injected into a trap column (180 × 20 mm nanoAcquity trap Symmetry column, Waters) with flow of 8 μl/min of phase A (0.1% formic acid) for 5 min. Peptides were then eluted in a capillary analytical column (C18 nanoAcquity BEH 75 μm × 150 mm, 1.7 μm particles, Waters) with a gradient of 7–35% of phase B (0.1% formic acid in acetonitrile) at 275 nl/min for 90 min. MS data were acquired in data independent HDMSE mode with ion mobility separation. Collision energies were alternated between low (4 eV) and high (ramped from 19 to 45 eV), 1.25 s each. Glu-fibrinopeptide B (Peptide 2.0) was infused by a nano-Lockspray source and scanned every 60 s for external calibration.
Proteomic data analysis
Raw data were processed with ProteinLynx Global Server 3.0.1 (Waters). The database searches were performed with Rattus norvegicus sequences obtained from UniprotKB (www.uniprot.org, 9485 revised sequences) using the following parameters: carbamidomethylation of cysteines as fixed modification, oxidation of methionines, acetylation of N-terminal proteins and deamidation of asparagines and glutamines as variable modifications, loss of up to two trypsin cleavages and automatic configuration for mass tolerances of precursor ions and fragments [Citation12]. The following criteria were set for protein identification: a minimum of one fragment ion per peptide, five fragment ions per protein and two peptides per protein. False discovery identification rates were set to 4%, estimated by a simultaneous search in reversed database. Label-free quantitative analyses were based on the intensities of the three most intense peptides of each protein [Citation13]. For each group (CTL or IR), three independent biological samples were analyzed in triplicate, totaling 9 LC-MS/MS runs per group. To generate the list of differentially expressed proteins, we only included those proteins that were detected in at least two biological samples of one of the groups. To be counted as detected protein in a biological sample, the protein had to be detected in at least two out of three technical replicates. These inclusion criteria were applied to minimize the false positive rate. After this initial selection of proteins, the mean of nine technical replicates of each group was compared using student’s t-test (Excel, 2010). This approach can take into account the random variations that may occur due to the experimental procedures. The mean protein level was considered significantly different between the groups when the p value was lower than 0.05. Correction for multiple comparisons was not performed to minimize false negative data [Citation14]. To assess the biological variations of each group, the protein level was calculated for each biological sample averaging respective technical replicates, and then, a 95% confidence interval (CI95) for each group was calculated (Tables S2 and S3). Protein levels were considered significantly different between the groups when their CI95 did not overlap [Citation15].
Analysis of pathways
Two different databases were employed to identify functionally related proteins: DAVID (https://david.ncifcrf.gov/) and STRING (https://string-db.org/). Differentially expressed proteins of each region were also manually grouped according to their function described in UniProt.
Statistical analysis
Non-parametric tests can be used for studies with a small sample size independent of the distribution shape, because non-parametric tests show similar statistical power for normal or skewed data when the samples size is small, typically <25 [Citation16]. Thus, iron levels, western blot, glycaemia and red blood cell count data were analyzed using non-parametric Mann–Whitney U-Tests (GraphPad Prism 5).
Results
Iron status
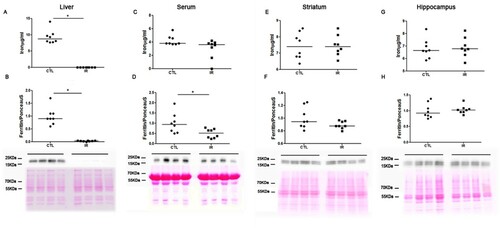
During the experimental period, the amount of chow consumed in each cage and the body weight of each animal were recorded. These data showed that both the CTL and IR groups consumed similar amount of chow, and the animals of both groups showed equal body weight variation during the experimental period (Fig. S1). Animals fed with an IR diet presented reduced levels of iron and ferritin in the liver compared to the CTL animals ((A,B)). In serum, iron levels were not changed but ferritin levels were reduced in the IR group ((C,D)). In the striatum and hippocampus, both the iron and ferritin levels of the IR group were similar to the CTL ((E–H)). Uncropped images of the ferritin membranes are shown in Fig. S2. Other proteins such as transferrin receptor (TfR), ferroportin (FPN) and divalent metal transporter 1 (DMT1) were not altered in the liver, striatum and hippocampus (Fig. S3 and S4). These data indicate that our protocol established a mild iron deficient condition [Citation17].
Figure 1. Iron Metabolism. (A, C, E and G) Total amount of iron in the liver, serum, striatum and hippocampus of the CTL and IR groups was measured using ferrozine-based colorimetric assay. (B, D, F and H). Levels of ferritin were determined by western blotting. Relative ferritin levels were calculated normalizing the intensity of ferritin bands by the intensity of Ponceau S staining. Each dot represents the result of an animal and horizontal lines represent median of the group (n = 8 per group). *p < 0.05.
Proteomic analysis
To investigate how dietary iron restriction affects the striatum and hippocampus, a proteomic analysis was performed. In the striatum, 740 unique proteins were detected. However, only proteins that were detected in at least two biological samples were considered for further analysis (see detailed inclusion criteria in Methods). Application of these criteria resulted in 533 unique proteins. About one-fifth of these proteins were involved in metabolic pathways (Fig. S5, left panel). Proteins involved in neurodegenerative diseases, intracellular signaling and synapses were also relatively abundant (Fig. S5, left panel). In the hippocampus, 586 unique proteins were detected, but using the same inclusion criteria, 403 proteins were considered for further analysis. Functional annotation of these proteins generated similar categories as those found in the striatum (Fig. S5, right panel).
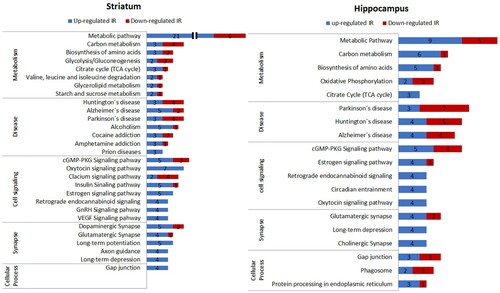
In the striatum, 91 out of 533 proteins were differentially expressed between the CTL and IR groups. In the hippocampus, 59 out of 403 proteins were differentially expressed between the groups. The profile of the differentially expressed proteins was analyzed using the DAVID and STRING databases [Citation18] (). Since these computational analyses did not comprise all input proteins, we also manually categorized the proteins based on the description of their functions available in Uniprot (Tables S2 and S3). In all three analyses, relatively larger number of proteins altered in the IR group was categorized into metabolic pathways in both the striatum and hippocampus.
Figure 2. Profile of differentially expressed proteins in the striatum and hippocampus. The profile of proteins that were differentially expressed between the CTL and IR groups was analyzed using the DAVID and STRING databases, and the pathways identified in both databases were presented in bar graphs. Each pathway was further manually grouped into metabolism, disease, cell signaling, synapse, and cellular process. Blue bars indicate the number of proteins that were increased and red bars indicate the number of proteins that were reduced with the IR diet. For each group (CTL or IR), three independent biological samples were analyzed in triplicate, totaling 9 LC-MS/MS runs per group.
Regarding energy metabolism of the striatum, IR increased glycogen phosphorylase (PYGB) and phosphofructokinase (PFKP), but reduced glucose-6-phosphate isomerase (GPI), triose-phosphate isomerase (TPI) and glyceraldehyde dehydrogenase (GAPDH), indicating alterations in the glycolytic pathway (, left panel and Table S2). On the other hand, 3-hydroxyacyl-CoA dehydrogenase (HSD17B10) that participates in β-oxidation and enzymes of the initial steps of the tricarboxylic acid cycle (TCA) such as citrate synthase (CS) and mitochondrial isocitrate dehydrogenase (IDH3B) were increased, suggesting that an IR diet promotes the use of fatty acid in striatum ( left panel and Table S2). Induction of other enzymes that participate in lipid catabolism such as monoglyceride lipase, mitochondrial glycerol-3-phosphate dehydrogenase and very-long-chain 3-oxoacyl-CoA reductase in the IR group corroborates increased fatty acid consumption following insufficient iron intake (Table S2). The IR diet reduced mitochondrial malate dehydrogenase (MDH2) and voltage-dependent anion channel (VDAC), which mediates the exchange of metabolites such as pyruvate, malate, succinate, NADH and ATP/ADP between mitochondria and cytosol [Citation19] ( left panel and Table S2). In addition, an increase in non-catalytic subunit of complex I (NDUFA5) and a decrease in ATP synthase subunit d (ATP5H) were observed in the striatum of the IR group ( left panel and Table S2), suggesting that mitochondrial activity might have been altered by the IR diet. However, it was also noticeable that the IR diet increased antioxidant molecules such as superoxide dismutase 2 (SOD2), glutathione-s-transferase (GSTµ3) and peroxiredoxin-6 (PRDX6), and enzymes that participate in the clearance of toxic metabolites such as aldehyde dehydrogenase (ALDH1B1) ( left panel and Table S2).
Figure 3. Diagram of metabolic alterations observed in the IR group. The diagrams show the sets of metabolic enzymes and mitochondrial proteins altered in the striatum (left panel) and in the hippocampus (right panel) of IR group. Dotted arrows between the metabolic intermediates represent multiple steps of the pathway. Proteins that were increased with the IR diet are shown in green and proteins that were reduced are shown in red.
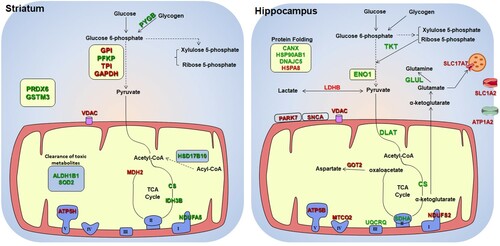
In the hippocampus of the IR group, transketolase (TKT) and alpha-enolase (ENO1) were increased (, right panel and Table S3). This pattern can occur when glucose metabolism via the pentose-phosphate pathway is increased. The IR diet also altered enzymes that participate in the astrocyte-neuron lactate shuttle mechanism that includes L-lactate dehydrogenase (LDHB), aspartate aminotransferase (GOT2), glutamine synthetase (GLUL), sodium/potassium-transporting ATPase (ATP1A2), vesicular glutamate transporter 1 (SLC17A7) and excitatory amino acid transporter 2 (SLC1A2) (, right panel and Table S3). In , these alterations were schematized in a single cell, but some of these alterations can be specific to neurons or astrocytes [Citation20]. The hippocampus of IR group also showed increased levels of succinate dehydrogenase flavoprotein (SDHA) and cytochrome b-c1 complex subunit 8 (UQCRQ), and reduced levels of NADH dehydrogenase iron-sulfur protein 2 (NDFS2), cytochrome c oxidase subunit 2 (MTCO2) and ATP synthase subunit β (ATP5B) (, right panel and Table S3). These proteins are components of the electron transport chain. We also observed increased molecular chaperons such as calnexin (CANX), DnaJ homolog subfamily C member 5 (DNAJC5) and heat shock protein 90 (HSP90AB1). As in the striatum, VDAC was decreased in the hippocampus of the IR group, but a reduction of Parkinson disease protein 7 (PARK7) and alpha-synuclein (SNCA) was observed only in the hippocampus of the IR group (, right panel and Table S3). These proteins are closely linked to Parkinson's disease.
Among the differentially expressed proteins (Table S2 and S3), myelin proteolipid protein (PLP1) and tyrosine hydroxylase (TH) of the striatum, and NDFS2 and MTCO2 of the hippocampus are iron (or heme) dependent proteins. All three proteins except TH were reduced in the IR group.
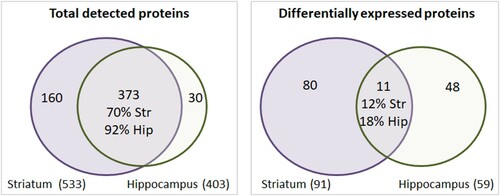
Although the overall proteins detected in both the striatum and hippocampus showed a similar profile with a 70–92% overlap, the sets of differentially expressed proteins of each region were considerably divergent, reinforcing the fact that each region showed distinct adaptive responses to dietary iron restriction (). Citrate synthase and signaling molecules that integrate multiple pathways such as mitogen-activated protein kinase 1 (MAPK1) and guanine nucleotide-binding protein G(i) (GNAI2) were among the proteins regulated by iron restriction in both regions (Table S4).
Figure 4. Comparison between the striatum and hippocampus. The left Venn diagram was plotted using the total proteins detected in each region independent of experimental group. A large intersection indicates that both regions expressed a similar set of proteins. The right diagram was constructed using the list of proteins that were differentially expressed between the CTL and IR groups. A smaller intersection indicates that each region elicited distinct responses to dietary iron restriction. Str: striatum. Hip: hippocampus.
Comparison between proteomic analysis and western blot
The expression levels of proteins involved in carbon metabolism, oxidative phosphorylation, neurodegenerative diseases and signaling were also evaluated by western blot using a distinct set of biological samples. In the striatum 4 of 12 proteins showed similar results in both approaches, confirming unchanged levels of MTCO2, SDHA and PARK7 and increased levels of MAPK1 in the IR group ( and Fig. S6 and S7). In the hippocampus, 7 of 12 proteins showed similar results in both approaches: unchanged levels of PFKP, ATP5H, SOD2, increased MAPK1 levels and reduced levels of MTCO2, VDAC and PARK7 in the IR group were confirmed by western blot ( and Fig. S8 and S9). Thus, hippocampus-specific reduction of MTCO2 and PARK7, and the alteration of MAPK1 in both regions were confirmed by both techniques.
Table 1. Comparison between proteomic analysis and western blotting.
Systemic glucose levels and red blood cells
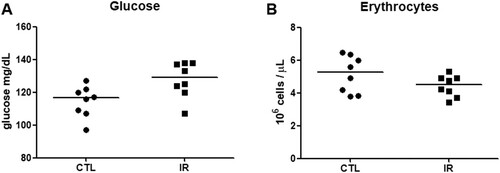
Our proteomic analysis showed that the IR diet changed the levels of proteins involved in energy metabolism of the striatum and hippocampus, although their iron and ferritin levels were not affected. Disturbed iron metabolism can alter glucose metabolism and erythropoiesis, which in turn can influence the aerobic metabolism [Citation21]. Thus, we measured systemic glucose levels and counted the red blood cells in our samples. The IR diet increased glycaemia, but did not significantly alter the red blood cell count (). Thus, alteration in glycaemia induced by the IR diet might influence the energy metabolism of brain tissues. Although the result of the red blood cell count can indicate the absence of anemia, the lack of an assessment of hemoglobin levels and mean corpuscular volume can be a limitation for this conclusion.
Figure 5. Glycaemia and red blood cell count. (A) Blood glucose levels of the CTL and IR group were measured using an Accu-Chek Active glucometer (n = 8 per group). (B) Red blood cells of the CTL and IR groups were counted using a Neubauer chamber (N = 8 per group). Each dot represents the result of an animal and the horizontal lines represent the median of the group. *p < 0.05.
Discussion
Iron participates in several metabolic processes, and disturbance of its homeostasis can establish conditions that promote diseases. Numerous studies have demonstrated that systemic ID can affect cognitive function of both animals and humans of various age groups [Citation4,Citation3,Citation22]. It is also well known that ID alters neurotransmission, especially the dopaminergic system [Citation5,Citation23]. Moreover, ID manifested during the gestational period can affect the brain development of offspring, altering the protein profile related to glutamatergic neurotransmission and intracellular signaling. Also, the hippocampus of these offspring shows higher vulnerability to hypoxic insults [Citation24]. Similar vulnerability also occurs in adult animals subjected to dietary iron restriction [Citation7]. However, the underlying mechanism that explains this selective vulnerability has not yet been elucidated. Therefore, to gain an unbiased insight into the molecular changes induced by ID, we performed proteomic analysis of the striatum and hippocampus of rats subjected to IR diets. Our data indicate that an IR diet induces distinct protein profiles in the striatum and hippocampus.
In the striatum, several glycolytic enzymes were reduced while enzymes that participate in lipid catabolism and TCA cycle were increased. This profile allows speculation that use of fatty acid for energy production increased in the striatum of the IR group. This adaptive response to ID appears to be contradictory at first glance, since the oxidation of fatty acid occurs in mitochondria and iron is an essential element for mitochondrial activities. However, we observed that the iron level of the striatum was preserved in the IR group, suggesting that iron would not be a limiting factor for mitochondrial activities in this case. It is the consensus that glucose is the preferable energy fuel for brain cells, but increasing evidence shows that β-oxidation can also significantly contribute to energy production in the brain. β-oxidation appears to be particularly important for astrocytes, which assist active neurons [Citation20]. However, increased use of fatty acid can increase ROS production. Thus, the increase of anti-oxidant proteins observed in the striatum of the IR group might be another adaptive mechanism to minimize the negative effects of fatty acid catabolism.
In the hippocampus, many components of the electron transport chain were altered. Given that oxidative phosphorylation is one of the main sources of ROS production, it is plausible to speculate that the hippocampus is more prone to suffer oxidative stress. Our proteomic data also showed that the IR diet increased molecular chaperones which can facilitate the clearance of misfolded proteins, which in turn, can be produced in an oxidative environment. Thus, the protein profile established in the hippocampus of the IR group appears to resemble an unhealthy environment for cell survival, and some alterations are similar to those that have been observed in neurodegenerative diseases. For example, the IR diet reduced MTCO2 levels and a similar pattern was also observed in the hippocampus of patients with Alzheimer's disease [Citation25]. Moreover, we observed a reduction in PARK7 which plays a neuroprotective role against oxidative stress, and a reduction in α-synuclein that has multiple functions in neurons. Both proteins participate in the homeostasis of mitochondria and are related to Parkinsońs diseases [Citation26,Citation27]. Thus, chronic dietary iron restriction can affect the mitochondrial activities of the hippocampus despite the maintenance of iron content in the region. This protein profile can also support the increased lipid peroxidation observed in a previous study [Citation7].
We attempted to confirm some of these proteomic data by western blot, but we observed a certain degree of discrepancy between the results obtained by the two different approaches. Distinct methods used for sample preparation, different algorithms for protein quantification, the diversity of each biological sample and inherent experiment-to-experiment variability of p values might have contributed to some of the discrepancy observed between the two approaches [Citation28]. However, most of discrepancy can be accounted for by the significance of statistical test, which can be influenced by effect size and variability of the data. In this respect, we could observe that more proteins among those selected for WB analysis showed a greater effect size in the hippocampus, whereas more proteins showed a higher coefficient of variation in the IR group of striatum (Fig. S10). These factors can explain to some extent the higher rate of validation in the hippocampus. In the hippocampus, most of the data obtained by both techniques showed similar trends when we observe the mean differences between the groups regardless of the statistical significance (Fig. S11). Although the western blot data can induce some bias into the proteomic analysis, most of proteomic data were interpreted based on the expression profile of multiple proteins of the same pathways, which can increase the robustness of the results. Despite the possible influence of these factors, western blot results confirmed some important conclusions drawn from the proteomic analysis, such as the hippocampus-specific reduction in MTCO2 and PARK7, and alteration of MAPK1 in both regions.
Systemic iron can be excreted through sweat, skin sloughing and occasional bleeding. But how brain iron is excreted is not well elucidated, ferroportin being the only known iron exporter from brain cells [Citation2]. Nevertheless, iron excretion from the brain does not appear to be efficient since iron accumulate in discrete regions of the brain during aging [Citation29]. In neonatal or young animals, iron-restricted diet can reduce brain iron, but usually this reduction occurs to a lesser extent compared to liver iron loss, indicating that the turnover of brain iron is slower. The degree of iron loss also varies a lot depending on the brain region. For instance, a study by Erikson (1997) in 21-day-old rats showed that the hippocampus is one of the regions that have higher levels of iron compared to other regions, but two weeks of dietary iron restriction drastically reduces the iron levels in this region. On the other hand, the study reported that the striatum (that has a comparatively lower amount of iron) was not significantly affected by dietary iron restriction [Citation29]. This difference between the hippocampus and the striatum appears to be attenuated with aging [Citation30]. Thus the conservation of brain iron is a region-specific and age-dependent phenomenon. Since we used adult rats, an iron restricted diet might have had less effect on iron and ferritin levels in the striatum and hippocampus.
These observations lead to another question about the mechanisms by which the systemic ID altered the protein profile in the hippocampus and striatum of the IR group. One factor that can affect brain metabolism is energy intake. However, both the CTL and IR diets used in this study were manufactured with purified macro and micronutrients according to the AIN-93G formula which is a revised version of AIN-76. Thus, the variation of nutritive content between the diets is considered minimal, the presence of ferric citrate in the CTL diet being the only difference. Moreover, the chow consumption and the body weight variation did not differ between the groups. Hence, the metabolic alterations observed in both brain regions did not occur due to the different energy intakes.
A previous study has shown that neonatal rats born to a ID mother showed increased levels of iron regulatory proteins (IRPs) [Citation31]. These proteins can regulate glycolysis and oxidative phosphorylation by controlling the expression level of hypoxia inducible factor 1 (HIF-1) [Citation32]. In this study, we did not evaluate HIF-1 expression, but we observed that the levels of neuroglobin were not altered by the IR diet (Fig. S12). Given that the expression of neuroglobin is induced by hypoxia, we can presume that HIF-1 was not induced in the IR group. The preservation of the number of red blood cells in the IR group can also support this assumption. Moreover, the levels and/or activity of IRPs are primarily regulated by iron availability. Since our results indicated that the levels of iron and related proteins were not altered in the striatum and in hippocampus, the altered energy metabolism observed in these regions is unlikely related to the altered activity of IRPs or iron homeostasis.
On the other hand, MAPK 1, which is known to mediate multiple cellular processes, can also regulate metabolic events. For instance, pathological axonal degeneration requires the activation of the MAPK1 cascade, which can then trigger the local energy deficit, probably by disrupting glycolysis and ATP production [Citation33]. Thus, alterations in MAPK1 might be related to metabolic adaptations observed in the striatum and hippocampus of the IR group.
Additionally, we observed that the IR diet increased serum glucose levels. Hyperglycemia in iron deficient conditions has been also observed in 21- day-old rats subjected to a 4–6 week of iron restricted diet [Citation21]. Systemic hyperglycemia appears to reduce the level of glucose transporter 1 (GLUT1), impairing brain glucose uptake and decreasing high-energy phosphate levels [Citation34]. But gestational ID is known to increase GLUT1 and glucose levels in the striatum in offspring [Citation35–37]. Altered metabolites of glycolysis and the TCA cycle were also observed in the cerebrospinal fluid of iron deficient infant monkeys prior to the manifestation of anemia, and these alterations persisted even after the normalization of hematological parameters [Citation38]. These data indicate that ID can alter brain glucose uptake, although there is an age-dependent difference. Moreover, these data suggest that the altered brain energy metabolism can be a secondary consequence of ID associated with changes in circulating metabolites.
Energy metabolism in the CNS is highly compartmentalized and each cell type plays specific roles metabolizing distinct sets of substrates [Citation20]. In our study, several proteins involved in the lactate shuttle mechanism between neurons and astrocytes were altered in the hippocampus of the IR group. A previous study has demonstrated that maternal ID impaired the maturation of astrocytes in offspring, suggesting that ID can impair the metabolic support provided by astrocytes for neuronal synaptic function [Citation39]. Although this study appears to support our findings, it would be challenging to predict a simple scenario based on the protein profiles obtained from whole tissue without cell sorting. Nevertheless, our findings demonstrated that even mild iron deficiency was able to alter proteins related to energy metabolism in both the striatum and hippocampus in a region-specific manner. These region-specific alterations might have occurred due to the distinct glucose metabolism required for each brain region [Citation40]. This distinct metabolism can confer an additional level of diversity and complexity to the outcomes caused by ID on brain functions. Thus, age, neurochemistry and local energy metabolism of each brain area can be important factors that define the impact of ID.
Moreover, given that abnormal energy metabolism precedes and persists in several neurological disorders, the alterations observed in our study can provide additional insights into the mechanisms by which ID affects cognitive function. There is a lack of data in the current literature to prove that ID has negative effects on the cognitive function of adult animals, although in humans, even mild iron deficiency appears to alter behaviors and executive functions in adults [Citation41,Citation42]. Thus, the investigation of the effects of ID in adult animals can not only help to better understand the relationship between iron metabolism and brain function, but also provides valuable information about the neurological disorders linked to iron metabolism. Our study demonstrated that an IR diet alters the expression of several proteins such as PARK7, α-Synuclein and PLP1 that are related to neurodegenerative diseases. The reduction of PLP1 in particular has been associated with the loss of myelin integrity in the brain of patients with restless leg syndrome [Citation43]. A concomitant reduction in transferrin and ferritin in oligodendrocytes was also observed. However, our data indicate that the reduction in PLP1 can precede the reduction in TfR and ferritin in the striatum, probably due to the increased lipid catabolism promoted by an IR diet. Finally, these observations reinforce the notion that the diagnosis and clinical management of the asymptomatic iron deficiency should be improved to prevent further damage.
Supplemental Material
Download Zip (3.6 MB)Acknowledgements
We thank to Daniel Blanc Araujo for his contribution to production of figure 3.
Disclosure statement
No potential conflict of interest was reported by the author(s).
Data availability statement
Data supporting the findings are available within the paper and supplemental information. Raw data are available from the corresponding author upon request. All materials used in this study can be purchased from the companies indicated in methods section.
Additional information
Funding
Notes on contributors
Jessica M. V. Pino
Jessica M. V. Pino is postgraduate students at UNIFESP.
Erika S. Nishiduka
Erika S. Nishiduka is postgraduate students at UNIFESP.
Márcio H. M. da Luz
Márcio H. M. da Luz is postgraduate students at UNIFESP.
Vitória F. Silva
Vitória F. Silva is an undergraduate research trainee.
Hanna K. M. Antunes
Hanna K. M. Antunes is professor and researcher at UNIFESP.
Alexandre K. Tashima
Alexandre K. Tashima is professor and researcher at UNIFESP.
Pedro L. R. Guedes
Pedro L. R. Guedes is postgraduate students at UNIFESP.
Altay A. L. de Souza
Altay A. L. de Souza is professor and researcher at UNIFESP.
Kil S. Lee
Kil S. Lee is professor and researcher at UNIFESP.
References
- Youdim MBH. Brain iron deficiency and excess; cognitive impairment and neurodegenration with involvement of striatum and hippocampus. Neurotox Res. 2008;14:45–56. doi: https://doi.org/10.1007/BF03033574
- Simpson IA, Ponnuru P, Klinger ME, Myers RL, Devraj K, Coe CL, et al. A novel model for brain iron uptake: introducing the concept of regulation. J Cereb Blood Flow Metab. 2015;35:48–57. doi:https://doi.org/10.1038/jcbfm.2014.168.
- Yavuz BB, Cankurtaran M, Haznedaroglu IC, Halil M, Ulger Z, Altun B, et al. Iron deficiency can cause cognitive impairment in geriatric patients. J Nutr Health Aging. 2012;16:220–4. doi: https://doi.org/10.1007/s12603-011-0351-7
- Yehuda S, Youdim ME, Mostofsky DI. Brain iron-deficiency causes reduced learning capacity in rats. Pharmacol Biochem Behav. 1986;25:141–4. doi:https://doi.org/10.1016/0091-3057(86)90244-3.
- Beard JL, Chen Q, Connor J, Jones BC. Altered monamine metabolism in caudate-putamen of iron-deficient rats. Pharmacol Biochem Behav. 1994;48:621–4. doi: https://doi.org/10.1016/0091-3057(94)90323-9
- Erikson KM, Jones BC, Beard JL. Iron deficiency alters dopamine transporter functioning in rat striatum. J Nutr. 2000;130:2831–7. doi:https://doi.org/10.1093/jn/130.11.2831.
- Pino JMV, da Luz MHM, Antunes HKM, Giampá SQC, Martins VR, Lee KS, et al. Iron-restricted diet affects brain ferritin levels, dopamine metabolism and cellular Prion protein in a region-specific manner. Front Mol Neurosci. 2017;10:145. doi:https://doi.org/10.3389/fnmol.2017.00145.
- Matak P, Matak A, Moustafa S, Aryal DK, Benner EJ, Wetsel W, et al. Disrupted iron homeostasis causes dopaminergic neurodegeneration in mice. Proc Natl Acad Sci USA. 2016;113:3428–35. doi:https://doi.org/10.1073/pnas.1519473113.
- Chong ZZ, Li F, Maiese K. Oxidative stress in the brain: novel cellular targets that govern survival during neurodegenerative disease. Prog Neurobiol. 2005;75:207–46. doi:https://doi.org/10.1016/j.pneurobio.2005.02.004.
- Franklin KBJ, Paxinos G. Paxinos and Franklin's The mouse brain in stereotaxic coordinates. 4th ed. Cambridge: Academic Press, an imprint of Elsevier; 2013.
- Fosang AJ, Colbran RJ. Transparency is the key to quality. J Biol Chem. 2015;290:29692–94. doi:https://doi.org/10.1074/jbc.E115.000002.
- Pedroso AP, Souza AP, Dornellas APS, Oyama LM, Nascimento CMO, Santos GMS, et al. Intrauterine growth restriction programs the hypothalamus of adult male rats: integrated analysis of proteomic and metabolomic data. J Proteome Res. 2017;16:1515–25. doi:https://doi.org/10.1021/acs.jproteome.6b00923.
- Silva JC, Gorenstein MV, Li GZ, Vissers JP, Geromanos SJ. Absolute quantification of proteins by LCMSE: a virtue of parallel MS acquisition. Mol Cell Proteomics. 2006;5:144–56. doi:https://doi.org/10.1074/mcp.M500230-MCP200.
- Pascovici D, Handler DC, Wu JX, Haynes PA. Multiple testing corrections in quantitative proteomics: a useful but blunt tool. Proteomics. 2016;16:2448–53. doi:https://doi.org/10.1002/pmic.201600044.
- Cumming G, Fidler F, Vaux DL. Error bars in experimental biology. J Cell Biol. 2007;177:7–11. doi:https://doi.org/10.1083/jcb.200611141.
- Kitchen CM. Nonparametric vs parametric tests of location in biomedical research. Am J Ophthalmol. 2009;147:571–72. doi:https://doi.org/10.1016/j.ajo.2008.06.031.
- Skikne BS, Flowers CH, Cook JD. Serum transferrin receptor: a quantitative measure of tissue iron deficiency. Blood. 1990;75:1870–76. doi: https://doi.org/10.1182/blood.V75.9.1870.1870
- Huang da W, Sherman BT, Lempicki RA. Systematic and integrative analysis of large gene lists using DAVID bioinformatics resources. Nat Protoc. 2009;4:44–57. doi:https://doi.org/10.1038/nprot.2008.211.
- Shoshan-Barmatz V, Mizrachi D. VDAC1: from structure to cancer therapy. Front Oncol. 2012;2:164. doi:https://doi.org/10.3389/fonc.2012.00164.
- Panov A, Orynbayeva Z, Vavilin V, Lyakhovich V. Fatty acids in energy metabolism of the central nervous system. BioMed Res Int. 2014: 472459. doi:https://doi.org/10.1155/2014/472459
- Borel MJ, Smith SH, Brigham DE, Beard JL. The impact of varying degrees of iron nutriture on several functional consequences of iron deficiency in rats. J Nutr. 1991;121:729–36. doi:https://doi.org/10.1093/jn/121.5.729.
- Blanton CA, Green MW, Kretsch MJ. Body iron is associated with cognitive executive planning function in college women. Br J Nutr. 2013;109:906–13. doi:https://doi.org/10.1017/S0007114512002620.
- Nelson C, Erikson K, Pinero DJ, Beard JL. In vivo dopamine metabolism is altered in iron-deficient anemic rats. J Nutr. 1997;127:2282–88. doi:https://doi.org/10.1093/jn/127.12.2282.
- Tran PV, Dakoji S, Reise KH, Storey KK, Georgieff MK. Fetal iron deficiency alters the proteome of adult rat hippocampal synaptosomes. Am J Physiol Regul Integr Comp Physiol. 2013;305:R1297–306. doi:https://doi.org/10.1152/ajpregu.00292.2013.
- Bosetti F, Brizzi F, Barogi S, Mancuso M, Siciliano G, Tendi EA, et al. Cytochrome c oxidase and mitochondrial F1F0-ATPase (ATP synthase) activities in platelets and brain from patients with Alzheimer's disease. Neurobiol Aging. 2002;23:371–76. doi: https://doi.org/10.1016/S0197-4580(01)00314-1
- Ellis CE, Murphy EJ, Mitchell DC, Golovko MY, Scaglia F, Barcelo-Coblijn GC, et al. Mitochondrial lipid abnormality and electron transport chain impairment in mice lacking alpha-synuclein. Mol Cell Biol. 2005;25:10190–201. doi:https://doi.org/10.1128/MCB.25.22.10190-10201.2005.
- Kahle PJ, Waak J, Gasser T. DJ-1 and prevention of oxidative stress in Parkinson's disease and other age-related disorders. Free Radical Biol Med. 2009;47:1354–61. doi:https://doi.org/10.1016/j.freeradbiomed.2009.08.003.
- Halsey LG, Curran-Everett D, Vowler SL, Drummond GB. The fickle P value generates irreproducible results. Nat Methods. 2015;12:179–85. doi:https://doi.org/10.1038/nmeth.3288.
- Erikson KM, Pinero DJ, Connor JR, Beard JL. Regional brain iron, ferritin and transferrin concentrations during iron deficiency and iron repletion in developing rats. J Nutr. 1997;127:2030–38. doi:https://doi.org/10.1093/jn/127.10.2030.
- Focht SJ, Snyder BS, Beard JL, Van Gelder W, Williams LR, Connor JR, et al. Regional distribution of iron, transferrin, ferritin, and oxidatively-modified proteins in young and aged Fischer 344 rat brains. Neuroscience. 1997;79:255–61. doi:https://doi.org/10.1016/s0306-4522(96)00607-0.
- Siddappa AJM, Rao RB, Wobken JD, Casperson K, Leibold EA, Connor JR, et al. Iron deficiency alters iron regulatory protein and iron transport protein expression in the perinatal rat brain. Pediatr Res. 2003;53:800–7. doi:https://doi.org/10.1203/01.PDR.0000058922.67035.D5.
- Li H, Liu Y, Shang L, Cai J, Wu J, Zhang W, et al. Iron regulatory protein 2 modulates the switch from aerobic glycolysis to oxidative phosphorylation in mouse embryonic fibroblasts. Proc Natl Acad Sci USA. 2019;116:9871–76. doi:https://doi.org/10.1073/pnas.1820051116.
- Yang J, Wu Z, Renier N, Simon DJ, Uryu K, Park DS, et al. Pathological axonal death through a MAPK cascade that triggers a local energy deficit. Cell. 2015;160:161–76. doi:https://doi.org/10.1016/j.cell.2014.11.053.
- Hwang JJ, Jiang L, Hamza M, Dai F, Belfort-DeAguiar R, Cline G, et al. Blunted rise in brain glucose levels during hyperglycemia in adults with obesity and T2DM. JCI Insight. 2017;2; doi:https://doi.org/10.1172/jci.insight.95913. doi: https://doi.org/10.1172/jci.insight.90508
- Ennis K, Felt B, Georgieff MK, Rao R. Early-life iron deficiency alters glucose transporter-1 expression in the adult Rodent hippocampus. J Nutr. 2019;149:1660–66. doi:https://doi.org/10.1093/jn/nxz100.
- Bastian TW, Santarriaga S, Nguyen TA, Prohaska JR, Georgieff MK, Anderson GW. Fetal and neonatal iron deficiency but not copper deficiency increases vascular complexity in the developing rat brain. Nutr Neurosci. 2015;18:365–75. doi:https://doi.org/10.1179/1476830515Y.0000000037.
- Ward KL, Tkac I, Jing Y, Felt B, Beard J, Connor J, et al. Gestational and lactational iron deficiency alters the developing striatal metabolome and associated behaviors in young rats. J Nutr. 2007;137:1043–49. doi:https://doi.org/10.1093/jn/137.4.1043.
- Rao R, Ennis K, Lubach GR, Lock EF, Georgieff MK, Coe CL. Metabolomic analysis of CSF indicates brain metabolic impairment precedes hematological indices of anemia in the iron-deficient infant monkey. Nutr Neurosci. 2018;21:40–48. doi:https://doi.org/10.1080/1028415X.2016.1217119.
- Rosato-Siri MV, Marziali L, Guitart ME, Badaracco ME, Puntel M, Pitossi F, et al. Iron availability compromises not only oligodendrocytes but also astrocytes and microglial cells. Mol Neurobiol. 2018;55:1068–81. doi:https://doi.org/10.1007/s12035-016-0369-2.
- Kleinridders A, Ferris HA, Reyzer ML, Rath M, Soto M, Manier ML, et al. Regional differences in brain glucose metabolism determined by imaging mass spectrometry. Mol Metab. 2018;12:113–21. doi:https://doi.org/10.1016/j.molmet.2018.03.013.
- Scott SP, Murray-Kolb LE. Iron status is associated with performance on executive functioning tasks in nonanemic young women. J Nutr. 2016;146:30–37. doi:https://doi.org/10.3945/jn.115.223586.
- Dziembowska I, Kwapisz J, Izdebski P, Zekanowska E. Mild iron deficiency may affect female endurance and behavior. Physiol Behav. 2018. doi:https://doi.org/10.1016/j.physbeh.2018.09.012.
- Connor JR, Ponnuru P, Lee B-Y, Podskalny GD, Alam S, Allen RP, et al. Postmortem and imaging based analyses reveal CNS decreased myelination in restless legs syndrome. Sleep Med. 2011;12:614–19. doi:https://doi.org/10.1016/j.sleep.2010.10.009.