
ABSTRACT
Objectives: Imbalanced nutrition and obesity are risk factors for depression, a relationship that in rodents can be modeled by depression-like behavior in response to high-fat diet (HFD). In this work, we examined the role of the intestinal microbiota and the adipocytokine leptin as potential mediators of the effects of HFD to induce anhedonia-like behavior and reduce self-care in mice.
Methods: Male mice were fed a control diet or HFD (60 kJ% from fat) for a period of 4 weeks, after which behavioral tests and molecular analyses (gut microbiome composition, intestinal metabolome, fecal fatty acids, plasma hormone levels) were performed. The role of the intestinal microbiota was addressed by selective depletion of gut bacteria with a combination of non-absorbable antibiotics, while the implication of leptin was examined by the use of leptin-deficient ob/ob mice.
Results: Antibiotic treatment reduced the HFD-induced weight gain and adiposity and prevented HFD-induced anhedonia-like behavior and self-care reduction. These effects were associated with a decrease in fecal fatty acids and intestinal microbiota-related metabolites including short-chain fatty acids, glucose and amino acids. Gut microbiota depletion suppressed the HFD-induced rise of plasma leptin, and the circulating leptin levels correlated with the anhedonia-like behavior and reduced self-care caused by HFD. The anhedonic effect of HFD was absent in leptin-deficient ob/ob mice although these animals gained more weight and adiposity in response to HFD than wild-type mice.
Discussion: The results indicate that anhedonia-like behavior induced by HFD in mice depends on the intestinal microbiome and involves leptin as a signaling hormone.
Introduction
Epidemiological studies have revealed that obesity and imbalanced nutrition increase the risk for depressive disorders [Citation1,Citation2]. Likewise, long-term exposure of rodents to an obesogenic diet leads to a depression-like phenotype which includes anhedonia [Citation3–7]. Anhedonia is a core symptom of depression [Citation8,Citation9], and comprehension of the mechanisms underlying anhedonia in animal models of obesity may explain the interrelationship between obesity and depression.
Obesity is a multifactorial health problem that is influenced not only by diet but also by genetic and environmental factors including the gut microbiota [Citation10,Citation11]. Several studies have shown that the gut microbiota composition is crucial for the development of obesity and metabolic syndrome [Citation10,Citation11]. In addition, the gut microbiota seems to play a role in the behavioral changes induced by high-fat diet (HFD) in rodents, given that transfer of the intestinal microbiota from HFD-fed obese mice to lean mice leads to anxiety-like behavior and cognitive impairment in the recipient mice [Citation12,Citation13].
The modulatory effects of the intestinal microbiota on the secretion of centrally acting hormones have been suggested to contribute to the influence of the gut microbiota on weight gain and behavior [Citation14,Citation15]. Such a role may be attributed to hormones such as glucagon-like peptide-1 (GLP-1), peptide YY (PYY), gastric inhibitory peptide (GIP), insulin and leptin [Citation14,Citation15]. Short-chain fatty acids (SCFAs), which are produced by the intestinal bacteria from indigestible fibers, are thought to play a pivotal role in microbial-endocrine communication. In particular, the enteroendocrine L-cells in the lower intestine, which produce GLP-1 and PYY, express receptors for SCFAs [Citation16]. SCFAs can, in addition, stimulate the release of leptin from adipocytes [Citation17]. Apart from their influence on food intake and metabolism, these endocrine factors are able to influence emotional-affective behavior [Citation18–20].
HFD induces anhedonia-like behavior in mice which is associated with distinct alterations in the intestinal microbiota and brain metabolome [Citation3]. The major aims of the current work were (i) to obtain conclusive evidence that the gut microbiota plays an indispensable role in HFD-induced anhedonia-like behavior and (ii) to identify a hormonal mechanism that links diet and intestinal microbiota to anhedonia-like behavior. These aims were addressed in two experimental setups. (i) The involvement of the intestinal microbiota in HFD-induced anhedonia-like behavior was probed by depletion of gut bacteria with a combination of non-absorbable antibiotics. (ii) The implication of particular hormones in HFD-induced anhedonia was examined by correlation of anhedonia-like behavior with circulating hormone levels (insulin, GLP-1, GIP, leptin) and by using leptin-deficient (ob/ob) mice.
Methods
Experimental animals
Experimental protocol 1 (see below) was carried out with male C57BL/6J mice obtained from Charles River (Sulzfeld, Germany). Experimental protocol 2 was performed with male homozygous B6.Cg-Lepob /J (ob/ob) mice and C57BL/6J wild-type (WT) mice obtained from Jackson Laboratory (Bar Harbor, ME, USA) through Charles River (Sulzfeld, Germany). The animals arrived at the age of 8 weeks and were housed two per cage (unless otherwise stated) under controlled conditions of temperature (set point 21°C) and air humidity (set point 50%) under a 12 h light/dark cycle (lights on at 6:00 h, lights off at 18:00 h). Mice were habituated for 10 days in the animal facility while being fed a control diet before starting the experiments.
Ethics statement
All experiments were approved by an ethical committee at the Federal Ministry of Education, Science and Research of the Republic of Austria (permit BMWFW-66.010/0050-WF/V/3b/2017 issued on 18 April 2017 and permit BMBWF-66.010/0146-V/3b/2018 issued on August 31, 2018).
Antibiotic treatment
In order to specifically deplete intestinal bacteria, mice were treated with a combination of 3 non-absorbable antibiotics: meropenem [AstraZeneca, Vienna, Austria; 1 mg/ml], neomycin [Sigma-Aldrich, Vienna, Austria; 5 mg/ml] and vancomycin [Sigma-Aldrich, Vienna, Austria; 0.3 mg/ml]. The antibiotics were administered via the drinking water. The respective control animals received plain drinking water. These three antibiotics are neither detectable in the plasma nor in the brain after 10 days of oral administration in mice [Citation21].
Diet
Mice were fed either a high-fat diet (HFD; S9003-E710; 60 kJ% from fat, with refined palm oil as main source, 24 kJ% from carbohydrate, 16 kJ% from protein) or control diet (control; S5745-E7022; 12 kJ% from fat, 65 kJ% from carbohydrate, 23 kJ% from protein) for 4 weeks. The diets were purchased from ssniff (Soest, Germany). The detailed composition of the two diets is given in supplementary table S1.
Study design
Two experimental protocols were used in this work, each being carried out with 40 mice (10 in each treatment group). The timelines of the two protocols are shown in supplementary figure S1. In protocol/experiment 1 the mice were allocated to four groups: group 1 received control diet + tap water; group 2 received control diet + antibiotics in the drinking water; group 3 received HFD + tap water; and group 4 received HFD + antibiotics in the drinking water. Antibiotic treatment (ABT) begun 5 days before the diet was changed to HFD. In protocol/experiment 2 mice were fed control diet or HFD without concomitant ABT. Feeding with control diet or HFD continued for 4 weeks after which the animals underwent behavioral testing. The mice were allocated to four groups: group 1 involved WT mice that received control diet; group 2 involved ob/ob mice that received control diet; group 3 involved WT mice that received HFD; and group 4 involved ob/ob mice that received HFD.
Tap water and the respective chow were provided ad libitum, and mice continued to receive the same diet throughout the study and during behavioral testing. Mice were weighed once weekly, and the weekly food intake of the two mice housed in one cage was calculated from the change in the weight of food pellets.
After the 4-week feeding period animals were subjected to a sequence of behavioral tests (one test per day) which were performed during the light cycle. The order of behavioral tests is described in supplementary figure S1. The behavioral tests included the open field (OF) test, elevated plus maze (EPM) test and light–dark box test to assess anxiety-like behavior [Citation22]. After these tests mice were individually housed for the sucrose preference test (SPT) to measure the hedonic effect of sucrose [Citation9,Citation23]. The SPT took two days: the first day was used as training day, while the second day was the test day. No antibiotics were added to the drinking water during the training day and the test day whereas ABT was continued during all other behavioral tests. Single housing of male mice can influence several aspects of behavior, but has no effect on SPT after 7, 14, and 21 days [Citation24]. Two days after the SPT, the splash test was performed to measure self-care and motivational behavior [Citation25]. The mice were sacrificed on the next day before tissue collection. Details of the behavioral tests and tissue collection procedures are described in supplementary information.
Fatty acid analysis
Stool fatty acids were analyzed with gas chromatography as described previously [Citation26] and detailed in supplementary information.
Microbiome analysis
The microbiome composition of cecal contents was analyzed by 16S rRNA sequencing as described previously [Citation21,Citation27] and detailed in the supplementary information.
Hormone assay
Plasma insulin, GLP-1, GIP and leptin were measured with the MILLIPLEX MAP Mouse Metabolic Hormone Magnetic Bead Panel (Merck) according to the manufacturer’s instructions. The assay was read with the Bio-Plex 200 multiplex suspension array system in combination with the Bio-Plex 5.0 Software (Bio-Rad, Hercules, CA, USA).
Metabolic profiling of the cecal contents
Metabolic profiling of cecal contents was performed with 1H nuclear magnetic resonance (NMR) as described in the supplementary information.
Real time qPCR
Colonic levels of mRNA encoding preproglucagon and PYY were assessed with qPCR using TaqMan gene expression assay as described previously [Citation21,Citation28] and detailed in the supplementary information.
Statistical analysis
The results of the behavioral tests, qPCR and hormone assays were analyzed with SPSS 22 (SPSS Inc., Chicago, IL, USA) and SigmaPlot 14 (Systat Software GmbH, Erkrath, Germany). Data were subjected to two-way analysis of variance (ANOVA), with diet and ABT as the two factors analyzed in experiment 1, and diet and genotype as the two factors analyzed in experiment 2. Post-hoc testing applying the Bonferroni correction was performed once a significant interaction between the factors was disclosed. In order to meet the equal variance requirement of two-way ANOVA, a log transformation of the data was employed. If the log transformation did not fulfill the equal variance assumption, Welch’s ANOVA followed by the Games-Howell post-hoc test was performed. Correlations between gut hormones and behavioral readouts were evaluated with the Spearman rank-order correlation coefficient. An α significance level of 0.05 was used to reject the null hypothesis in all the aforementioned statistical tests.
The analysis of microbiome and metabolic profiling data is described in the supplementary information.
Results
Antibiotic treatment attenuated the effect of HFD on ingestion, caloric intake, weight gain and adiposity
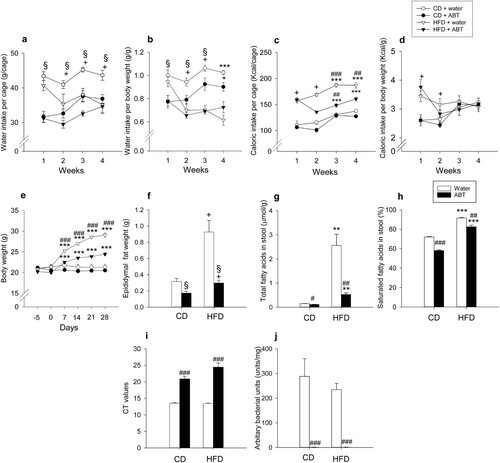
Two-way ANOVA revealed that both HFD and ABT had a significant main factor effect on the weekly water intake, which was significantly reduced in response to both factors ((a,b)). In contrast, HFD enhanced the weekly caloric intake relative to that of mice on control diet during weeks 1–2 of the 4-week intervention period ((c,d)). During weeks 3–4 there was a significant interaction between ABT and diet in modifying absolute caloric intake: mice receiving water and antibiotic-treated mice on HFD consumed more calories compared to the respective mice on control diet, but ABT reduced caloric intake only in animals on HFD ((c)). In contrast, the caloric intake normalized to body weight did not significantly differ between the experimental groups during weeks 3–4 ((d)). Body weight, however, increased over the 4-week HFD intervention period ((e)). While there were no significant group differences in body weight at the beginning of ABT and diet change (day 0), HFD increased body weight in a cumulative fashion during weeks 1–4 of the dieting intervention. Notably, ABT significantly blunted the weight gain in mice on HFD but had no significant effect on body weight in mice on control diet ((e)). Adiposity evaluated by the weight of epididymal fat was also significantly enhanced by HFD (F(1,36) = 17.7, p < 0.001), an effect that was largely prevented by ABT (F(1,36) = 15.6, p = 0.001), with no significant interaction between the two factors ((f)).
Figure 1. Effect of high-fat diet (HFD), relative to control diet (CD), in control mice (‘water’) and mice treated with antibiotics (ABT) on water intake per cage (each cage housing 2 mice) (a), water intake per body weight (b), caloric intake per cage (c), caloric intake per body weight (d), body weight (e), epididymal fat weight (f), total fatty acids per gram dry weight stool (g), saturated fatty acids in stool (h), crossing of threshold (CT) values (16S rRNA qPCR of cecal contents) (i) and arbitrary bacterial units in wet weight cecal contents (j). The parameters shown in panels a-e were measured during the four-week intervention whereas the parameters in panels f-j were recorded at the end of the experiments. Means + SEM, n = 5 per group in panels a-d and n = 8–10 per group in all other panels. Statistical analysis was performed with two-way ANOVA followed by Bonferroni’s post-hoc test in panels a-d,f and with Welch’s ANOVA and Games-Howell post-hoc test in panels e,g-i. +p < 0.05 significant diet main factor effect, §p < 0.05 significant ABT main factor effect, **p < 0.01, ***p < 0.001 compared to the respective ‘water’/ABT group on control diet, #p < 0.05, ##p < 0.01, ###p < 0.001 compared to the ‘water’ group on the same diet.
Antibiotic treatment blunted the fecal fatty acid rise due to HFD
HFD enhanced the stool content of total fatty acids and the percentage of saturated fatty acids, these effects being blunted by ABT ((g,h)). Welch’s ANOVA disclosed significant group differences in total fatty acids (Welch’s F(3,17.2) = 22.0; p < 0.001) and the percentage of saturated fatty acids (relative to total fatty acids) in the stool (Welch’s F(3,17.6) = 578.5; p < 0.001). The Games-Howell post-hoc test revealed that the fecal content of total and saturated fatty acids in mice on HFD was significantly higher than in mice on control diet independently of whether they received water or antibiotics, while ABT reduced both the total and saturated fatty acid content independently of diet ((g,h)).
Antibiotic treatment depleted the cecal microbiota and modified the effect of HFD on microbial composition
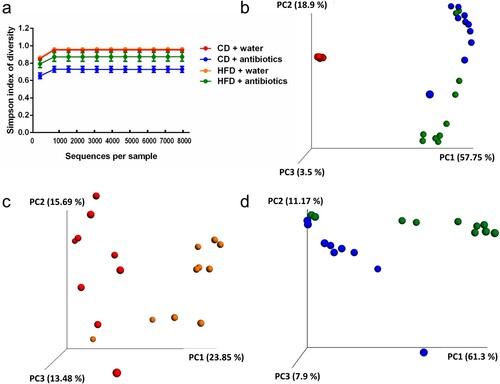
ABT and HFD had complex effects on the cecal microbiota in terms of bacterial load, bacterial diversity and microbiome composition (Figures (i,j) and (a–d). Welch’s ANOVA was used to assess significant group differences in both cycle threshold (CT) values (Welch’s F(3,17) = 49.9; p < 0.001) and arbitrary bacterial units (Welch’s F(3,17) = 31.6; p < 0.001) ((i,j)). The Games-Howell post-hoc test showed that ABT significantly reduced bacterial load independently of diet, as shown by an increase in CT values and a very pronounced suppression of arbitrary bacterial units ((i,j)). Diet alone had no significant influence on these parameters ((i,j)). Calculation of the Simpson index showed that ABT significantly lowered the α-diversity of the cecal microbiome in mice on control diet while the α-diversity in mice on HFD was not significantly affected by ABT ((a)). Bray–Curtis PCoA revealed a clear separation of the microbial composition (β-diversity) in mice receiving ABT from those without ABT, which was confirmed by the Adonis test (R2 = 0.57, p < 0.001). In contrast, the effect of diet was less prominent and the Adonis test failed to show a statistically significant effect of diet ((b)). However, when mice without ABT and mice receiving ABT were analyzed in separate plots, Bray–Curtis PCoA disclosed an effect of diet independently of ABT, which was confirmed by the Adonis test for the diet effect in both mice receiving normal drinking water (R2 = 0.19, p < 0.001) and mice receiving antibiotics (R2 = 0.31, p < 0.05) ((c,d)).
Figure 2. Microbial community profile based on 16S rRNA sequencing of cecal contents in control mice (‘water’) and mice treated with antibiotics (ABT) fed either a control diet (CD) or high-fat diet (HFD) for 4 weeks (n = 9–10 per group). The panels show alpha-rarefaction curves using the Simpson’s index of diversity (a), Bray-Curtis Principle Coordinate Analysis (PCoA) of the four study groups (b), PCoA of the two control groups (CD + ‘water’, HFD + ‘water’) (c) and PCoA of the two groups that received ABT (CD + ABT, HFD + ABT) (d).
Antibiotic treatment and HFD had a profound influence on the cecal metabolome
The effects of ABT and HFD on the cecal metabolome were investigated by PCA and orthogonal projection to latent structure-discriminant analyses (O-PLS-DA) of 1H-NMR metabolic profilings. The first two PCA components explained 64% of the total metabolomic variation and indicated a clear clustering of samples depending on ABT ((a)), whereas no clustering based on diet was observed ((a)). A further 10% of the metabolomic variation was explained by the third and fourth PCA components, but no sample clusterings were detected in this case. No outliers were observed in the PCA analysis but one sample of the CD + water group clustered with the samples from mice receiving ABT ((a)). In a sub-sample analysis, this sample was detected as outlier in the first two PCA components and therefore removed ((d)).
Figure 3. Antibiotic treatment strongly affects mice fecal metabolome and counteracts the impact of HFD. Analysis of cecal contents in control mice (‘water’) and mice treated with antibiotics (ABT) fed either a control diet (CD) or high-fat diet (HFD) for 4 weeks. (a) Principal component analysis (PCA) scores plot; blue-circle: water-control diet; red-circle: ABT-control diet; yellow-diamond: ABT-HFD; purple-diamond: ‘water’-HFD. (b) 3D OPLS-DA score plots using diet and treatment as vector response. The calculated scores are plotted against each other on the 3 axes. R2Y: [0.7649 0.5692 0.8818 0.4201]; R2Ycum: 0.6590; Q2Y: [0.2584 0.2665 0.5386 0.2094]; Q2cum: 0.3182. (c) Loadings plot derived from the above OPLS-DA model (panel b), describing the metabolic differences driving the separation along the x axis based on the treatment. Downward pointing metabolites: ABT; upwards pointing metabolites: ‘water’. (d) OPLS-DA scores plot using diet as response vector on ‘water’ only sub-group. Blue-circle: control diet; purple-diamond: HFD; R2Y: 0.8217; Q2Y: 0.6824. (e) OPLS-DA scores plot using diet as response vector on ABT only sub-group. Red-circle: control diet; yellow-diamond: HFD; R2Y: 0.7062; Q2Y: 0.0686. (f) Loadings plot derived from OPLS-DA model (panel d) describing the metabolic differences driving the separation between CD and HFD in mice receiving ‘water’. Upwards pointing metabolites: CD; downward pointing metabolites: HFD.
![Figure 3. Antibiotic treatment strongly affects mice fecal metabolome and counteracts the impact of HFD. Analysis of cecal contents in control mice (‘water’) and mice treated with antibiotics (ABT) fed either a control diet (CD) or high-fat diet (HFD) for 4 weeks. (a) Principal component analysis (PCA) scores plot; blue-circle: water-control diet; red-circle: ABT-control diet; yellow-diamond: ABT-HFD; purple-diamond: ‘water’-HFD. (b) 3D OPLS-DA score plots using diet and treatment as vector response. The calculated scores are plotted against each other on the 3 axes. R2Y: [0.7649 0.5692 0.8818 0.4201]; R2Ycum: 0.6590; Q2Y: [0.2584 0.2665 0.5386 0.2094]; Q2cum: 0.3182. (c) Loadings plot derived from the above OPLS-DA model (panel b), describing the metabolic differences driving the separation along the x axis based on the treatment. Downward pointing metabolites: ABT; upwards pointing metabolites: ‘water’. (d) OPLS-DA scores plot using diet as response vector on ‘water’ only sub-group. Blue-circle: control diet; purple-diamond: HFD; R2Y: 0.8217; Q2Y: 0.6824. (e) OPLS-DA scores plot using diet as response vector on ABT only sub-group. Red-circle: control diet; yellow-diamond: HFD; R2Y: 0.7062; Q2Y: 0.0686. (f) Loadings plot derived from OPLS-DA model (panel d) describing the metabolic differences driving the separation between CD and HFD in mice receiving ‘water’. Upwards pointing metabolites: CD; downward pointing metabolites: HFD.](/cms/asset/aa613b82-3cb5-4f6d-85cd-cdd00c1c6392/ynns_a_1751508_f0003_oc.jpg)
To maximize group separation and concurrently investigate the impact of diet and ABT, an O-PLS-DA was performed using 4 response vectors of binary values (0 or 1), each ‘discriminating’ one group against the remaining three. A 3D scatter O-PLS-DA plot ((b)) confirmed the group separation based on ABT previously detected by PCA. In addition, the analysis revealed a separation based on diet, which had gone undetected in the PCA. Moreover, O-PLS-DA showed that the separation induced by HFD ((b), blue circles and purple diamonds) was softened by ABT, indicating the two groups were metabolically closer ((b), red circles and yellow diamonds). As shown in (c), a number of metabolites, including SCFAs, lactate, glucose, uracil, tyrosine, tryptophan, phenylalanine, hypoxanthine and 4-hydroxyphenylacetate, were associated with the group without ABT, indicating a higher metabolic activity in the water group.
In order to detect any interference of ABT with diet-related metabolic changes, we performed OPLS-DA models on sub-samples obtained either from mice receiving water ((d)) or antibiotics ((e)). In mice receiving water, diet led to metabolic changes, the HFD + water subgroup being associated with lower levels of glucose, succinate, propionate and 4-hydroxyphenylacetate ((f)). In contrast, this HFD-induced effect was not observed in antibiotic-treated animals ((e)), indicating a counteracting influence of ABT on diet-induced changes.
Antibiotic treatment and HFD had distinct effects on anxiety-like behavior and locomotion, respectively
When examined after the 4-week dieting intervention in experiment 1, HFD caused a slight, but significant reduction of locomotion as deduced from the total traveling distance in the OF (F(1,36) = 5.3; p = 0.028), with no significant effect of ABT and no significant interaction between the two factors ((a)). HFD did not induce any behavioral effects in the OF, EPM or light–dark box tests ((b–f)). In contrast, ABT attenuated anxiety-like behavior on the EPM, as the time spent on the open arms of the EPM was prolonged (F(1,35) = 6.6; p = 0.014) without significant interaction with diet ((d)). No other behavioral effects were induced by ABT in the OF or light–dark box test ((a–c,e,f)).
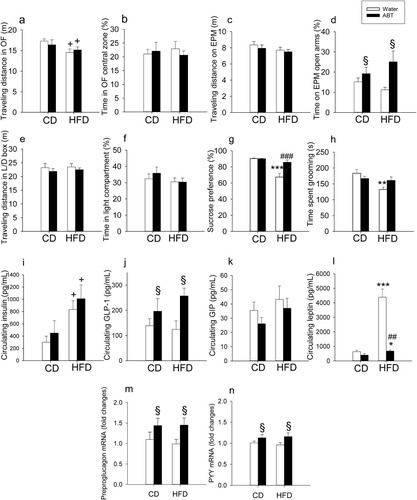
Figure 4. Effect of high-fat diet (HFD), relative to control diet (CD), in control mice (‘water’) and mice treated with antibiotics (ABT) on readouts in the open field (OF) test (a,b), elevated plus maze (EPM) test (c,d), light-dark (L/D) box test (E,F), sucrose preference test (g) and splash test (h) as well as on circulating levels of insulin (i), GLP-1 (j), GIP (k) and leptin (l) and relative mRNA expression of preproglucagon (m) and PYY (n) in the colonic wall. Means + SEM, n = 8–10 per group. Statistical analysis was performed with Welch’s ANOVA and Games-Howell post-hoc test in panel g and with two-way ANOVA and Bonferroni’s post-hoc test in case of a significant interaction in all other panels. +p < 0.05 diet main factor effect, §p < 0.05 ABT main factor effect, *p < 0.05, **p < 0.01, ***p < 0.001 compared to the respective ‘water’/ABT group on control diet, ##p < 0.01, ###p < 0.001 compared to the ‘water’ group on the same diet.
Antibiotic treatment suppressed the anhedonic effect of HFD
Four-week feeding of mice with HFD induced anhedonia-like behavior as deduced from a blunted sucrose preference and mitigated self-care assessed in the splash test ((g,h)). ABT prevented these effects of HFD ((g,h)). Welch’s ANOVA was used to evaluate significant group differences in the SPT (Welch’s F(17,3) = 8.2; p = 0.0014). The Games-Howell post-hoc test revealed that HFD without ABT reduced sucrose preference, whereas ABT suppressed this effect of HFD ((g)). Two-way ANOVA of the splash test data ((h)) revealed a significant main factor effect of HFD (F(1,34) = 8.5; p = 0.006) but not ABT, with a significant interaction between the two factors (F(1,34) = 6.0; p = 0.027). Post-hoc testing highlighted a significant reduction of grooming time in mice on HFD, an effect that was prevented by ABT ((h)).
Antibiotic treatment and HFD modified circulating leptin, insulin and GLP-1, but not GIP
Four-week feeding of mice with HFD significantly increased plasma insulin (F(1,32) = 9.1, p = 0.005) without a significant effect of ABT and without significant interaction between the two factors ((i)). In contrast, plasma GLP-1 was significantly increased by ABT (F(1,32) = 6.8, p = 0.014) without a significant effect of diet and without a significant interaction between the two factors ((j)). While the circulating levels of GIP were not significantly altered by ABT and HFD ((k)), plasma leptin ((l)) was significantly affected by both diet (log transformed data: F(1,32) = 67.2, p < 0.001) and ABT (log transformed data: F(1,32) = 59.4, p < 0.001), with a significant interaction between the two factors (log transformed data: F(1,32) = 17.7, p < 0.001). Post-hoc testing revealed that HFD significantly increased leptin in the absence and presence of ABT and that ABT suppressed plasma leptin only in mice on HFD ((l)).
Spearman rank correlation analysis was used to evaluate associations between the plasma levels of the four hormones analyzed and three behavioral readouts affected by the interventions (percent time spent on the open arms of the EPM, sucrose preference in the SPT, grooming time in the splash test). None of the four hormones was significantly correlated with the EPM readout. There was, however, a statistically significant inverse correlation of plasma leptin with sucrose preference (ρ = −0.642, n = 34, p < 0.001). There was also a weak, but statistically significant inverse correlation of plasma leptin and plasma insulin with grooming time in the splash test (leptin: ρ = −0.430, n = 32, p = 0.014, insulin: ρ = −0.364, n = 32, p = 0.04).
Antibiotic treatment, but not HFD, modified the colonic expression of preproglucagon and PYY
ABT enhanced the relative expression of preproglucagon mRNA (F(1,34) = 5.97; p = 0.02) and PYY mRNA (F(1,33) = 4.2; p = 0.03) independently of diet and without significant interaction between the two factors ((m,n)).
Leptin deficiency in ob/ob mice modified caloric intake and increased weight gain and adiposity in response to HFD
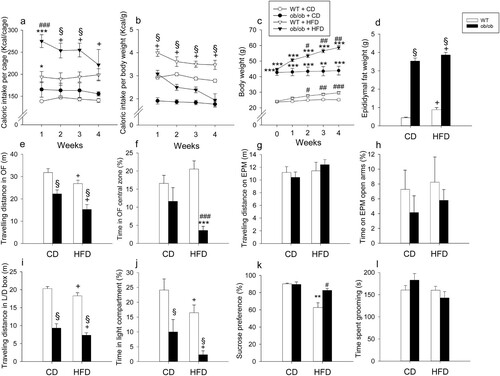
The caloric intake of WT and leptin-deficient ob/ob mice depended on both diet and genotype ((a,b)). In WT mice the caloric intake was increased by HFD, relative to control diet, both when calculated per cage and per gram body weight ((a,b)). In contrast, the caloric intake of leptin-deficient ob/ob mice was markedly increased by HFD only when calculated per cage ((a)). When calculated per gram body weight, the caloric intake of ob/ob mice on control diet and HFD was lower than the respective caloric intake of WT mice ((b)). Throughout the experiment the body weight of ob/ob mice was significantly higher than that of WT mice, and over weeks 2–4 both WT and ob/ob mice gained significantly more weight when on HFD than when on control diet ((c)). Adiposity reflected by epididymal fat mass was significantly increased both by HFD (F(1,35) = 10.11; p = 0.003) and in particular by the ob/ob genotype (F(1,35) = 624.71; p < 0.001) without significant interaction between the two factors ((d)).
Figure 5. Effect of high-fat diet (HFD), relative to control diet (CD), in wild-type (WT) and ob/ob mice on caloric intake per cage (each cage housing 2 mice) (a), caloric intake per body weight (b), body weight (c), epididymal fat weight (d), behavior in the open field (OF) test (e,f), behavior in the elevated plus maze (EPM) test (g,h), behavior in the light-dark (L/D) box test (i,j), sucrose preference (k) and behavior in the splash test (l). The parameters shown in panels a-c were measured during the four-week intervention whereas the parameters in panels d-l were recorded at the end of the experiments. Means + SEM, n = 4–5 per group in a-b, n = 8–10 per group in c-l. Statistical analysis was performed with two-way ANOVA followed by Bonferroni’s post-hoc test in case of a significant interaction, except in panel c and k in which Welch’s ANOVA and Games-Howell post-hoc test were performed. +p < 0.05 diet main factor effect, §p < 0.05 genotype main factor effect, **p < 0.01, ***p < 0.001 compared to respective genotype on control diet, #p < 0.05, ##p < 0.01, ###p < 0.001 compared to WT.
Leptin deficiency in ob/ob mice affected locomotion and anxiety-like behavior in response to HFD
Both HFD and leptin deficiency reduced locomotion (total traveling distance) in the OF and light–dark box tests, but not in the EPM test ((e,g,i)). In the OF, the total traveling distance depended on diet (F(1,35) = 10.65; p = 0.002) and genotype (F(1,35) = 33.46; p < 0.001) without significant interaction between the two factors ((e)). Likewise, in the light–dark box, the total traveling distance varied with diet (F(1,35) = 5.69; p = 0.023) and genotype (F(1,35) = 170.1; p < 0.001) without significant interaction of the two factors ((i)).
Anxiety-like behavior in the OF (shortened time spent in central zone) was observed when ob/ob mice were fed with HFD, whereas anxiety-like behavior in the light–dark box (shortened time spent in light compartment) was seen in response to both HFD and leptin deficiency ((f,j)). Two-way ANOVA showed that anxiety-like behavior in the OF was increased in ob/ob mice (F(1,35) = 19.77; p < 0.001) without a diet main factor effect but with a significant interaction between the two factors (F(1,35) = 5.9; p = 0.02) ((f)). Post-hoc testing revealed that HFD augmented anxiety-like behavior only in ob/ob mice ((f)). In contrast, in the light–dark box, anxiety-like behavior was enhanced by both leptin deficiency (F(1,35) = 20.61; p < 0.0001) and HFD (F(1,35) = 6.05; p = 0.019) without a significant interaction between the two factors ((j)). Behavioral testing on the EPM failed to reveal any significant group differences in anxiety-like behavior (shortened time spent on open arms) ((h)).
Leptin deficient ob/ob mice did not develop anhedonia in response to HFD
Unlike WT mice, ob/ob mice were protected from the development of anhedonia-like behavior (reduction of sucrose preference) induced by HFD ((k)). Because of the heteroscedasticity of the SPT data, Welch’s ANOVA was applied to assess significant group differences (Welch’s F(15,3) = 10.4; p < 0.001). The Games-Howell post-hoc test showed that HFD led to a significant reduction of sucrose preference in WT mice but not in leptin-deficient ob/ob mice ((k)). Consequently, ob/ob mice on HFD exhibited a significantly higher sucrose preference than WT mice on HFD. There were no significant differences in sucrose preference between WT and ob/ob mice on control diet ((k)). The time spent grooming in the splash test remained unaffected by diet and genotype ((i)).
Discussion
Summary of main findings
In analyzing the role of gut microbiota, intestinal metabolites and endocrine factors in HFD-induced anhedonia-like behavior we obtained four major findings. First, gut microbiota depletion by ABT attenuated caloric intake, weight gain, and adiposity in response to HFD and diminished the intestinal/fecal content of fatty acids and several metabolites including SCFAs, tryptophan metabolites and glucose. Second, ABT prevented HFD from inducing anhedonia-like behavior in the sucrose preference test, which attests to an indispensable role of the gut microbiota in HFD-induced anhedonia-like behavior. Third, ABT prevented the rise of plasma leptin caused by HFD. Furthermore, we observed that the circulating leptin levels were closely correlated with the behavioral parameters of sucrose preference. Fourth, evidence for an important implication of leptin in HFD-induced anhedonia was obtained by the use of leptin-deficient ob/ob mice which in spite of being more obese did not develop anhedonia-like behavior in response to HFD.
Antibiotic treatment depleted the cecal microbiota and metabolome and prevented HFD-induced obesity
ABT significantly suppressed the bacterial load and curtailed the β-diversity of the microbiome in the cecum of mice on control diet and HFD. In addition, PCoA of the microbiome of antibiotic-treated mice displayed a relatively high inter-individual variability as has also been reported in another study [Citation29]. Antibiotic-treated mice gained less weight, which is consistent with previous reports in both germ-free and antibiotic-treated rodents [Citation30]. Microbiota depletion reduces body weight by several mechanisms such as reduced energy harvesting from the diet, redirection of metabolic pathways, browning of white adipose tissues and mitigated endotoxemia [Citation10,Citation30–32]. In our work, ABT reduced the fecal content of total and saturated fatty acids, especially in mice on HFD, which indicates that the attenuated weight gain induced by ABT is unlikely the result of fat malabsorption.
The profound microbiota depletion caused by ABT resulted in a marked dilution of the cecal metabolome, with a significant decrease in the concentrations of SCFAs, lactate, glucose, uracil, tyrosine, tryptophan, phenylalanine, hypoxanthine and 4-hydroxyphenylacetate. These results are consistent with a recent report that antibiotics reduce aromatic amino acid levels in the feces and blood and diminish the concentrations of aromatic amino acids and neurotransmitters derived from aromatic amino acids in the hypothalamus of piglets [Citation33]. Since the availability of carbohydrates in the hindgut of piglets also influences hypothalamic neurotransmitter synthesis [Citation34], the effect of the gut microbiome on carbohydrate and aromatic amino acid levels in the hindgut warrants further study as a link between microbiome and behavior. The change in the intestinal metabolome is likely to have an impact on several of the metabolic and behavioral alterations caused by ABT. Glucose and SCFAs are important caloric sources, and SCFAs contribute to the regulation of gut hormone release, immune function and metabolic profile [Citation2,Citation35].
Antibiotic-induced microbiota depletion prevented HFD-induced anhedonia
Based on previous work [Citation3] we hypothesized that the effect of HFD to alter the brain metabolome and cause anhedonia-like behavior is due to a change in the intestinal microbiota. The current findings provided conclusive evidence for such a relationship, since the HFD-induced decrease in sucrose preference and self-care was absent in antibiotic-treated mice. This finding is in keeping with several lines of evidence for an involvement of the intestinal microbiota in mood disturbances. Compared with healthy subjects, patients suffering from depression present with a disrupted composition of the intestinal microbiota [Citation36–40], and microbiota transfer from depressed patients induces a depression-like phenotype in the recipient rodents [Citation38,Citation39].
Antibiotic-induced depletion of the cecal microbiota also had an anxiolytic effect, which was seen only in the EPM test. HFD, in contrast, did not affect anxiety-like behavior, which is not unexpected in view of the inconsistent influence of HFD on this behavior [Citation41]. The antibiotic-induced reduction of anxiety-like behavior seen here is in line with other observations in germ-free and antibiotic-treated mice [Citation29,Citation42].
Antibiotic-induced microbiota depletion had distinct effects on colonic and circulating hormone levels
Several endogenous hormones are likely to contribute to the communication between the intestinal microbiota and the brain [Citation43]. While the colonic expression of preproglucagon and PYY mRNA remained unaltered by HFD, the expression of both hormones was enhanced by antibiotic-induced microbiota depletion. This change needs to be seen in relation with the ability of the intestinal microbiota to regulate the transcriptome of L-cells including that for preproglucagon and PYY [Citation16,Citation44]. Like preproglucagon expression in the colon, plasma GLP-1 was enhanced by ABT in a diet-independent manner, which speaks against a mediator role of GLP-1 in HFD-induced anhedonia-like behavior. The elevated plasma GLP-1 in antibiotic-treated mice, however, may contribute to the reduced water and caloric intake and the diminished weight gain seen in these animals, given that GLP-1 acts as satiety signal [Citation45] and blunts water intake [Citation46].
Both plasma insulin and leptin were enhanced by HFD, but while ABT had no effect on plasma insulin, ABT prevented the surge of plasma leptin in response to HFD. This observation attributes leptin a significant role in the link between HFD, microbiota and behavior, a relationship that is corroborated by the correlation of high circulating leptin levels with anhedonia-like behavior and reduced self-care caused by HFD. The effect of ABT on leptin levels can be explained not only by the lower fat mass in antibiotic-treated mice but also by the reduced production of SCFAs, which stimulate leptin secretion from adipocytes [Citation17]. The proposed implication of leptin in HFD-induced anhedonia-like behavior is in keeping with the role of endogenous leptin as a regulator of the rewarding effects of nutrients through peripheral and central mechanisms. Peripherally, leptin inhibits mouse taste cell responses to sweet compounds [Citation47] while, centrally, leptin suppresses the ability of sucrose to drive taste-independent dopaminergic neuronal activation in the midbrain [Citation48].
Anhedonia induced by HFD was absent in leptin-deficient mice
The implication of leptin as a mediator of HFD-induced behavioral changes was directly probed by the use of leptin-deficient ob/ob mice. Anhedonia-like behavior induced by HFD is, unlike effects on anxiety-like behavior, a robust finding that was reproduced in many studies involving various mouse lines [Citation3–7] including the WT line used in the present study. The observation that ob/ob mice did not develop anhedonia-like behavior in response to HFD in spite of consuming more calories and being more obese provides evidence that leptin is an essential signal linking HFD, gut microbiota and anhedonia. Since, however, WT and homozygous ob/ob mice are phenotypically different, we cannot rule out that physiologic differences other than leptin deficiency have a bearing on the genotype-dependent difference in HFD-evoked anhedonia-like behavior.
In view of the reported antidepressant activity of exogenous leptin [Citation49,Citation50] and the association between leptin resistance and depression-like behavior [Citation50,Citation51], the question arises as to whether increased leptin per se gives rise to anhedonia. It has previously been reported that ob/ob mice exhibit despair behavior [Citation50], whereas the present study showed that ob/ob mice do not exhibit anhedonia-like behavior and are even protected from the anhedonic effect of HFD in spite of being more obese. These observations are in keeping with the notion that endogenous leptin has a differential impact on distinct domains of depression-like behavior, since a pegylated leptin receptor antagonist is able to cause despair behavior, but not anhedonia [Citation52]. It is worth noting that ob/ob mice exhibited anxiety-like behavior, which confirms a previous report [Citation53]. The anxiety-like behavior of ob/ob mice seen in the OF test was enhanced by HFD, which points to a protective role of endogenous leptin against anxiety-like behavior especially in mice on HFD.
Conclusions
The anhedonia-like behavior induced by HFD in mice depends on the presence of the intestinal microbiota and involves leptin as a signaling hormone. SCFAs may represent a link between the gut microbiota and leptin, given that SCFAs are produced by gut bacteria and are able to release leptin from adipocytes. These findings highlight a new line of communication between gut microbiota and brain, which may be relevant to therapeutic considerations.
Supplemental Material
Download MS Word (103.7 KB)Acknowledgements
The authors thank Ingrid Liebmann for RNA extraction and her help in tissue extraction and multiplex hormonal assay and Karin Wagner for her help in the PCR. AMH and PH designed the experiments. AMH ran the animal model, the behavioral tests and the PCR and analyzed the pertinent data including those obtained with multiplex immunoassay. KK ran the microbiome analysis, while GM and SPC conducted the metabolomics analysis. GL performed the fatty acid assays. AF and GZ extracted tissues for analysis. AMH and PH wrote the manuscript, and all authors revised the manuscript.
Disclosure Statement
No potential conflict of interest was reported by the author(s).
Additional information
Funding
Notes on contributors
Ahmed M. Hassan
Ahmed M. Hassan is a Postdoctoral Research Associate (M.D., Ph.D.) and Member of the Research Unit of Translational Neurogastroenterology, Division of Pharmacology, Otto Loewi Research Centre, Medical University of Graz, Austria.
Giulia Mancano
Giulia Mancano is a Postdoctoral Research Associate (Ph.D.), Department of Food and Nutritional Sciences, Institute for Cardiovascular & Metabolic Research, University of Reading, United Kingdom.
Karl Kashofer
Karl Kashofer is a Lecturer (Ph.D.) and Head of the Research Group of Translational Genome Analysis, Diagnostic & Research Institute of Pathology, Diagnostic & Research Center of Molecular Biomedicine, Medical University of Graz, Austria.
Gerhard Liebisch
Gerhard Liebisch is a Lecturer (Ph.D.) and Head of the Research Group of Lipidomics, Institute of Clinical Chemistry and Laboratory Medicine, University Hospital of Regensburg, Germany.
Aitak Farzi
Aitak Farzi is a Research Associate (M.D., Ph.D.), Resident and Member of the Research Unit of Translational Neurogastroenterology, Division of Pharmacology, Otto Loewi Research Centre, Medical University of Graz, Austria.
Geraldine Zenz
Geraldine Zenz is a Postdoctoral Research Associate (Ph.D.) and Member of the Research Unit of Translational Neurogastroenterology, Division of Pharmacology, Otto Loewi Research Centre, Medical University of Graz, Austria.
Sandrine P. Claus
Sandrine P. Claus is an Associate Professor in Integrative Metabolism (Ph.D.) and Principal Investigator, Department of Food and Nutritional Sciences, Institute for Cardiovascular & Metabolic Research, University of Reading, United Kingdom.
Peter Holzer
Peter Holzer is a Professor of Experimental Neurogastroenterology (Ph.D.) and Head of the Research Unit of Translational Neurogastroenterology, Division of Pharmacology, Otto Loewi Research Centre, Medical University of Graz, Austria.
References
- Luppino FS, de Wit LM, Bouvy PF, Stijnen T, Cuijpers P, Penninx BWJH, et al. Overweight, obesity, and depression: a systematic review and meta-analysis of longitudinal studies. Arch Gen Psychiatry. 2010;67:220–9. doi: https://doi.org/10.1001/archgenpsychiatry.2010.2
- Farzi A, Hassan AM, Zenz G, Holzer P. Diabesity and mood disorders: Multiple links through the microbiota-gut-brain axis. Mol Aspects Med. 2019;66:80–93. doi: https://doi.org/10.1016/j.mam.2018.11.003
- Hassan AM, Mancano G, Kashofer K, Fröhlich EE, Matak A, Mayerhofer R, et al. High-fat diet induces depression-like behaviour in mice associated with changes in microbiome, neuropeptide Y, and brain metabolome. Nutr Neurosci. 2019;22:877–93. doi: https://doi.org/10.1080/1028415X.2018.1465713
- Dutheil S, Ota KT, Wohleb ES, Rasmussen K, Duman RS. High-fat diet induced anxiety and anhedonia: impact on brain homeostasis and inflammation. Neuropsychopharmacology. 2016;41:1874–87. doi: https://doi.org/10.1038/npp.2015.357
- Sharma S, Fernandes MF, Fulton S. Adaptations in brain reward circuitry underlie palatable food cravings and anxiety induced by high-fat diet withdrawal. Int J Obes (Lond. 2013;37:1183–91. doi: https://doi.org/10.1038/ijo.2012.197
- Grillo CA, Mulder P, Macht VA, Kaigler KF, Wilson SP, Wilson MA, et al. Dietary restriction reverses obesity-induced anhedonia. Physiol Behav. 2014;128:126–32. doi: https://doi.org/10.1016/j.physbeh.2014.01.026
- Rabasa C, Winsa-Jornulf J, Vogel H, Babaei CS, Askevik K, Dickson SL. Behavioral consequences of exposure to a high fat diet during the post-weaning period in rats. Horm Behav. 2016;85:56–66. doi: https://doi.org/10.1016/j.yhbeh.2016.07.008
- Cryan JF, Mombereau C. In search of a depressed mouse: utility of models for studying depression-related behavior in genetically modified mice. Mol Psychiatry. 2004;9:326–57. doi: https://doi.org/10.1038/sj.mp.4001457
- Willner P. Chronic mild stress (CMS) revisited: consistency and behavioural-neurobiological concordance in the effects of CMS. Neuropsychobiology. 2005;52:90–110. doi: https://doi.org/10.1159/000087097
- Turnbaugh PJ, Ley RE, Mahowald MA, Magrini V, Mardis ER, Gordon JI. An obesity-associated gut microbiome with increased capacity for energy harvest. Nature. 2006;444:1027–31. doi: https://doi.org/10.1038/nature05414
- Sonnenburg JL, Backhed F. Diet-microbiota interactions as moderators of human metabolism. Nature. 2016;535:56–64. doi: https://doi.org/10.1038/nature18846
- Bruce-Keller AJ, Salbaum JM, Luo M, Blanchard E, Taylor CM, Welsh DA, et al. Obese-type gut microbiota induce neurobehavioral changes in the absence of obesity. Biol Psychiatry. 2015;77:607–15. doi: https://doi.org/10.1016/j.biopsych.2014.07.012
- Soto M, Herzog C, Pacheco JA, Fujisaka S, Bullock K, Clish CB, et al. Gut microbiota modulate neurobehavior through changes in brain insulin sensitivity and metabolism. Mol Psychiatry. 2018;23:2287–301. doi: https://doi.org/10.1038/s41380-018-0086-5
- Clarke G, Stilling RM, Kennedy PJ, Stanton C, Cryan JF, Dinan TG. Minireview: Gut microbiota: the neglected endocrine organ. Mol Endocrinol. 2014;28:1221–38. doi: https://doi.org/10.1210/me.2014-1108
- Neuman H, Debelius JW, Knight R, Koren O. Microbial endocrinology: the interplay between the microbiota and the endocrine system. FEMS Microbiol Rev. 2015;39:509–21. doi: https://doi.org/10.1093/femsre/fuu010
- Greiner TU, Backhed F. Microbial regulation of GLP-1 and L-cell biology. Mol Metab. 2016;5:753–8. doi: https://doi.org/10.1016/j.molmet.2016.05.012
- Xiong Y, Miyamoto N, Shibata K, Valasek MA, Motoike T, Kedzierski RM, et al. Short-chain fatty acids stimulate leptin production in adipocytes through the G protein-coupled receptor GPR41. Proc Natl Acad Sci U S A. 2004;101:1045–50. doi: https://doi.org/10.1073/pnas.2637002100
- Painsipp E, Herzog H, Sperk G, Holzer P. Sex-dependent control of murine emotional-affective behaviour in health and colitis by peptide YY and neuropeptide Y. Br J Pharmacol. 2011;163:1302–14. doi: https://doi.org/10.1111/j.1476-5381.2011.01326.x
- Anderberg RH, Richard JE, Hansson C, Nissbrandt H, Bergquist F, Skibicka KP. GLP-1 is both anxiogenic and antidepressant; divergent effects of acute and chronic GLP-1 on emotionality. Psychoneuroendocrinology. 2016;65:54–66. doi: https://doi.org/10.1016/j.psyneuen.2015.11.021
- Lu XY. The leptin hypothesis of depression: a potential link between mood disorders and obesity? Curr Opin Pharmacol. 2007;7:648–52. doi: https://doi.org/10.1016/j.coph.2007.10.010
- Fröhlich EE, Farzi A, Mayerhofer R, Reichmann F, Jačan A, Wagner B, et al. Cognitive impairment by antibiotic-induced gut dysbiosis: analysis of gut microbiota-brain communication. Brain Behav Immun. 2016;56:140–55. doi: https://doi.org/10.1016/j.bbi.2016.02.020
- Bailey KR, Crawley JN. Anxiety-related behaviors in mice. In: Buccafusco JJ, editor. Methods of behavior analysis in neuroscience. 2nd ed. Boca Raton, FL: Taylor & Francis Group, LLC; 2009. Chapter 5. Available from: https://www.ncbi.nlm.nih.gov/books/NBK5221/.
- Eagle AL, Mazei-Robison M, Robison AJ. Sucrose preference test to measure stress-induced anhedonia. Bio Protoc. 2016;6:e1822.
- Berry A, Bellisario V, Capoccia S, Tirassa P, Calza A, Alleva E, et al. Social deprivation stress is a triggering factor for the emergence of anxiety- and depression-like behaviours and leads to reduced brain BDNF levels in C57BL/6J mice. Psychoneuroendocrinology. 2012;37:762–72. doi: https://doi.org/10.1016/j.psyneuen.2011.09.007
- Yalcin I, Belzung C, Surget A. Mouse strain differences in the unpredictable chronic mild stress: a four-antidepressant survey. Behav Brain Res. 2008;193:140–3. doi: https://doi.org/10.1016/j.bbr.2008.04.021
- Ecker J, Scherer M, Schmitz G, Liebisch G. A rapid GC-MS method for quantification of positional and geometric isomers of fatty acid methyl esters. J Chromatogr B Analyt Technol Biomed Life Sci. 2012;897:98–104. doi: https://doi.org/10.1016/j.jchromb.2012.04.015
- Jačan A, Kashofer K, Zenz G, et al. Synergistic and antagonistic interactions between antibiotics and synbiotics in modifying the murine fecal microbiome. Eur J Nutr. 2019. in press.
- Schmittgen TD, Livak KJ. Analyzing real-time PCR data by the comparative CT method. Nat Protoc. 2008;3:1101–8. doi: https://doi.org/10.1038/nprot.2008.73
- Desbonnet L, Clarke G, Traplin A, O’Sullivan O, Crispie F, Moloney RD, et al. Gut microbiota depletion from early adolescence in mice: Implications for brain and behaviour. Brain Behav Immun. 2015;48:165–73. doi: https://doi.org/10.1016/j.bbi.2015.04.004
- Sanmiguel C, Gupta A, Mayer EA. Gut microbiome and obesity: a plausible explanation for obesity. Curr Obes Rep. 2015;4:250–61. doi: https://doi.org/10.1007/s13679-015-0152-0
- Suarez-Zamorano N, Fabbiano S, Chevalier C, Stojanović O, Colin DJ, Stevanović A, et al. Microbiota depletion promotes browning of white adipose tissue and reduces obesity. Nat Med. 2015;21:1497–501. doi: https://doi.org/10.1038/nm.3994
- Cani PD, Bibiloni R, Knauf C, Waget A, Neyrinck AM, Delzenne NM, et al. Changes in gut microbiota control metabolic endotoxemia-induced inflammation in high-fat diet-induced obesity and diabetes in mice. Diabetes. 2008;57:1470–81. doi: https://doi.org/10.2337/db07-1403
- Gao K, Pi Y, Mu CL, Peng Y, Huang Z, Zhu WY. Antibiotics-induced modulation of large intestinal microbiota altered aromatic amino acid profile and expression of neurotransmitters in the hypothalamus of piglets. J Neurochem. 2018;146:219–34. doi: https://doi.org/10.1111/jnc.14333
- Gao K, Pi Y, Mu CL, Farzi A, Liu Z, Zhu WY. Increasing carbohydrate availability in the hindgut promotes hypothalamic neurotransmitter synthesis: aromatic amino acids linking the microbiota-brain axis. J Neurochem. 2019;149:641–59. doi: https://doi.org/10.1111/jnc.14709
- Koh A, De Vadder F, Kovatcheva-Datchary P, Backhed F. From dietary fiber to host physiology: short-chain fatty acids as key bacterial metabolites. Cell. 2016;165:1332–45. doi: https://doi.org/10.1016/j.cell.2016.05.041
- Naseribafrouei A, Hestad K, Avershina E, Sekelja M, Linløkken A, Wilson R, et al. Correlation between the human fecal microbiota and depression. Neurogastroenterol Motil. 2014;26:1155–62. doi: https://doi.org/10.1111/nmo.12378
- Jiang H, Ling Z, Zhang Y, Mao H, Ma Z, Yin Y, et al. Altered fecal microbiota composition in patients with major depressive disorder. Brain Behav Immun. 2015;48:186–94. doi: https://doi.org/10.1016/j.bbi.2015.03.016
- Kelly JR, Borre Y, O'Brien C, Patterson E, El Aidy S, Deane J, et al. Transferring the blues: depression-associated gut microbiota induces neurobehavioural changes in the rat. J Psychiatr Res. 2016;82:109–18. doi: https://doi.org/10.1016/j.jpsychires.2016.07.019
- Zheng P, Zeng B, Zhou C, Liu M, Fang Z, Xu X, et al. Gut microbiome remodeling induces depressive-like behaviors through a pathway mediated by the host's metabolism. Mol Psychiatry. 2016;21:786–96. doi: https://doi.org/10.1038/mp.2016.44
- Valles-Colomer M, Falony G, Darzi Y, Tigchelaar EF, Wang J, Tito RY, et al. The neuroactive potential of the human gut microbiota in quality of life and depression. Nat Microbiol. 2019;4:623–32. doi: https://doi.org/10.1038/s41564-018-0337-x
- Sweeney P, O'Hara K, Xu Z, Yang Y. HFD-induced energy states-dependent bidirectional control of anxiety levels in mice. Int J Obes (Lond. 2017;41:1237–45. doi: https://doi.org/10.1038/ijo.2017.112
- Luczynski P, McVey Neufeld KA, Oriach CS, Clarke G, Dinan TG, Cryan JF. Growing up in a bubble: using germ-free animals to assess the influence of the gut microbiota on brain and behavior. Int J Neuropsychopharmacol. 2016;19:pyw020. doi: https://doi.org/10.1093/ijnp/pyw020
- Holzer P, Farzi A, Hassan AM, Zenz G, Jacan A, Reichmann F. Visceral inflammation and immune activation stress the brain. Front Immunol. 2017;8:1613. doi: https://doi.org/10.3389/fimmu.2017.01613
- Arora T, Akrami R, Pais R, et al. Microbial regulation of the L cell transcriptome. Sci Rep. 2018;8:1207. doi: https://doi.org/10.1038/s41598-017-18079-2
- De Silva A, Bloom SR. Gut hormones and appetite control: a focus on PYY and GLP-1 as therapeutic targets in obesity. Gut Liver. 2012;6:10–20. doi: https://doi.org/10.5009/gnl.2012.6.1.10
- McKay NJ, Kanoski SE, Hayes MR, Daniels D. Glucagon-like peptide-1 receptor agonists suppress water intake independent of effects on food intake. Am J Physiol Regul Integr Comp Physiol. 2011;301:R1755–R1764. doi: https://doi.org/10.1152/ajpregu.00472.2011
- Yoshida R, Noguchi K, Shigemura N, Jyotaki M, Takahashi I, Margolskee RF, et al. Leptin suppresses mouse taste cell responses to sweet compounds. Diabetes. 2015;64:3751–62. doi: https://doi.org/10.2337/db14-1462
- Domingos AI, Vaynshteyn J, Voss HU, Ren X, Gradinaru V, Zang F, et al. Leptin regulates the reward value of nutrient. Nat Neurosci. 2011;14:1562–8. doi: https://doi.org/10.1038/nn.2977
- Lu XY, Kim CS, Frazer A, Zhang W. Leptin: a potential novel antidepressant. Proc Natl Acad Sci U S A. 2006;103:1593–8. doi: https://doi.org/10.1073/pnas.0508901103
- Yamada N, Katsuura G, Ochi Y, Ebihara K, Kusakabe T, Hosoda K, et al. Impaired CNS leptin action is implicated in depression associated with obesity. Endocrinology. 2011;152:2634–43. doi: https://doi.org/10.1210/en.2011-0004
- Van Doorn C, Macht VA, Grillo CA, Reagan LP. Leptin resistance and hippocampal behavioral deficits. Physiol Behav. 2017;176:207–13. doi: https://doi.org/10.1016/j.physbeh.2017.03.002
- Macht VA, Vazquez M, Petyak CE, Grillo CA, Kaigler K, Enos RT, et al. Leptin resistance elicits depressive-like behaviors in rats. Brain Behav Immun. 2017;60:151–60. doi: https://doi.org/10.1016/j.bbi.2016.10.008
- Asakawa A, Inui A, Inui T, Katsuura G, Fujino MA, Kasuga M. Leptin treatment ameliorates anxiety in ob/ob obese mice. J Diabetes Complications. 2003;17:105–7. doi: https://doi.org/10.1016/S1056-8727(02)00185-X