
ABSTRACT
Objective
Consumption of a modern Western-type high-fat low-fiber diet increases the risk of obesity. However, how a host responds to such a diet, especially during the early period of dietary transition from a previous low-fat and fiber-rich diet, remains poorly explored.
Methods
Wild-type C57BL/6 mice were fed a normal chow diet or a high-fat diet. Enteric glial cell (EGC) activation was detected through quantitative real-time PCR (qRT-PCR), immunoblotting and immunohistology analysis. Fluorocitrate or genetic deletion of glial fibrillary acidic protein (GFAP)-positive glial-intrinsic myeloid differentiation factor 88 (Myd88) was used to inhibit EGC activation, and the effect of a high-fat diet on obesity was further investigated. The role of MYD88-dependent sensing of commensal products in adipocyte was observed to analyze the effect of obesity.
Results
A dietary shift from a normal chow diet to a high-fat diet in mice induced a transient early-phase emergence of a GFAP-positive EGC network in the lamina propria of the ileum, accompanied with an increase in glial-derived neurotrophic factor production. Inhibition of glial cell activity blocked this response. GFAP-positive glial Myd88 knockout mice gained less body weight after high-fat diet (HFD) feeding than littermate controls. In contrast, adipocyte deletion of Myd88 in mice had no effect on weight gain but instead exacerbated glucose intolerance. Furthermore, short-term fluorocitrate intervention during HFD feeding attenuated body weight gain.
Conclusions
Our findings indicate that EGCs are early responders to intestinal ecosystem changes and the GFAP-positive glial Myd88 signaling participates in regulating obesity.
Introduction
The gut, which is an important organ controllings host metabolic health, is the primary site for absorption of food energy. Obesity predisposes individuals to alter gut microbiota [Citation1]. Compositional and functional disturbances of the gut microbiota, such as dysbiosis, can promote obesity development. The transfer of gut flora from obese mice to germ-free mice has been shown to increase obesity [Citation1]. In humans, intestinal transfer of fecal microbiota from lean donors has been shown to improve insulin sensitivity in recipients with metabolic syndrome [Citation2]. Obesity is also associated with intestinal barrier dysfunction, which causes enhanced permeability and translocation of bacteria or bacterial products to the intestinal lamina propria and systemic circulation[Citation3, Citation4]. This influx of immuno-stimulatory microbial ligands into the circulation has been suggested to drive systemic chronic inflammation, metabolic syndrome, and obesity [Citation5]. Furthermore, obesity predisposes to an altered intestinal immune system and the gut immune system has become a novel therapeutic target for metabolic diseases [Citation6]. The intestinal tract contains its own enteric nervous system (ENS), which includes a large number of neurons and an even greater number of glial cells that control intestinal motor, sensory, absorptive, and secretory functions [Citation7]. However, whether there is an association between the ENS and obesity remains unclear.
Enteric glial cells (EGCs) are the major cellular component of the ENS and are found within the ganglia of the myenteric and submucosal plexuses and in extraganglionic sites, such as the smooth muscle layers and mucosa. EGCs are heterogeneous and exhibitphenotypic plasticity in the expression of feature molecules, such as glial fibrillary acidic protein (GFAP) [Citation8]. However, current understanding of the physiological significance of EGC diversification remains unclear. EGCs play an important role in regulating intestinal motility and are considered to be important in regulating epithelial barrier function, although the latter role remains controversial [Citation9–11]. EGCs can engage in functional crosstalk with all cell types present in the gut wall, including intestinal neurons, gut epithelium, enteroendocrine cells, and immune cells, via direct physical contact or indirect paracrine secretions [Citation12]. EGCs express pattern recognition receptors, especially toll-like receptors (TLRs) [Citation13, Citation14], and are able to perceive and integrate microbiota- and tissue-derived alarmin signals, in a manner somewhat dependent on adaptor myeloid differentiation factor 88 (MYD88) [Citation15]. EGCs express neurotrophic factors, which can regulate intestinal homeostasis, inflammation, and defense against infection through crosstalk between EGC, immune cell, and the gut epithelium [Citation15]. Whether EGCs play a role in metabolic diseases is unknown. In this study, we set up experiments to explore the potential connections between EGC and diet-induced obesity.
Materials and methods
Animal studies
All animal experiments complied with ARRIVE guidelines and were performed in accordance with the National Institutes of Health Guide for the Care and Use of Laboratory animals. All experimental procedures were approved by the Animal Research Committee of Xuzhou Medical University. The mice were housed at 20–22°C with a 12 h light–dark cycle and were provided free access to food and water. All animals were housed in a C57BL/6 (B6) background and maintained at our in-house animal facility free of specific pathogens. Only male mice were used in the experiments. Adiq-cre (stock number 028020), GFAP-cre (stock number 012886), and MyD88fl/fl mice (stock number 008888) were purchased from Jackson Laboratory (Bar Harbor, ME, U.S.A.). WT B6 mice were obtained from Beijing Vital River Laboratory Animal Technology Co., Ltd. (Beijing, China). A normal chow diet (ND), 13.8% of calories from fat (SWS9102) was purchased from Jiangsu Xietong Feed Co., Ltd (Nanjing, China) (supplementary Table S1). A high-fat diet (HFD), 60% of calories from fat (D12492; Research Diets), was purchased from Beijing Keao Xieli Feed Co., Ltd (Beijing, China) (supplementary Table S2).
Fluorocitrate preparation
Fluorocitrate was prepared according to a previously described method [Citation16]. Briefly, DL-fluorocitric acid barium salt (Sigma-Aldrich Co., St. Louis, MO, U.S.A.) was dissolved in 0.1 M HCl, and Ba2+ was precipitated by the addition of 0.1 M Na2SO4. This solution was clarified by centrifugation at 800 × g for 10 min and the supernatant was removed and diluted in saline solution (NaCl, 0.9%) to a final concentration of 100 μM (adjusted to pH 7.0 by addition of 1 N NaOH). For fluorocitrate(FC) treatment, 20 µmol kg−1 FC was administered intraperitoneally twice daily. As the treatment control, some groups of mice were injected with PBS.
Quantitative RT–PCR
Total RNA was extracted from tissues homogenized in TRIzol reagent (Thermo Fisher Scientific, Waltham, MA, U.S.A.). One microgram of purified RNA from each sample was used for reverse transcription to generate cDNA using a high-capacity cDNA reverse transcription kit (Takara, Dalian, China) and the resulting cDNA was used for qPCR in a real-time PCR detection system (Bio-Rad, Hercules, CA, U.S.A.). The relative mRNA expression levels were determined using the 2-△△Ct method, with β-actin as the internal reference control. The primer sequences were as follows: artn (F: 5’-GCACACTAGACCCATGTGTTGC-3’, R: 5’-CTCCCAGAGGAGTTCTCTTTAGC-3’); gdnf (F: 5’-GGGGTGCGTTTTAACTGCC-3’, R: 5’-GTTTAGCGGAATGCTTTCTTAG-3’); s100β (F: 5’-AAGATGGGGATGGGGAGTG-3’, R: 5’-CAAAGCAAACCAAGCTTCC-3’); and β-actin (F: 5’-TATTGGCAACGAGCGGTTC-3’, R: 5’-ATGCCACAGGATTCCATACCC-3’).
Immunoblot
Tissue homogenates were collected in RIPA buffer containing 50 mM Tris (pH 7.4), 150 mM NaCl, 1% Triton X-100,1% sodium deoxycholate, 0.1% SDS with freshly added protease inhibitors and phosphatase inhibitors. They were then clarified by centrifugation at 12,000 rpm and at 4°C for 15 min. The protein concentration in the supernatant was determined using the bicinchoninic acid (BCA) method. Proteins were separated by SDS-PAGE and transferred to polyvinylidene fluoride (PVDF) membranes. Target proteins were incubated with primary antibodies after blocking the PVDF membranes with 5% skim milk for 1 h. After incubation with secondary antibody (horseradish peroxidase-conjugated anti-rabbit IgG), immunoreactive bands were detected using an enhanced chemiluminescence system (Pierce, Rockford, IL, U.S.A.). The rabbit primary Abs against the following proteins were used: Artemin and S100β (Abcam, Cambridge, United Kingdom), and β-actin (Abclonal, Wuhan, China). The band intensities of the blots were quantified using Image J software (National Institutes of Health, Bethesda, MD, U.S.A.).
Immunofluorescence
For immunostaining, ileal segments were fixed in 4% paraformaldehyde at room temperature for 48 h and embedded in paraffin. Serial sections (4 μm) were obtained, deparaffinized in xylene, and rehydrated in graded alcohol solutions. Antigen retrieval was performed using EDTA antigen retrieval buffer (Beyotime, Shanghai, China). The sections were blocked with 3% BSA for 30 min. The sections were incubated with 1:100 diluted mouse polyclonal anti-GFAP (Cusabio, Houston, TX, U.S.A.) and 1:500 diluted rabbit polyclonal anti-HuC/D (Abcam, Cambridge, United Kingdom) overnight at 4°C, followed by incubation with Cy3-labeled goat anti-mouse IgG (Beyotime, Shanghai, China) and Alexa Fluor 488-labeled goat anti-rabbit IgG (Beyotime, Shanghai, China) for 50 min at RT. Nuclei were counterstained with 4’, 6-diamidino-2-phenylindole, dihydrochloride (DAPI) (Beyotime, Shanghai, China). Images were obtained using a fluorescence microscope.
Isolation of EGCs from the myenteric plexus
To determine the expression level of MYD88 in EGCs, we used an anti-MYD88 antibody (Abcam, Cambridge, UK).
EGCs were isolated according to a previously published protocol with minor modification[Citation17]. Briefly, the mice were euthanized and the intestine from the duodenum to the ileum was unraveled. The intestinal segments were washed with cold phosphate buffer (PBS) and cut into 3 cm small segments. The longitudinal muscle/myenteric plexus (LMMP) of the intestine was harvested through creating a gap in the longitudinal muscle and using a moist cotton swab to rub horizontally. The LMMP was placed into a digestion solution (collagenase type II 13 mg, BSA 3 mg, dissolved in 10 ml PBS), and digested at 37°C for 60 min. After centrifugation, the cell pellet was digested with a 0.05% trypsin solution at 37°C for 7 min. The mixture was filtered through a Nitex nylon mesh and centrifuged at 356 g for 8 min. The precipitate was resuspended in enteric neuron media (neurobasal A media with B27, 2 mM L-glutamine, 1% FBS, glial-derived neurotrophic factor (GDNF) 10 ng/ml, and an antibiotic/antimycotic cocktail, all from Thermo Fisher Scientific, Waltham, MA, U.S.A.). The cells were cultured for seven days at 37 °C, with 5% CO2.
Glucose tolerance test (GTT)
For the GTT assay, mice were fasted overnight and then injected intraperitoneally with glucose solution at 2 g/kg. Blood was collected at 0, 30, 60, 90, and 120 min.
Statistical analysis
Data were analyzed using GraphPad Prism 6.0 (GraphPad Software, La Jolla, CA, U.S.A.) and are presented as means ± SE. Statistical significance was determined using an unpaired two-tailed Student’s t-test for two datasets and one-way or two-way analysis of variance (ANOVA) followed by Bonferroni post hoc tests for multiple groups. Statistical significance was set at P < 0.05.
Results
Dietary change initiates a short-term EGC response
Modern industrialization has led to a popularization of high-fat, low-fiber Western-type diets; however, this type of diet increases the risk of fat mass accumulation inside the body and promotes obesity [Citation18]. How a host responds to such a diet, especially during the early-phase of dietary transition, remains unclear. To explore whether EGCs can respond to a dietary ingredient change, wild-type (WT) B6 male mice that were fed an ND were switched to a HFD on day 0, and potential glial cell responses were monitored every other day through examining the mRNA and protein expression of glial cell marker genes in tissue segments from the proximal duodenum to the distal colon using qRT-PCR and immunoblotting, respectively. The mRNA expression levels of calcium-binding protein S100β, glial cell-derived neurotrophic factor (Gdnf), and GDNF family member artemin (Artn) were all significantly up-regulated, especially in the ileum 4–6 days after the dietary shift ((A)). Ileal S100β and ARTN protein expression levels were also elevated on day 3 after HFD feeding ((B, C)). To confirm that the increased expression of S100β and ARTN was indeed derived from EGCs, we intraperitoneally injected fluorocitrate (FC), a relatively selective glial cell inhibitor [Citation19, Citation20], to the mice twice daily for three consecutive days starting from the beginning of HFD feeding. The increase in ileal S100β and ARTN expressions following HFD feeding was blocked after FC treatment ((B, C)). These results imply that the dietary shift from ND to HFD can potentially induce an early EGC response in the ileum.
Figure 1. Dietary change from a normal chow diet (ND) to a high-fat diet (HFD) induced an EGC response. 6-8-week-old WT B6 male mice initially fed with a ND were switched to a HFD on day 0. (A) Time course of the relative mRNA expression of s100β, artn, and gdnf in the indicated intestinal tissue segments after HFD feeding (n = 3-5 in each time point). The small intestine (SI) was manually divided into four approximately equal parts. The segments were labeled sequentially from 1 to 4, starting from the proximal duodenum (SI-1) to the distal ileum (SI-4). ** P < 0.01; ***P < 0.001 using two-way ANOVA plus Bonferroni post hoc tests. (B) Immunoblot analysis of the ileal S100β and ARTN expression at day 3 after HFD consumption. Fluorocitrate (FC) was administered twice daily for three days starting from day 0. Each lane represents a sample from one individual mouse. (C) Densitometry quantification for (B). ** P < 0.01 using one-way ANOVA plus Bonferroni post hoc tests. (D) Immunofluorescence for glial cell marker GFAP and pan-neuronal marker HuC/D in the ileal tissue sections derived from the wild-type B6 mice that were either on a ND or switched to a HFD for three days in the presence or absence of FC treatment. Scale bar, 50 µm; arrows indicate the mucosal GFAP+ glial cells; arrowheads indicate the ganglia of the myenteric plexus.
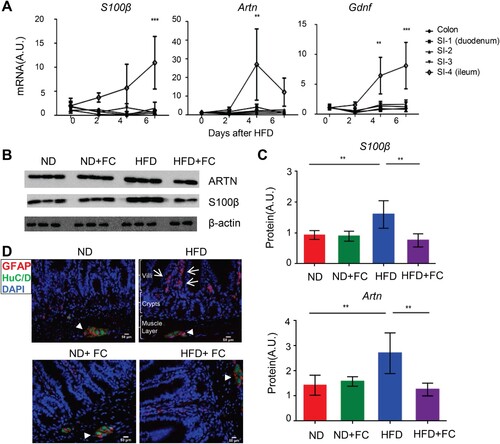
EGCs are heterogeneous populations that exhibit phenotypic plasticity [Citation8]. To explore which populations of EGC respond to dietary changes, we performed immunohistochemical analysis. A glial fibrillary acidic protein (GFAP)-positive glial cell network emerged in the lamina propria within the villi three days post-HFD ((D)), which is known to be rarely found in this area under ND condition [Citation8]. The emergence of GFAP+ glial cell networks in the lamina propria was effectively blocked by FC treatment (D). Interestingly, this effect was location-specific, as FC treatment was ineffective in depleting the GFAP-positive glial cells within the submucosal and myenteric plexus ((D)).
The response of EGCs to dietary change was transient. Upregulation of S100β and ARTN expressions in the ileum was not sustained. Twelve weeks after HFD feeding, S100β and ARTN expression levels had become similar to those of the ND controls (Figure S1(A, B)), and GFAP+ glial cells in the lamina propria area became scarce (Figure S1(C)).
The dietary transition-induced EGC response requires MYD88
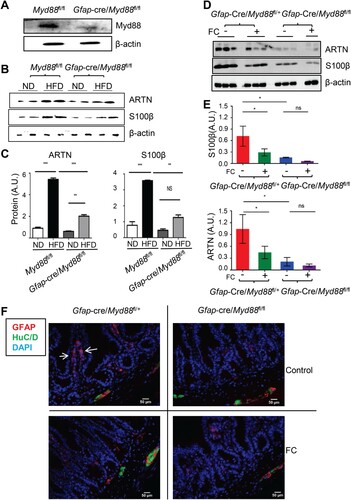
It has been reported that mucosal EGCs can sense commensal products and/or alarmins to produce neurotrophic factors (e.g. ARTN) via a cell-intrinsic MYD88-dependent pathway [Citation15]. To investigate whether the dietary shift-induced GFAP+ glial cell response in the mucosa was MYD88-dependent, we generated GFAP+ glial cell Myd88 knockout mice through crossbreeding Gfap-Cre mice with Myd88fl/fl mice, similar to those described in previous studies[Citation21, Citation22]. GFAP+ glial-intrinsic deletion of Myd88 was confirmed using western blot analysis of MYD88 expression in myenteric glial cells isolated ex vivo from the corresponding mice ((A)). Although GFAP-Cre marks only a subset of EGCs [Citation23], the dietary shift-induced ileal S100β and ARTN expression increment, as well as the mucosal GFAP+ EGCs accumulation, were all significantly attenuated in Gfap-Cre/Myd88fl/fl mice ((B, C)). Furthermore, FC treatment had a minimal effect in further reducing EGC response in these mice ((D-F)). These data suggest that the glial cell-intrinsic MYD88 sensing pathway is required for dietary change-induced mucosal EGC response.
Figure 2. EGC intrinsic MYD88 pathway participated in the dietary transition induced EGC response. (A) Immunoblot analysis of MYD88 expression in ex-vivo purified EGCs collected from the indicated mice. (B-F) 6-8-week-old Gfap-cre/Myd88fl/fl male mice and their littermate controls initially fed with ND were switched to HFD on day 0 and, in the meantime, they were treated with vehicle or FC twice daily. (B and C) Immunoblot analysis of the ileal S100β and ARTN expression on day 3 post HFD (B), and their densitometry quantification (C). **P < 0.01; ***P < 0.001; ns, no statistical significance using one-way ANOVA with Bonferroni post hoc tests. (D and E) Immunoblot analysis of the effect of FC treatment on the ileal S100β and ARTN expression at day 3 post-HFD in the indicated mice (D). (E) densitometry quantification for (D). *P < 0.05; ns, no statistical significance using one-way ANOVA with Bonferroni post hoc tests. (F) Immunofluorescence for glial cell marker GFAP and pan-neuronal marker HuC/D in the ileal tissue sections derived from the indicated mice. Scale bar, 50 µm; arrows indicate the mucosal GFAP+ glial cells.
The glial-intrinsic Myd88 sensing pathway participates in regulating HFD-induced body fat accumulation
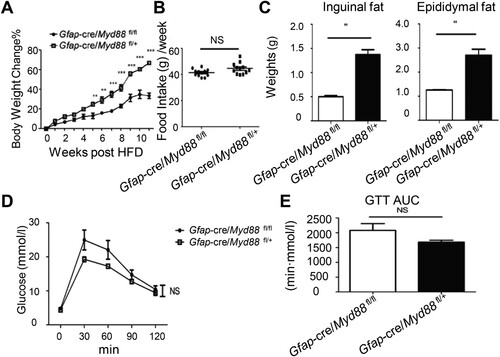
To investigate the physiological importance of MYD88-dependent GFAP+ glial cell signals in HFD-induced obesity, 6-8-week-old Gfap-Cre/Myd88fl/fl and their littermate Gfap-Cre/Myd88fl/+ male mice previously fed ND were switched to HFD on day 0 and maintained on HFD for 12 weeks. Initially, the two groups of mice had similar body weights. After HFD, Gfap-Cre/Myd88fl/fl mice gained less weight on a weekly basis than littermate controls ((A)). However, their food intake was similar ((B)), suggesting a peripheral, rather than a central nervous system effect of the glial Myd88 knockout in regulating weight gain. Twelve weeks after the HFD, Gfap-Cre/Myd88fl/fl mice had accumulated less body fat ((C)). Interestingly, although at this time Gfap-Cre/Myd88fl/fl mice were leaner, their glucose tolerance capacity had no improvement ((D, E)). These results suggest that the glial cell MYD88-dependent sensing pathway participates in HFD-induced obesity, although whether this is related to the diet-induced EGC response remains unclear.
Figure 3. Glial-intrinsic deletion of Myd88 reduced diet-induced fat mass accumulation. 6-8-week-old Gfap-cre/Myd88fl/fl male mice and their littermate controls were fed with HFD for 12 weeks. (A) Weekly body weight changes. **P < 0.01; ***P < 0.001 using two-way ANOVA plus Bonferroni post hoc tests. (B) Weekly food intake. NS, no statistical significance using a t-test. (C) Fat-pad mass at 12 weeks post-HFD. **P < 0.01 using a t-test. (D and E) After 12 weeks of HFD feeding, mice were fasted overnight and administered glucose intraperitoneally. Blood glucose levels were measured at the indicated time point (D) and the area under curve (AUC) was calculated accordingly (E). The statistics were evaluated using two-way ANOVA (D) and T-test (E), respectively. One experiment representative of two independent experiments is shown. Data are presented as mean ± SE (n = 6-8 in each group).
The adipocyte-intrinsic Myd88 sensing pathway modulates HFD-induced glucose metabolic disorders
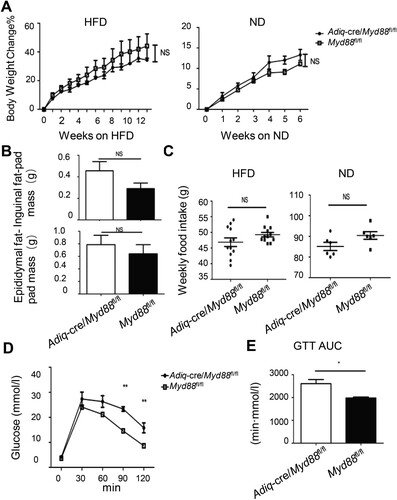
High-fat diet-induced systemic endotoxemia is an important driver in promoting obesity and its related complications [Citation4, Citation24]. Although our data imply a potential link between glial cells and diet-induced obesity, whether MYD88-dependent sensing of commensal products or alarmins in adipocytes directly affects the development of obesity is not clear. To clarify this matter, we deleted Myd88 in adiponectin (Adiq) expressing adipocytes by crossbreeding Adiq-Cre to Myd88fl/fl mice. Adipocyte-intrinsic deletion of Myd88 did not influence weight gain in either HFD- or ND-fed mice ((A)) and did not show an effect on fat mass accumulation after three months of HFD consumption ((B)). The weekly food intake did not change ((C)). Interestingly, although there was no difference in body weight, Adiq-Cre/Myd88fl/fl mice displayed poorer glucose intolerance than the Myd88fl/fl littermate controls ((D, E)). These results suggest that, in contrast to the role of the glial cell-derived MYD88 pathway in promoting fat mass accumulation, the adipocyte intrinsic MYD88 pathway may function as a limiting factor in diet-induced metabolic disturbances.
Figure 4. Adipocyte-intrinsic deletion of Myd88 promoted diet-induced glucose metabolic abnormalities. 6-8-week-old Adiq-cre/Myd88fl/fl male mice and their littermate controls previously fed on ND were switched to HFD. Mice that were continuously fed with ND were used as controls. (A) Body weight changes with time. NS, no statistical significance using two-way ANOVA. (B) Fat-pad mass at 12 weeks post-HFD. NS, no statistical significance using a t-test. (C) Weekly food intake. NS, no statistical significance using a t-test. (D and E) After 12 weeks of HFD feeding, the mice were fasted overnight and then administered glucose intraperitoneally. Blood glucose levels were measured at the indicated time point (D) and the area under curve (AUC) was calculated accordingly (E). *P < 0.05; **P < 0.01 using two-way ANOVA (D) and T-test (E), respectively. One experiment representative of two independent experiments is shown. Data are presented as mean ± SE (n = 6-8 in each group).
Fluorocitrate prevented body weight gain in a glial MYD88-independent manner
As a proof-of-concept, we explored whether early pharmacological interruption of glial function by FC could have any effect on diet-induced obesity. Groups of WT B6 mice previously fed on ND either continued to be fed with ND or were switched to HFD on day 0, and were treated with vehicle or FC intraperitoneally twice daily for one week, after which treatment was discontinued. Once FC treatment was initiated, the mice stopped gaining weight under both ND- and HFD-fed conditions ((A)). However, when FC treatment was terminated, the mice started to regain weight ((A)), implying a transitory and reversible effect of FC treatment. This short-term FC treatment did not induce obvious central nervous system intoxication, as no post-FC anorexia was implicated in the relative food intake measurement ((B)). Four weeks after FC termination no alleviation of HFD-induced glucose intolerance was observed ((C, D)). However, net epididymal fat mass accumulation was attenuated ((E, F)). The inhibitory effect of FC on weight gain was not dependent on GFAP+ glial cell-derived MYD88 signaling, as FC treatment was still effective in inhibiting weight gain in Gfap-Cre/Myd88fl/fl mice ((G)).
Figure 5. Pharmacological intervention using fluorocitrate prevented body weight gain. Groups of wild-type B6 mice previously fed on ND were either continued to be fed with ND or switched to HFD on day 0. Mice were treated with FC or vehicle intraperitoneally for one week starting from day 0, after which treatment was discontinued. (A) Weekly body weight changes. The data were evaluated using two-way ANOVA with Bonferroni post hoc tests. (B) Relative food intake per week. The data were evaluated using one-way ANOVA with Bonferroni post hoc tests. (C) Glucose tolerance test. (D) The area under curve (AUC) for (C). The data were evaluated using one-way ANOVA with Bonferroni post hoc analysis. (E, F) The inguinal (E) and epididymal (F) fat-pad mass in the indicated mice four weeks after FC termination. The data were evaluated using one-way ANOVA with Bonferroni post hoc analysis. (G) 6-8-week-old Gfap-cre/Myd88fl/fl male mice initially fed on ND were switched to HFD on day 0 and, in the meantime, were treated with vehicle or FC twice daily for a total of 3 weeks. Weekly bodyweight changes are shown. All the graph, *P < 0.05; ** P < 0.01; ***P < 0.001; ns, no statistical significance. (n = 5 in each group).

Discussion
Recent research has identified the gut as a critical contributor and important therapeutic target for metabolic disorders [Citation6]. Although it is relatively well-known that long-term high-fat diet-induced enteric immune cell activation can promote metabolic disorders and that, EGCs are present in the gut in large numbers, relatively little is known about the status of EGCs after high-fat diet consumption, especially during the early period of a dietary transition. In this study, we reported that a shift from a ND to an energy-dense high-fat low-fiber diet in mice induced an early phase transient GFAP+ glial cell response in the ileal lamina propria. Blocking EGC activity via either FC treatment or the genetic deletion of Myd88 in GFAP-expressing cells inhibited this response. It has been reported that two to eight weeks of HFD feeding in mice can result in EGC hyperactivation and development of colonic dysmotility [Citation25]. Further extensive HFD feeding for 17 weeks can lead to the loss of myenteric neurons and glial cells [Citation26]. It has also been shown that HFD during the perinatal period can induce the loss of myenteric nitrergic neurons and increase EGC density across the upper digestive tract before the development of obesity [Citation27]. Collectively, these data suggest that the ENS, especially EGCs, function as critical gatekeepers that dynamically monitor and respond to environmental changes in the gut ecosystem to modulate intestinal homeostasis.
Our data further showed that the early disruption of glial activity prevented body weight gain in diet-induced obesity. However, whether this outcome is related to diet-induced EGC response remains unclear. Neither the use of GFAP-Cre mice nor the administration of FC are specific for targeting mucosal GFAP-positive EGCs, and whether GFAP-negative enteric glial cells and/or GFAP-positive cells outside the mucosal lamina propria area play a role in obesity remains to be further explored. Previous studies have indicated that CNS-specific or astrocyte-specific Myd88 KO mice is resistant to HFD-induced obesity [Citation28,Citation29]. Interestingly, both of the mice that fed on HFD had significantly decreased food intake and improved glucose metabolism. In contrast, our Gfap-Cre/Myd88fl/fl and Gfap-Cre/Myd88fl/+ mice showed no differences in food intake, which suggests a peripheral rather than a central nervous system effect of glial Myd88 knockout in regulating the weight gain.
In addition, we found that MYD88 played a difference role in glial cells compared to adipocytes in diet-induced obesity. Glial Myd88 knockout mice gained less body weight after HFD feeding than the littermate controls. In contrast, adipocyte deletion of Myd88 in mice had no effect on weight gain, but exacerbated glucose metabolic disorders. These data imply a division of labor among the different types of cells to form an intricated regulatory network that maintains metabolic homeostasis in the host. Likewise, intestinal epithelial cell-specific deletion of MyD88 partially protects against diet-induced obesity, diabetes and inflammation, whereas myeloid cell MyD88 deletion does not protect against obesity [Citation30].
Our data indicate some similarities between the ENS and the immune system. Much of the innate immune system senses by pattern recognition receptors (PRR), such as transmembrane surface or endosome toll-like receptors (TLRs) and cytosolic nucleotide-binding oligomerization domain (NOD)-like receptors (NLRs) that bind to microbe-associated molecular patterns (MAMPs) expressed by normal microbiota or pathogens. Similar to the innate immune cells, EGCs express PRRs, especially TLRs [Citation13, Citation14]. Thus, the intestinal immune system and EGCs share some common regulatory mechanisms, and are likely to function in combination when facing the gut environmental changes. This perspective is consistent with the view that neuronal and immune cells can form a functional unit and work together to regulate intestinal development, homeostasis, and disease [Citation31].
EGCs can also interact with various other cells, such as neurons, enterocytes, enteroendocrine cells, muscle cells, and endothelial cells [Citation32]. How these interactions might influence obesity remains an open question. A recent finding implies that some microbially responsive neurons in the distal ileum and proximal colon autonomously regulate blood glucose levels, however, they do not express pathogen recognition receptors, including TLRs [Citation33]. It is possible that ileal mucosal EGCs respond to certain microbial-related signals and relay information to neuron to modulate glucose metabolism.
Several important questions remain to be addressed, as follows: (1) Which dietary ingredient causes EGC activation? The ingredients of the ND and HFD were quite different. In addition to fat, the HFD had less dietary fiber and more sugar components than the ND. Lard is the most important component of a HFD that contributes to obesity [Citation34]. Short-term consumption of high-fat and fructose diets has been reported to cause astroglial activation in the rat hippocampus [Citation35]. (2) What exactly might EGCs be responding to during the dietary ingredient transition? Kabouridis et al. suggested that mucosal glial cell network formation is dependent on gut microbiota [Citation13]. (3) Which glial cell subtype responds to dietary-induced perturbations? Although the dietary shift from an ND to an HFD induced mucosal GFAP+ EGC accumulation, these cells might have originated from progenitor cells located in the ganglionic plexus, as suggested in a previous study [Citation13]. It is possible that progenitor cells can sense dietary changes, differentiate, and migrate to the villi. Another possibility is that mucosal EGCs can sense and respond in situ. Given that mucosal EGCs are located in close proximity to the intestinal lumen, they are better suited to respond to changes occurring in the lumen.
One possible scenario of mucosal EGC sensing might be the regulation of gut microbiota. Mucosal EGCs can release neurotrophic factors, such as GDNF and ARTN [Citation15]. These neurotrophic factors can activate innate lymphoid-like cell type 3 (ILC3) to produce interleukin-22 (IL-22) [Citation15]. IL-22 stimulates the gut epithelium to produce anti-microbial peptides and these anti-microbial peptides, which can promote dysbiosis in the gut [Citation36]. Dysbiotic microbiota attain an increased capacity to harvest energy from the diet [Citation1], which in the short term can be beneficial for the host in helping to absorb dietary nutrients. However long-term dysbiosis with an HFD leads to obesity.
In summary, our findings showed a dietary ingredient shift-induced mucosal EGC response, and the close relationship between diet and the ENS suggests the potential for a novel node of regulation in diet-induced obesity.
Supplemental Material
Download MS Word (676.1 KB)Data availability statement
Data are available from the corresponding author upon reasonable request.
Disclosure statement
No potential conflict of interest was reported by the author(s).
Additional information
Funding
Notes on contributors
Zhuanzhuan Liu
Zhuanzhuan Liu is associate professor, working in the Department of Pathogenic Biology and Immunology, Laboratory of Infection and Immunity, Jiangsu Key Laboratory of Immunity and Metabolism, Xuzhou Medical University. Her work focuses on enteric neuroimmunity.
Hongxiang Sun
Hongxiang Sun is master student of Xuzhou Medical University, now working in the Department of Laboratory, Xuzhou First People's Hospital, China.
Shihong Xu
Shihong Xu is master student of Xuzhou Medical University. His work focuses on the pathogenesis of metabolic disorders.
Hanying Wang
Hanying Wang is master student of Xuzhou Medical University.
Zhiwei Zhang
Zhiwei Zhang is master student of Xuzhou Medical University.
Yanxia Wei
Yanxia Wei is professor, working in the Department of Pathogenic Biology and Immunology, Laboratory of Infection and Immunity, Jiangsu Key Laboratory of Immunity and Metabolism, Xuzhou Medical University. Her work focuses on the interaction of microbiota metabolites and obesity.
Yanbo Kou
Yanbo Kou is associate professor, working in the Department of Pathogenic Biology and Immunology, Laboratory of Infection and Immunity, Jiangsu Key Laboratory of Immunity and Metabolism, Xuzhou Medical University. His work focuses on the pathogenesis of metabolic disorders.
Yugang Wang
Yugang Wang is professor, working in the Department of Pathogenic Biology and Immunology, Laboratory of Infection and Immunity, Jiangsu Key Laboratory of Immunity and Metabolism, Xuzhou Medical University. His work focuses on the pathogenesis of metabolic disorders. Additional projects focus on the role of enteric glial cells in regulating obesity.
References
- Turnbaugh PJ, Ley RE, Mahowald MA, Magrini V, Mardis ER, Gordon JI. An obesity-associated gut microbiome with increased capacity for energy harvest. Nature. 2006;444:1027–31.
- Vrieze A, Van Nood E, Holleman F, Salojarvi J, Kootte RS, Bartelsman JF, et al. Transfer of intestinal microbiota from lean donors increases insulin sensitivity in individuals with metabolic syndrome. Gastroenterology. 2012;143:913–6. e7.
- Amar J, Chabo C, Waget A, Klopp P, Vachoux C, Bermudez-Humaran LG, et al. Intestinal mucosal adherence and translocation of commensal bacteria at the early onset of type 2 diabetes: molecular mechanisms and probiotic treatment. EMBO Mol Med. 2011;3:559–72.
- Cani PD, Amar J, Iglesias MA, Poggi M, Knauf C, Bastelica D, et al. Metabolic endotoxemia initiates obesity and insulin resistance. Diabetes. 2007;56:1761–72.
- Cani PD, Bibiloni R, Knauf C, Waget A, Neyrinck AM, Delzenne NM, et al. Changes in Gut microbiota control metabolic endotoxemia-induced inflammation in high-Fat diet–induced obesity and diabetes in mice. Diabetes. 2008;57:1470–81.
- Winer DA, Luck H, Tsai S, Winer S. The intestinal immune system in obesity and insulin resistance. Cell Metab. 2016;23:413–26.
- Vergnolle N, Cirillo C. Neurons and glia in the enteric nervous system and epithelial barrier function. Physiology. 2018;33:269–80.
- Boesmans W, Lasrado R, Vanden Berghe P, Pachnis V. Heterogeneity and phenotypic plasticity of glial cells in the mammalian enteric nervous system. Glia. 2015;63:229–41.
- Neunlist M, Rolli-Derkinderen M, Latorre R, Van Landeghem L, Coron E, Derkinderen P, et al. Enteric glial cells: recent developments and future directions. Gastroenterology. 2014;147:1230–7.
- Grundmann D, Loris E, Maas-Omlor S, Huang W, Scheller A, Kirchhoff F, et al. Enteric glia: S100, GFAP, and beyond. Anat Rec. 2019;302:1333–44.
- Rao M, Rastelli D, Dong L, Chiu S, Setlik W, Gershon MD, et al. Enteric glia regulate gastrointestinal motility but are not required for maintenance of the epithelium in mice. Gastroenterology. 2017;153:1068–81.
- Vales S, Touvron M, Van Landeghem L. Enteric glia: diversity or plasticity? Brain Res. 2018;1693:140–5.
- Kabouridis PS, Lasrado R, McCallum S, Chng SH, Snippert HJ, Clevers H, et al. Microbiota controls the homeostasis of glial cells in the gut lamina propria. Neuron. 2015;85:289–95.
- Paola B, Maria Cecilia G, Marsela Q, Andrea P, Valentina C, Chiara Z, et al. Toll-like receptor 2 regulates intestinal inflammation by controlling integrity of the enteric nervous system. Gastroenterology. 2013;145:1323–33.
- Ibiza S, Garcia-Cassani B, Ribeiro H, Carvalho T, Almeida L, Marques R, et al. Glial-cell-derived neuroregulators control type 3 innate lymphoid cells and gut defence. Nature. 2016;535:440–3.
- Paulsen RE, Contestabile A, Villani L, Fonnum F. An in vivo model for studying function of brain tissue temporarily devoid of glial cell metabolism: the use of fluorocitrate. J Neurochem. 1987;48:1377–85.
- Smith TH, Ngwainmbi J, Grider JR, Dewey WL, Akbarali HI. An in-vitro preparation of isolated enteric neurons and glia from the myenteric plexus of the adult mouse. J Visualized Exp. 2013;(78):50688.
- Turnbaugh PJ. Microbes and diet-induced obesity: fast, cheap, and Out of control. Cell Host Microbe. 2017;21:278–81.
- Fonnum F, Johnsen A, Hassel B. Use of fluorocitrate and fluoroacetate in the study of brain metabolism. Glia. 1997;21:106–13.
- Nasser Y, Fernandez E, Keenan CM, Ho W, Oland LD, Tibbles LA, et al. Role of enteric glia in intestinal physiology: effects of the gliotoxin fluorocitrate on motor and secretory function. American J Physiology Gastrointestinal and Liver Physiology. 2006;291:G912–27.
- Tao J, Wu H, Lin Q, Wei W, Lu XH, Cantle JP, et al. Deletion of astroglial dicer causes non-cell-autonomous neuronal dysfunction and degeneration. J Neuroscience: The Official Journal of the Society for Neuroscience. 2011;31:8306–19.
- Hou B, Reizis B, DeFranco AL. Toll-like receptors activate innate and adaptive immunity by using dendritic cell-intrinsic and -extrinsic mechanisms. Immunity. 2008;29:272–82.
- Laranjeira C, Sandgren K, Kessaris N, Richardson W, Potocnik A, Vanden Berghe P, et al. Glial cells in the mouse enteric nervous system can undergo neurogenesis in response to injury. J Clin Invest. 2011;121:3412–24.
- Gregor MF, Hotamisligil GS. Inflammatory mechanisms in obesity. Annu Rev Immunol. 2011;29:415–45.
- Antonioli L, D'Antongiovanni V, Pellegrini C, Fornai M, Benvenuti L, di Carlo A, et al. Colonic dysmotility associated with high-fat diet-induced obesity: role of enteric glia. FASEB Journal: Official Publication of the Federation of American Societies for Experimental Biology. 2020;34:5512–24.
- Beraldi EJ, Borges SC, de Almeida FLA, Dos Santos A, Saad MJA, Buttow NC. Colonic neuronal loss and delayed motility induced by high-fat diet occur independently of changes in the major groups of microbiota in Swiss mice. Neurogastroenterol Motil. 2020;32:e13745.
- McMenamin CA, Clyburn C, Browning KN. High-Fat diet during the perinatal period induces loss of myenteric nitrergic neurons and increases enteric glial density, prior to the development of obesity. Neuroscience. 2018;393:369–80.
- Kleinridders A, Schenten D, Könner AC, Belgardt BF, Mauer J, Okamura T, et al. Myd88 signaling in the CNS is required for development of fatty acid-induced leptin resistance and diet-induced obesity. Cell Metab. 2009;10(4):249–59.
- Jin S, Kim KK, Park BS, Kim DH, Jeong B, Kang D, et al. Function of astrocyte MyD88 in high-fat-diet-induced hypothalamic inflammation. J Neuroinflammation. 2020;17(1):195.
- Everard A, Geurts L, Caesar R, Van Hul M, Matamoros S, Duparc T, et al. Intestinal epithelial MyD88 is a sensor switching host metabolism towards obesity according to nutritional status. Nat Commun. 2014;5:5648.
- Veiga-Fernandes H, Pachnis V. Neuroimmune regulation during intestinal development and homeostasis. Nat Immunol. 2017;18:116–22.
- Grubisic V, Verkhratsky A, Zorec R, Parpura V. Enteric glia regulate gut motility in health and disease. Brain Res Bull. 2018;136:109–17.
- Muller PA, Matheis F, Schneeberger M, Kerner Z, Jove V, Mucida D. Microbiota-modulated CART(+) enteric neurons autonomously regulate blood glucose. Science. 2020;370:314–21.
- Kubant R, Poon AN, Sánchez-Hernández D, Domenichiello AF, Huot PS, Pannia E, et al. A comparison of effects of lard and hydrogenated vegetable shortening on the development of high-fat diet-induced obesity in rats. Nutrition Diabetes. 2015;5(12):e188.
- Calvo-Ochoa E, Hernández-Ortega K, Ferrera P, Morimoto S, Arias C. Short-term high-fat-and-fructose feeding produces insulin signaling alterations accompanied by neurite and synaptic reduction and astroglial activation in the rat hippocampus. J Cerebal Blood Flow and Metabolism. 2014;34(6):1001–8.
- Eidenschenk C, Rutz S, Liesenfeld O, Ouyang W. Role of IL-22 in microbial host defense. Curr Top Microbiol Immunol. 2014;380:213–36.