
ABSTRACT
Objectives: Odor hedonic perception is well known to exhibit great variability and to depend on several parameters, i.e. stimulus, context, and subject characteristics. As hedonic perception (pleasant/unpleasant character) of food odors is considered one of the most prominent dimensions in eating behavior, the question of hedonic variability in this context arises. Thus, the aim of the present study was to compare odor hedonic ratings in three populations with regard to diet (i.e. omnivore, vegetarian, and flexitarian diets). Methods: Four categories of odors were compared: meat, vegetable, other food, and non-food odors. Results: The results showed that vegetarian and flexitarian individuals rated meat odors as more unpleasant than omnivores, while no significant difference was found for other categories of odors. Discussion: The question of whether the diet influences the hedonic perception or/and inversely is discussed, regarding several aspects of food consumption such as eating disorders, food education, … and could further serve to manage eating behaviors.
Practical applications: This study evidenced that vegetarians and flexitarians specifically rated meat odors as being more unpleasant than those of omnivores. Because of the growing number of vegetarians and flexitarians in the general population, it could be suggested to take into account the odor hedonic perception (especially regarding food odors) in studies related to diets. Besides, the present results could further serve research in several aspects of food consumption such as eating disorders (anorexia, bulimia … etc.) or food education as well as the management of eating behaviors, especially in an elderly population.
1. Introduction
Chemical senses are crucial in the animal kingdom and are involved in a large variety of adaptative behaviors such as predators avoidance, mates selection, and foraging. In humans, the sense of smell plays an important role in many adaptative behaviors, especially eating behavior [Citation1]. Nevertheless, olfactory perception appears as a complex and multidimensional process, partly due to the salient affective dimension of odors. Indeed, odor hedonic perception is considered the first and most prominent response following olfactory stimulation [Citation2]. Odor hedonic perception is well known to exhibit great variability and to depend on several parameters. Some parameters are related to the olfactory stimulus such as concentration/intensity [Citation3,Citation4], familiarity and stimulating/relaxing properties [Citation5], odorant structure [Citation6,Citation7], and molecular complexity [Citation8]. Other factors are more related to the context such as repeated exposures [Citation9], stimulus pathway [Citation10], or verbal influence [Citation11]. Odor hedonic ratings also appear to depend on individual characteristics such as age [Citation12,Citation13], sex [Citation14], and specific diseases such as depressive disorders [Citation15], schizophrenia [Citation16], or Parkinson’s disease [Citation17]. Additionally, it has been shown that subject’s physiological state participates in the variability of odor hedonic ratings. For example, some studies highlighted that hormonal state, especially in women, played a significant role in odor hedonic perception. Thus, in the 1990s, it was demonstrated that women in the ovulatory phase rated androstenone odorant as being more pleasant, whereas the hedonic ratings of nicotine and phenylethyl alcohol did not change in the course of the cycle [Citation18]. In another way, pregnant women rated the odors ‘rum’, ‘cigarette’ and ‘coffee’ as more aversive than non-pregnant women [Citation19]. In the field of odor hedonic variability related to food intake, hunger/satiety state is undoubtedly the main physiological parameter. For instance, food odors are perceived to be more pleasant before compared to after a meal [Citation20,Citation21]. Jointly, changes in odor hedonic ratings are found in eating disorders such as anorexia. Anorexic patients rated food odor (isoamyl acetate) as being less pleasant than healthy controls, although no difference was observed in the case of non-food odor (n-butanol) [Citation22]. Similarly, a study investigated whether a patient with anorexia presented modifications of hedonic responses to food cues (liking) and of the desire to eat foods (wanting) as a function of their motivational state (hunger vs satiety) and energy density of foods (high vs low) [Citation23]. Specifically, data showed that odors with high energy density were rated less pleasant just before a meal compared to healthy controls. Furthermore, the relationship between odor hedonic ratings and body mass index (BMI) is not clear. In the late 1970s, Thompson et al. [Citation24] indicated that normal-weight and obese subjects did not differ in hedonic response to sucrose (taste) and benzaldehyde (odor). However, a recent functional Magnetic Resonance Imagery (fMRI) study showed an increased activation in the primary olfactory cortex, especially in the piriform cortex, in relation to the increase of BMI during hedonic rating of food odors [Citation25]. Besides, a positive association between BMI and the ability to image odors and foods (mental representations) has been found [Citation26]. Surprisingly, although studies focused on the influence of different parameters on odor hedonic perception, no specific studies have really taken into account the impact of food diet on pleasantness/unpleasantness ratings, especially with respect to food and non-food odors.
In recent years, public concern for animal welfare, and animal and environmental protection is rising [Citation27]. In this context, more and more individuals modify their food behavior habits and convert to other diets such as vegetarian and flexitarian diets. In addition to animal welfare and environmental protection, health benefit is also frequently mentioned. Some positive health effects of a vegetarian/flexitarian food diet have been described: reduction of body weight and increase of postprandial metabolism and insulin sensitivity [Citation28], decreased risk of cataracts, especially in people with overweight [Citation29], lower risk of prostate cancer [Citation30], and lower anxiety scores [Citation31]. Moreover, a plant-based diet was related to better performance in memory and executive function in older adults [Citation32]. Conversely, other negative effects have also been pointed out such as lower energy intake [Citation33], vitamin B12 deficiency [Citation34], lower levels of iron inducing an increased risk of developing anemia [Citation35], or a rise of homocysteine levels [Citation36].
As the number of vegetarians and flexitarians is constantly growing [Citation37], it seems relevant to investigate affective responses to food in these populations compared to omnivores. In this field, studies demonstrated that picture subjective ratings were significantly different between vegetarian and omnivore individuals [Citation38–41]. Stockburger et al. [Citation38] examined affective responses to images with event-related potentials (ERPs) in 12 vegetarians and 12 omnivores and showed that vegetarians assessed meat dishes as negative. Moreover, the same pictures elicited enlarged Late Positive Potential (LPPs) over posterior regions in vegetarians compared to omnivores. Giraldo et al. [Citation40] investigated the cognitive reappraisal during exposure to vegetarian (e.g. vegetables, fruits) and nonvegetarian food pictures (meat and fish dishes) in 24 vegetarians and 21 omnivores with ERPs and subjective measures. The results indicated discrepancies in subjective data (e.g. desire to eat, pleasantness …) but no group difference in any of the ERP measures. The authors concluded that vegetarians and omnivores participants presented similar neural processing of food pictures. Another study [Citation39] recorded affective and physiological responses induced by food pictures presentation in 40 vegetarians and 45 omnivores. The results showed that vegetarians and omnivores had similar physiological responses for all food pictures, including meat or fish pictures, but presented significant differences in subjective ratings. Specifically, meat and fish pictures elicited a lower desire to eat, lower pleasantness, and lower arousal in vegetarians compared to omnivores. These data were corroborated by the results of a similar study on the women population (21 vegetarians and 21 omnivores) [Citation41]. Vegetarian women assessed non-vegetarian food pictures (i.e. meat, and meat dishes) as less pleasant compared to omnivore women.
In recent years, the flexitarian diet, also known as the semi-vegetarian diet, appears in society and scientific literature. A flexitarian diet is mainly adopted by young adults, probably due to life transitions (e.g. moving away from home and going to university) [Citation42]. According to the Oxford English Dictionary, the flexitarian term is a mixture of ‘flexible’ and ‘vegetarian,’ and refers to individuals following a primary, but not strict, vegetarian diet, with occasional consumption of meat or fish. In scientific literature, the definition of a flexitarian diet varies between studies [Citation43]. Indeed, some authors indicate that participants restrict the intake of red meat [Citation44], while others restrict the intake of fish [Citation45]. In other cases, flexitarians consume dairy products and/or eggs and meat (red meat and poultry ≥1 time/month and <1 time/week) [Citation46]. Other authors define a flexitarian diet as consuming red meat, poultry, or fish no more than once a week [Citation33]. Thus, the best consensus about the definition of flexitarian should be that these individuals reduce their meat and fish intake with an average consumption of less than once a week. Regarding the flexitarian diet, most of the studies focus on the health effects, and so far, no studies have been conducted on the affective responses induced by chemical cues, i.e. visual, semantic, and especially by food and non-food odors, in flexitarians.
Based on the global findings regarding hedonic ratings of food pictures [Citation38–41], it seems relevant to assess hedonic ratings of food odors. Thus, the aim of the present study was to compare odor hedonic ratings of food and non-food odors in three populations, i.e. vegetarian, flexitarian, and omnivore participants.
2. Materials and methods
2.1. Participants
Sixty participants aged between 18 and 30 years took part in this study. All participants were undergraduate students from the University of Franche-Comté (France). They were only female to minimize gender effects (for a review, see Bontempi et al., Citation2021). Based on other studies (e.g. Giraldo et al. Citation2019), only vegetarians and flexitarians following this diet for at least one year were kept in the study. Participants were divided into three groups based on their food diet: vegetarians (N = 20, mean age = 22.8 years, SD = 3.86; mean number of years in the diet = 8.25 years, SEM = 2.13), flexitarians (N = 20, mean age = 20.55 years, SD = 2.44; mean number of years in the diet = 5.25 years, SEM = 1.52), and omnivores (N = 20, mean age = 20.15 years, SD = 2.18; mean number of years in the diet = 20.15 years, SEM = 0.43).
All reported normal smell sensitivity, i.e. none of them had a history of nasal/sinus disease, extensive exposure to chemicals with potential toxicity (including cigarette smoke), or long-term medical treatment. Besides, none of the participants reported having any medical conditions, including those associated with eating disorders such as anorexia or bulimia. All participants completed a questionnaire with personal/demographic and eating habits information, including questions about their food diet: ‘What type of diet do you follow?’, ‘For how long?’ and ‘For which reasons do you follow this diet?’.
There are no rigorous consensus criteria for being considered vegetarian, flexitarian, or omnivore. However, in the present study, vegetarians did not eat meat or fish, flexitarians eat meat or fish seldom (i.e. once per week or less) and omnivores consumed meat and fish without any restriction (i.e. several times per week to several times a day). Most vegetarians reported moral and ethical reasons for choosing this diet (30% for both environment and animal welfare and protection, 40% for ethical concerns, 15% for both overconsumption and disgust for meat, and 10% for health reasons). In flexitarians, the same keywords were reported (30% for both environment and animal welfare and protection, 20% for disgust for meat, 15% for both overconsumption and health reasons, and 10% for both ethical concerns and desire). In omnivore participants, all reported choosing this diet because it has been their diet since their birth.
The study was conducted in accordance with the Declaration of Helsinki-Hong Kong and the study design was approved by the Human Protection Committee East Area II (Besançon, France). Each participant gave her written informed consent before inclusion in the study and a random number was assigned to each participant upon arrival.
2.2. Stimuli
Twelve odorants were selected based on their quality (food or no food odors) and category (meat, vegetables, non-food, and other food except meat and vegetables). Ten participants, different from the present study, were asked to associate each odor with one of the four specific categories. Meat odors were Bacon (Meilleurduchef®, France), Veal (Laboetgato®, France), and Beef ‘pot au feu’ (Laboetgato®, France). Vegetable odors were Celery (Culinaide®, France), Fennel (Meilleurduchef®, France), and Asparagus (Culinaide®, France). Other food odors were ‘Roquefort’ (Meilleurduchef®, France), Coffee (Meilleurduchef®, France), and Chocolate (Meilleurduchef®, France). Non-food odors were Smoke (Meilleurduchef®, France), Gasoline (‘sans Plomb 95’), and Glue (Scotch®, 30 ml). For each odorant, 6 ml was placed in a 30 mL amber glass bottle for the stimulus presentation and evaluation.
2.3. Odor affective ratings
Participants sat on a chair in a quiet and well-ventilated room and rated hedonicity, intensity, and edibility of odors. The hedonic rating was evaluated using a visual analog scale from −9 to +9 (‘extremely unpleasant’ to ‘extremely pleasant’). The intensity and edibility ratings were evaluated using visual analog scales from 0 to +9 (‘not intense/not edible’ to ‘extremely intense/extremely edible’). The experimenter presented the twelve odors one by one in a randomized order. According to recent studies on odor hedonic ratings [Citation5,Citation13], the time interval between each odor presentation corresponded to the time required to complete the three scales (around 2 min). During the experiment, participants were not informed of the odor names and categories.
2.4. Procedure
The experiment was carried out in a quiet and well-ventilated room located at the University of Franche-Comté. Upon arrival, participants were invited to give their written informed consent and to fill out demographic (age, sex, diseases,etc.) and a questionnaire of eating habits. After verbal instructions on the procedure, odorants were presented one by one and in randomized order, to each participant.
Participants were asked not to consume any food or drink (except water) at least two hours before the experiment to minimize the satiety state effect on olfactory tests [Citation20]. The experimenter obtained verbal confirmation that participants followed all testing day requirements (breakfast was the last meal). All participants performed the test in one session between 9:30 am and 11:30 am and the session test lasted 30 min on average.
The experimental room was ventilated 15 min before each participant. This experiment was conducted with the application of local health measures to combat the SARS-CoV-2 pandemic. Participants did not receive monetary compensation. The purpose of the study was revealed to each participant after their participation.
2.5. Data analysis
Data on odor hedonic, intensity, and edibility ratings were analyzed with Statistica® sotfware (version 13) for each diet and each odor, using ANOVAs and Spearman correlations. Post-hocs were realized using Fisher tests. A significant difference was considered for p < 0.05 and the non-significant results are noted as NS.
3. Results
To test whether vegetarians, flexitarians, and omnivores experienced odor categories differently or experienced only specific odor categories differently, ANOVAs were conducted on odor hedonic, intensity, and edibility ratings with diet (vegetarians, flexitarians, and omnivores) as the between-subjects factor and odor category (meat odor, vegetable odors, other food odors, and non-food odors) as the within-subjects factor. Moreover, independently of the diet, ANOVAs were conducted on odor ratings with Odor factor for odors within the same category (e.g. in the vegetable odors category, Odor factor was the name of three odors, i.e Fennel, Asparagus, and Celery) for each odor category (meat odor, vegetable odors, other food odors, and non-food odors).
3.1. Odor hedonic ratings
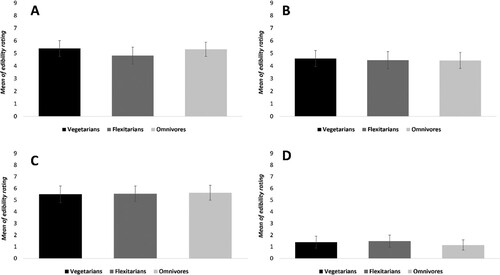
Hedonic ratings of meat odors were influenced by the participant’s diet. Indeed, the main effect of the Diet factor was demonstrated (F (2,118) = 10.35; p < 0.001). Thus, vegetarian and flexitarian participants rated meat odors as being more unpleasant than omnivore participants (vegetarians vs. omnivores: p < 0.001; flexitarians vs. omnivores: p < 0.001) (). However, no hedonic rating difference was highlighted between vegetarian and flexitarian participants.
Figure 1. Mean (and SEM) of odor hedonic ratings for meat odor (A), vegetable odors (B), other food odors (C), and non-food odors (D), in each diet. Error bars correspond to the standard error of the mean (SEM). Odor hedonic ratings were rated on a visual analogic scale from −9 to +9. Significant differences were noted using * p < 0.05; ** p < 0.01; *** p < 0.001.
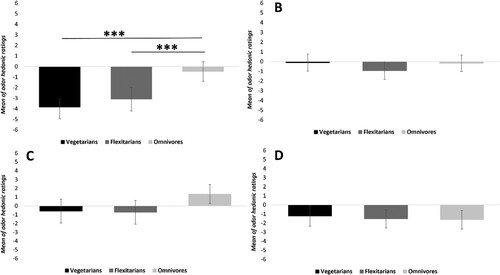
There was no main effect of Diet factor for vegetable odors (F (2,118) = 0.89; NS), other food odors (F (2,118) = 0.29; NS), and non-food odors (F (2,118) = 0.11; NS).
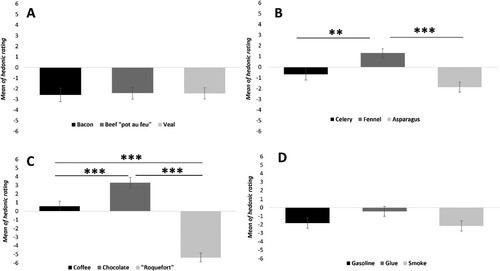
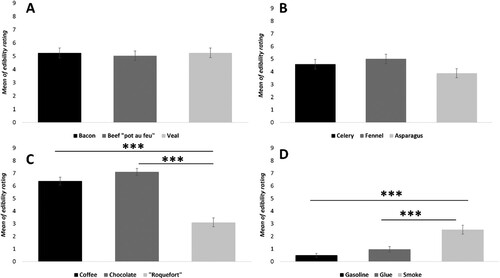
There was no main effect of the Odor factor for meat odors (F (2,118) = 0.03; NS) and for non-food odors (F (2,118) = 2.21; NS). Nonetheless, the main effect of the Odor factor was demonstrated for vegetable odors (F (2,118) = 10.98; p < 0.001) and other food odors (F (2,118) = 63,01; p < 0.001) ().
Figure 2. Mean (and SEM) of odor hedonic ratings for meat odor (A), vegetable odors (B), other food odors (C), and non-food odors (D), independently of diet. Error bars correspond to the standard error of the mean (SEM). Odor hedonic ratings were rated on a visual analogic scale from −9 to +9. Significant differences were noted using * p < 0.05; ** p < 0.01; *** p < 0.001.
No interaction was found between the participant’s diet and odors in each odor category.
3.2. Odor intensity ratings
Intensity ratings of meat odors were influenced by the participant’s diet. Indeed, statistical analysis shows the main effect of Diet factors on odor intensity ratings for meat odors (F (2,118) = 4,12; p < 0.05) (). Fisher post-hoc tests indicate that vegetarians rated meat odor as being more intense than omnivores (p < 0.01), but no significant difference was observed between flexitarians and omnivores. A tendency was found between vegetarians and flexitarians (p = 0.051), suggesting that flexitarians tend to rate meat odor as being less intense than vegetarians.
Figure 3. Mean (and SEM) of odor intensity ratings for meat odor (A), vegetable odors (B), other food odors (C), and non-food odors (D), in each diet. Error bars correspond to the standard error of the mean (SEM). Significant differences were noted using *p < 0.05; **p < 0.01; ***p < 0.001.
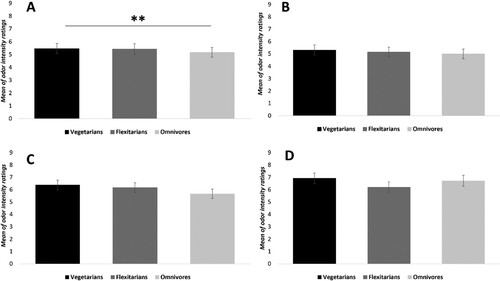
There was no main effect of Diet factor for vegetable odors (F (2,118) = 0.44; NS), other food odors (F (2,118) = 2.86; NS), and non-food odors (F (2,118) = 2.46; NS).
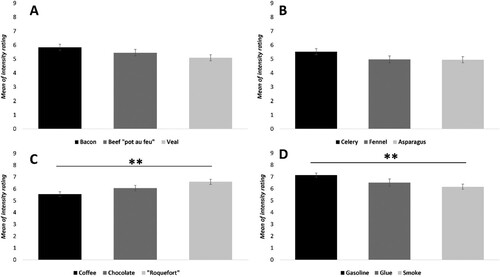
No main effect of the Odor factor was found for meat odors (F (2,118) = 2.94; NS) and vegetable odors (F (2,118) = 1.94; NS). However, the main effect of the Odor factor was demonstrated for other food odor (F (2,118) = 5,86; p < 0.01) and non-food odor (F (2,118) = 4,53; p < 0.05) categories ().
Figure 4. Mean (and SEM) of odor intensity ratings for meat odor (A), vegetable odors (B), other food odors (C), and non-food odors (D), independently of diet. Error bars correspond to the standard error of the mean (SEM). Significant differences were noted using * p < 0.05; **p < 0.01; ***p < 0.001.
No interaction was found between the participant’s diet and odors in each odor category.
3.3. Odor edibility ratings
No main effect of the Diet factor was found in each odor category suggesting that vegetarians, flexitarians, and omnivores did not differ in edibility ratings on meat, vegetables, other food, and non-food odor categories ().
Figure 5. Mean (and SEM) of odor edibility ratings for meat odor (A), vegetable odors (B), other food odors (C), and non-food odors (D), in each diet. Error bars correspond to the standard error of the mean (SEM). Significant differences were noted using *p < 0.05; **p < 0.01; ***p < 0.001.
No main effect of the Odor factor was shown in the meat (F (2,118) = 0.15; NS) and vegetable odor (F (2,118) = 2.28; NS) categories. Nevertheless, there was a main effect of the Odor factor in other food odor (F (2,118) = 44,09; p < 0.001) and non-food odor (F (2,118) = 16,92; p < 0.001) categories ().
Figure 6. Mean (and SEM) of odor edibility ratings for meat odor (A), vegetable odors (B), other food odors (C), and non-food odors (D), independently of diet. Error bars correspond to the standard error of the mean (SEM). Significant differences were noted using *p < 0.05; **p < 0.01; ***p < 0.001.
No interaction was found between participants’ diet and odors in each odor category.
3.4. Correlations
Data on correlations are displayed in .
Table 1. Spearman correlations for Hedonicity/Intensity, Hedonicity/Edibility, and Intensity/Edibility for each diet and each odor category.
For all diets, no correlation was found between hedonicity and intensity (except for meat odor in flexitarian diet, p < 0.01) and between intensity and edibility (except for non-food odors in omnivore diet, p < 0.001). However, many correlations were observed between hedonicity and edibility in all diets and for several odor categories. Specifically, positive correlations were found for meat odors and other food odors categories in each diet, suggesting that odor hedonic ratings increase with odor edibility ratings (vegetarians: meat odors, p < 0.01 and other food odors, p < 0.001; flexitarians: meat odors, p < 0.001 and other food odors, p < 0.001; omnivores: meat odors, p < 0.01, and other food odors, p < 0.001). Thus, more meat and other food odors are rated as being pleasant, and more of these odors are rated as edible. The same data were observed only in vegetarians for vegetable odors (p < 0.01).
4. Discussion
This present study aimed to compare odor hedonic ratings of food and non-food odors in three different diets, i.e. vegetarian, flexitarian, and omnivore participants. Our findings highlighted a higher aversion toward meat odors in vegetarian and flexitarian participants, compared to omnivores. Indeed, odor hedonic ratings of vegetables, other food, and non-food odor categories are similar between the three diets, although omnivores rated other food odors as being slightly pleasant compared to vegetarians and flexitarians who rated them slightly unpleasant. Meat odors, although being perceived as unpleasant in all diets, were significantly rated as more unpleasant in vegetarians and flexitarians than in omnivores, regardless of the meat odor type (i.e, Bacon, Beef ‘pot au feu’ or Veal). Moreover, no difference was observed between vegetarians and flexitarians. Regardless of the diet, in the same odor category, an odor effect was found. Thus, some odors were rated more pleasant/unpleasant than others. This was the case in vegetable and other food odor categories. For example, in the vegetable category, Fennel was significantly rated as being more pleasant than Asparagus and Celery and it was the only odor perceived as pleasant with a positive hedonic score. In the same way, in other food odor categories, the Chocolate odor is rated with a positive hedonic score, Coffee is rated with a neutral hedonic score, and ‘Roquefort’ is rated with a negative hedonic score, independently of the diet. However, no difference was obtained for meat odors: Bacon, Beef ‘pot au feu’, and Veal are perceived as unpleasant whatever the diet. This suggests a homogeneity in hedonic ratings of meat odors compared to vegetable odors or other food odor categories. For intensity ratings, it has been shown that only vegetarians rate meat odors as being more intense than omnivores. No diet effect was found for edibility ratings for all odor categories in all diets suggesting that diet does not influence edibility ratings for any odor category.
Concerning correlations, hedonicity and edibility for meat and other food odors were related in each diet. No correlation was found for the non-food odor category in each diet between hedonicity and edibility ratings. No correlation was found between hedonicity and intensity and between intensity and edibility. In light of these data, it can be possible to conclude that odors’ hedonic ratings for all odor categories do not relate to the intensity, which reinforces previous data obtained in hedonic rating scores for meat odors. In other words, it is not because vegetarians perceived meat odors as being very intense that they rated meat odors as being very unpleasant. Nevertheless, vegetarians and flexitarians rated meat odors as being more unpleasant than omnivores, probably because they find that meat odors are less edible than omnivores. Similar data were obtained for other food odor categories in each diet too.
The present findings are in accordance with previous studies on affective responses to food pictures in vegetarians and omnivores. Indeed, Knight et al. [Citation41], demonstrated that vegetarian women assessed non-vegetarian food pictures (i.e, meat and meat dishes) as less pleasant than omnivore women. Moreover, Anderson et al. [Citation39] and Giraldo et al. [Citation40], showed that meat and fish pictures elicited a lower desire to eat, lower pleasantness, and lower arousal in vegetarians than omnivores. They also noted no differences in physiological (heart rate, facial electromyography activity, and electrodermal activity) and electrophysiological (event-related potentials) responses between vegetarians and omnivores and suggested that vegetarians experienced meat pictures as being unpleasant because that is consistent with their personal beliefs. If this seems consistent for studies using picture presentation this explanation is probably more complex in the case of odors. Indeed, in the present study, participants smelt the different odors without any information on the name or source, to avoid the label effect on odor hedonic ratings [Citation11,Citation47]. Consequently, odors smelt are not necessarily identified by participants contrary to pictures. This implies that the higher aversion toward meat odors stimuli in vegetarians and flexitarians could be related to unconscious processes, beyond their personal beliefs.
Other works also explain that implicit attitudes toward meat and vegetables are different between vegetarians and omnivores [Citation48]. Data obtained from the Implicit Association Test (IAT) and a pictorial version of the Extrinsic Affective Simon Task (EAST) revealed that implicit attitudes toward vegetables, compared to implicit attitudes toward meat, were more positive in vegetarians than in omnivores. In the present study, a difference in vegetable odors’ hedonic ratings could have appeared between vegetarians, flexitarians, and omnivores but no diet effect was found.
Based on the present findings, it would be interesting to know whether vegetarians have adopted this diet because they initially disliked meat or for ethical and environmental reasons, which led them to dislike meat. Some authors showed that meat consumption is positively correlated with disgust sensitivity [Citation49]. It has been suggested that vegetarians experienced meat negatively because they are more sensitive to stimuli perceived as disgusting. Moreover, he reasons for vegetarian diet adoption are related to disgust perception [Citation50]. Indeed, people who adopted a vegetarian diet for moral reasons (i.e, animal welfare … .) find meat as being more disgusting than people who adopted a vegetarian diet for health reasons (i.e, meat is bad for health …). Similarly, MacNair [Citation51] showed that most vegetarians considered meat as being ‘repugnant’. Interestingly, it was demonstrated that vegetarians who adopted this diet for ethical reasons were more likely to find meat as being ‘repugnant’ than those who adopted this diet for health reasons [Citation51]. Moreover, in its literature review, Hamilton [Citation52] concluded that meat is a food product that evokes both ethical concerns and feelings of revulsion and that the latter is heightened by the form of meat. Future studies could examine whether in an omnivore population for whom meat is perceived negatively, people are more sensitive to disgust and whether they would consider changing their current diet and for which reasons.
Odor hedonic perception is subject to many variations [Citation53]. Regarding food intake, hungry/satiety state and BMI are major factors implied in the variability of odor hedonic perception [Citation20,Citation21,Citation25]. On the other hand, it has been shown that the sensory satiety state (SSS) is related to food hedonic perception. The SSS refers to the reduction of the pleasure of eating portion offood compared to a new food. For example, Small et al.[Citation54] showed that the continuous ingestion of pieces of chocolate, stimulating both the olfactory and gustatory systems, led to a reduction of the general hedonic rating of the consumed chocolate. Thus, one may ask whether the sensory satiety state is similar between vegetarians, flexitarians, and omnivores. This issue warrants investigation to determine whether vegetables induce a larger sensory satiety state in vegetarians and flexitarians compared to omnivores, which could then explain the negative experience toward meats in vegetarian and flexitarian diets.
Some other factors could be further investigated. First, BMI was not considered in the present study, and yet, it could have been interesting to compare vegetarians/flexitarians/omnivores with low BMI and vegetarians/ flexitarians/omnivores with high BMI. Indeed, it has been shown that BMI influences odor hedonic ratings specifically for odor with high energy density (e.g. chocolate) [Citation55]. Moreover, in the present study, only women were considered to avoid sex effects on odor hedonic ratings [Citation14]. Nevertheless, a study on both men and women vegetarians would be interesting to analyze the sex effect on odor hedonic response to meat odors. Because of the well-established impact of hunger/satiety status on odor hedonic perception [Citation21], this effect could be thoroughly investigated in future research. Lastly, another diet could be studied: the vegan diet. Indeed, a vegan diet is even more restrictive than vegetarians because people following this diet do not consume any animal food products [Citation56]. Several studies investigated the vegan diet’s effect on health [Citation57] but no study has yet examined the impact of this diet on emotional responses, especially on odor hedonic perception.
Following this study, future research is needed to improve the understanding of hedonic responses, especially to odors, toward meat among vegetarians and flexitarians and, to determine the reasons for this specific aversion. For instance, studies may focus on gut microbiota, diet, and brain function, because it is suggested that diet influences gut microbiota and that the latter is related to brain function [Citation58]. Further studies may also focus on neuronal processing insofar as odors, especially food-related odors, have been shown to elicit cerebral activity in brain reward circuits [Citation59].
From a practical point of view, these findings are relevant regarding several aspects of food consumption such as eating disorders (anorexia, bulimia … etc.) or food education, and could further serve to manage eating behaviors, especially in an elderly population.
Disclosure statement
No potential conflict of interest was reported by the author(s).
Data availability statement
The data that support the findings of this study are available from the corresponding author upon reasonable request.
Additional information
Funding
Notes on contributors
Charlotte Bontempi
Charlotte Bontempi is a final-year Ph.D. student in Neuroscience at the Laboratory of Integrative Research in Neurosciences and Cognitive Psychology, University of Franche-Comté, Besançon, France.
Laurence Jacquot
Laurence Jacquot obtained her PhD in Health Sciences from the University of Franche-Comté, Besançon, France, in 2005. She then worked at the Monell Chemical Senses Center, Philadelphia, USA, as a postdoctoral researcher for two years. In 2009 she joined the Laboratory of Integrative Research in Neurosciences and Cognitive Psychology as an Associate Professor.
Gérard Brand
Gérard Brand obtained his Ph.D. in Neurosciences from the University of Franche-Comté, Besançon, France, in 1993. In 1995 he was hired as an Associate Professor at the University of Franche-Comté, Besançon, France. In 2010 he joined the Centre for Taste and Feeding Behavior (CSGA) in Dijon, France as a researcher in the Group Development of olfactory communication and cognition.
References
- Brand G. Discovering odors. London: Whiley, ISTE; 2020.
- Yeshurun Y, Sobel N. An odor is not worth a thousand words: from multidimensional odors to unidimensional odor objects. Annu Rev Psychol. 2010;61:219–41.
- Doty RL. An examination of relationships between the pleasantness, intensity, and concentration of 10 odorous stimuli. Percept Psychophys. 1975;17:492–6.
- Moskowitz HR, Dravnieks A, Klarman LA. Odor intensity and pleasantness for a diverse set of odorants. Percept Psychophys. 1976;19:122–8.
- Baccarani A, Brand G, Dacremont C, Valentin D, Brochard R. The influence of stimulus concentration and odor intensity on relaxing and stimulating perceived properties of odors. Food Qual Prefer. 2021;87:104030.
- Khan RM, Luk C-H, Flinker A, Aggarwal A, Lapid H, Haddad R, et al. Predicting odor pleasantness from odorant structure: pleasantness as a reflection of the physical world. J Neurosci. 2007;27:10015–23.
- Keller A, Gerkin RC, Guan Y, Dhurandhar A, Turu G, Szalai B, et al. Predicting human olfactory perception from chemical features of odor molecules. Science. 2017;355:820–6.
- Kermen F, Chakirian A, Sezille C, Joussain P, Le Goff G, Ziessel A, et al. Molecular complexity determines the number of olfactory notes and the pleasantness of smells. Sci Rep. 2011;1:206.
- Ferdenzi C, Poncelet J, Rouby C, Bensafi M. Repeated exposure to odors induces affective habituation of perception and sniffing. Front Behav Neurosci. 2014;8:1–10.
- Frasnelli J, Ungermann M, Hummel T. Ortho- and retronasal presentation of olfactory stimuli modulates odor percepts. Chemosens Percept. 2008;1:9–15.
- Ayabe-Kanamum S, Kikuchi T, Saito S. Effect of verbal cues on recognition memory and pleasantness evaluation of unfamiliar odors. Percept Mot Skills. 1997;85:275–85.
- Joussain P, Thevenet M, Rouby C, Bensafi M. Effect of aging on hedonic appreciation of pleasant and unpleasant odors. PLoS One. 2013;8:e61376.
- Vieillard S, Ronat L, Baccarani A, Schaal B, Baudouin J-Y, Brochard R. Age differences in olfactory affective responses: evidence for a positivity effect and an emotional dedifferentiation. Aging Neuropsychol Cognit. 2021. 28:570–83. doi:10.1080/13825585.2020.1799926.
- Bontempi C, Jacquot L, Brand G. Sex differences in odor hedonic perception: an overview. Front Neurosci. 2021;15:1384.
- Atanasova B, El-Hage W, Chabanet C, Gaillard P, Belzung C, Camus V. Olfactory anhedonia and negative olfactory alliesthesia in depressed patients. Psychiatry Res. 2010;176:190–6.
- Urban-Kowalczyk M, Śmigielski J, Kotlicka-Antczak M. Overrated hedonic judgment of odors in patients with schizophrenia. CNS Neurosci Ther. 2018;24:1156–62.
- Utz KS, Martini M, Mrochen A, Lambrecht V, Süß P, Renner B, et al. A multisensory deficit in the perception of pleasantness in Parkinson’s disease. J Parkinson’s Dis. 2021;11:2035–45.
- Hummel T, Gollisch R, Wildt G, Kobal G. Changes in olfactory perception during the menstrual cycle. Experientia. 1991;47:712–5.
- Kölble N, Hummel T, Von Mering R, Huch A, Huch R. Gustatory and olfactory function in the first trimester of pregnancy. Eur J Obstet Gynecol Reprod Biol. 2001;99:179–83.
- Brondel L, Romer M, Van Wymelbeke V, Walla P, Jiang T, Deecke L, et al. Sensory-specific satiety with simple foods in humans: no influence of BMI? Int J Obes. 2007;31:987–95.
- Fernandez P, Bensafi M, Rouby C, Giboreau A. Does olfactory specific satiety take place in a natural setting? Appetite. 2013;60:1–4.
- Schreder T, Albrecht J, Kleemann A. M, Schöpf V, Kopietz R, Anzinger A, et al. Olfactory performance of patients with anorexia nervosa and healthy subjects in hunger and satiety. Rhinology. 2008;46:175–83.
- Jiang T, Soussignan R, Rigaud D, Schaal B. Pleasure for visual and olfactory stimuli evoking energy-dense foods is decreased in anorexia nervosa. Psychiatry Res. 2010;180:42–7.
- Thompson DA, Moskowitz HR, Campbell RG. Taste and olfaction in human obesity. Physiol Behav. 1977;19:335–7.
- Jacobson A, Green E, Haase L, Szajer J, Murphy C. Differential effects of BMI on brain response to odor in olfactory, reward and memory regions: evidence from fMRI. Nutrients. 2019;11:926.
- Patel BP, Aschenbrenner K, Shamah D, Small DM. Greater perceived ability to form vivid mental images in individuals with high compared to low BMI. Appetite. 2015;91:185–9.
- Cornish A, Raubenheimer D, McGreevy P. What We know about the public’s level of concern for farm animal welfare in food production in developed countries. Animals (Basel). 2016;6:74.
- Kahleova H, Petersen KF, Shulman GI, Alwarith J, Rembert E, Tura A, et al. Effect of a low-fat vegan diet on body weight, insulin sensitivity, postprandial metabolism, and intramyocellular and hepatocellular lipid levels in overweight adults: a randomized clinical trial. JAMA Network Open. 2020;3:e2025454.
- Chiu THT, Chang C-C, Lin C-L, Lin M-N. A vegetarian diet is associated with a lower risk of cataract, particularly among individuals with overweight: a prospective study. J Acad Nutr Diet. 2021;121:669–77.e1.
- Tantamango-Bartley Y, Knutsen SF, Knutsen R, Jacobsen BK, Fan J, Beeson WL, et al. Are strict vegetarians protected against prostate cancer? Am J Clin Nutr. 2016;103:153–60.
- Beezhold B, Radnitz C, Rinne A, DiMatteo J. Vegans report less stress and anxiety than omnivores. Nutr Neurosci. 2015;18:289–96.
- Ramey MM, Shields GS, Yonelinas AP. Markers of a plant-based diet relate to memory and executive function in older adults. Nutr Neurosci. 2022;25:276–85.
- Clarys P, Deliens T, Huybrechts I, Deriemaeker P, Vanaelst B, De Keyzer W, et al. Comparison of nutritional quality of the vegan, vegetarian, semi-vegetarian, pesco-vegetarian and omnivorous diet. Nutrients. 2014;6:1318–32.
- Rizzo G, Laganà A, Rapisarda A, La Ferrera G, Buscema M, Rossetti P, et al. Vitamin B12 among vegetarians: status, assessment and supplementation. Nutrients. 2016;8:767.
- Haider LM, Schwingshackl L, Hoffmann G, Ekmekcioglu C. The effect of vegetarian diets on iron status in adults: a systematic review and meta-analysis. Crit Rev Food Sci Nutr. 2018;58:1359–74.
- Naik S, Mahalle N, Bhide V. Identification of vitamin B12 deficiency in vegetarian Indians. Br J Nutr. 2018;119:629–35.
- Ruby MB. Vegetarianism. A blossoming field of study. Appetite. 2012;58:141–50.
- Stockburger J, Renner B, Weike AI, Hamm AO, Schupp HT. Vegetarianism and food perception. Selective visual attention to meat pictures. Appetite. 2009;52:513–6.
- Anderson EC, Wormwood J, Barrett LF, Quigley KS. Vegetarians’ and omnivores’ affective and physiological responses to images of food. Food Qual Prefer. 2019;71:96–105.
- Giraldo M, Buodo G, Sarlo M. Food processing and emotion regulation in vegetarians and omnivores: an event-related potential investigation. Appetite. 2019;141:104334.
- Knight HC, Mowat SL, Hesse C. Fearing the wurst: robust approach bias towards non-vegetarian food images in a sample of young female vegetarian eaters. Appetite. 2020;149:104617.
- Poobalan AS, Aucott LS, Clarke A, Smith WCS. Diet behaviour among young people in transition to adulthood (18-25 year olds): a mixed method study. Health Psychol Behav Med. 2014;2:909–28.
- Derbyshire EJ. Flexitarian diets and health: a review of the evidence-based literature. Front Nutr. 2017;3:55.
- Baines S, Powers J, Brown WJ. How does the health and well-being of young Australian vegetarian and semi-vegetarian women compare with non-vegetarians? Public Health Nutr. 2007;10:436–42.
- Agrawal S, Millett CJ, Dhillon PK, Subramanian S, Ebrahim S. Type of vegetarian diet, obesity and diabetes in adult Indian population. Nutr J. 2014;13:89.
- Orlich MJ, Singh PN, Sabaté J, Jaceldo-Siegl K, Fan J, Knutsen S, et al. Vegetarian dietary patterns and mortality in adventist health study 2. JAMA Intern Med. 2013;173:1230–8.
- Jacquot L, Berthaud L, Sghaïr A, Diep C, Brand G. The influence of “tastiness” and “healthiness” labels in cheese flavor perception. Chemosens Percept. 2013;6:53–9.
- De Houwer J, Bruycker E. Implicit attitudes towards meat and vegetables in vegetarians and nonvegetarians. Int J Psychol. 2007;42:158–65.
- Fessler DMT, Arguello AP, Mekdara JM, Macias R. Disgust sensitivity and meat consumption: a test of an emotivist account of moral vegetarianism. Appetite. 2003;41:31–41.
- Rozin P, Markwith M, Stoess C. Moralization and becoming a vegetarian: the transformation of preferences into values and the recruitment of disgust. Psychol Sci. 1997;8:67–73.
- MacNair RM. The psychology of becoming a vegetarian. Veg Nutr. 1998;2:96–112.
- Hamilton M. Disgust reactions to meat among ethically and health motivated vegetarians. Ecol Food Nutr. 2006;45:125–58.
- Rouby C, Pouliot S, Bensafi M. Odor hedonics and their modulators. Food Qual Prefer. 2009;20:545–9.
- Small DM, Zatorre RJ, Dagher A, Evans AC, Jones-Gotman M. Changes in brain activity related to eating chocolate: from pleasure to aversion. Brain. 2001;124:1720–33.
- Stafford LD, Whittle A. Obese individuals have higher preference and sensitivity to odor of chocolate. Chem Senses. 2015;40:279–84.
- Melina V, Craig W, Levin S. Position of the academy of nutrition and dietetics: vegetarian diets. J Acad Nutr Diet. 2016;116:1970–80.
- Marrone G, Guerriero C, Palazzetti D, Lido P, Marolla A, Di Daniele F, et al. Vegan diet health benefits in metabolic syndrome. Nutrients. 2021;13:817.
- Berding K, Vlckova K, Marx W, Schellekens H, Stanton C, Clarke G, et al. Diet and the microbiota-gut-brain axis: sowing the seeds of good mental health. Adv Nutr. 2021;12:1239–85.
- Midroit M, Chalençon L, Renier N, Milton A, Thevenet M, Sacquet J, et al. Neural processing of the reward value of pleasant odorants. Curr Biol. 2021;31:1592–605.e9.