
ABSTRACT
Objectives: Type 2 diabetes (T2D) is a metabolic disease of major public health concern. It impacts peripheral tissues and the central nervous system, leading to systemic dysmetabolism and neurocognitive impairments, including memory deficits, anxiety, and depression. The metabolic determinants of these neurocognitive impairments remain unidentified. Here, we sought to address this question by developing a proprietary (P-) high-fat diet (HFD), in which glucose intolerance precedes weight gain and insulin resistance. Methods: The P-HFD model was nutritionally characterized, and tested in vivo in mice that underwent behavioral and metabolic testing. The diet was benchmarked against reference models. . Results: P-HFD has 42% kcal from fat, high monounsaturated/polyunsaturated fatty acid ratio, and 10% (w/v) sucrose in drinking water. When administered, from the early stages of glucose intolerance alone, animals exhibit anxiety-like behavior, without depression nor recognition memory deficits. Long-term P-HFD feeding leads to weight gain, brain glucose hypometabolism as well as impaired recognition memory. Using an established genetic model of T2D (db/db) and of diet-induced obesity (60% kcal from fat) we show that additional insulin resistance and obesity are associated with depressive-like behaviors and recognition memory deficits. Discussion: Our findings demonstrate that glucose intolerance alone can elicit anxiety-like behavior. Through this study, we also provide a novel nutritional model (P-HFD) to characterize the discrete effects of glucose intolerance on cognition, behavior, and the physiology of metabolic disease.
Introduction
Depression and anxiety are comorbidities of type 2 diabetes (T2D) [Citation1, Citation2]. T2D risk is linked to lifestyle factors, glucose intolerance, and insulin resistance. At the stage of insulin resistance, pancreatic beta cells initially increase insulin secretion, before ceasing to signify onset of T2D. Interestingly, cognitive manifestations can arise even at the early stages of glucose intolerance and insulin resistance [Citation3]. Given the evolutive nature of T2D, interactions between specific metabolic states and different neurocognitive domains merit investigation [Citation4].
We recently demonstrated that the db/db model of T2D has severely impaired cognition and anxiety-like behavior [Citation5]. The db/db model lacks a functional leptin receptor, these mice display typical symptoms and key pathological features of T2D in humans (polyphagia, obesity, hyperglycemia, insulin resistance, insulinopenia etc.) [Citation6]. Other studies show that diet-induced obesity (DIO) and insulin resistance result in anxiety-like and depressive behaviors [Citation7, Citation8]. These studies indicate that overnutrition, and its multiple consequences, can result in diverse neurocognitive outcomes. There is thus a need to decipher which consequences of overnutrition impact different neurocognitive domains.
Widely used genetic or nutritional models of metabolic disease (e.g. db/db or DIO) recapitulate multiple components of metabolic syndrome [Citation9, Citation10]. These components being represented concurrently in per model complicates deciphering which impacts behavior and cognition [Citation11]. What remains missing are the discrete contributions of glucose intolerance and suboptimal nutrition. Defining the components of dysmetabolism that determine the psychiatric comorbidities of T2D can help guide targeted interventions at the most appropriate stages.
To address this, we developed an in-house nutritional model that impacts glucose tolerance, independent of insulin resistance, and of short-term weight gain in mice. The model comprises a solid food component with 42% calories from fats rich in saturated and monounsaturated fatty acids, 41% calories from carbohydrates, and 17% calories from protein; a fluid component provides high intake of calories from sugar with 10% (w/v) sucrose-supplemented water. Benchmarking this model against established ones, we investigated effects on cognitive function, anxiety, and depression in mice. We show that glucose intolerance is associated with anxiety-like behaviors, but not depressive-like behaviors or memory deficits. Long-term administration results in weight gain alongside glucose intolerance, impaired recognition memory, and sustained anxiety-like behavior. These phenotypes were associated with dysregulated glucose metabolism in the brain. Thus, our nutritional model reveals that glucose intolerance per se is sufficient to induce anxiety, whereas concurrent weight gain impacts other cognitive domains. These findings indicate that the plethora of neurocognitive outcomes associated with T2D may be driven by specific features of dysmetabolism.
Results
A proprietary high-fat diet rich in simple sugars, saturated fatty acids and monounsaturated fatty acids influences whole-body metabolism
Sugar intake and dietary lipid content and composition, including structural factors like carbon number and saturation, influence the outcomes of high-fat feeding [Citation12]. One of these important outcomes, sensitivity to diet composition and metabolic stress, is anxiety [Citation13]. We developed a proprietary (P-) high-fat diet (HFD), higher in fat content than a normal chow diet (NCD) and provided with 10% (w/v) sucrose-supplemented drinking water, to induce moderate metabolic stress (, Table S1). We began by comparing our P-HFD to a commercial (C-) HFD (D12492i, Research Diets) commonly applied in metabolic disease research for DIO, insulin resistance and anxiety-like behavior [Citation14]. In macronutrient proximate analysis, P-HFD solid food was composed of 17.32% calories from protein, 41.13% calories from carbohydrates and 41.56% calories from fat. For comparison, according to manufacturers, NCD is composed of 17.08% calories from protein, 72.45% calories from carbohydrates and 10.48% calories from fat and a C-HFD is composed of 20% calories from protein, 20% calories from carbohydrates and 60% calories from fat.
Table 1. Dietary composition of diets used in the study. Normal chow diet (NCD); Proprietary high-fat diet (PHFD); Commercial high-fat diet (C-HFD).
We next analyzed fatty acid composition of the P-HFD by gas chromatography, distribution of saturated, monosaturated and polyunsaturated fatty acids (SFA, MUFA, PUFA) was 32.5% SFA, 53.6% MUFA and 13.9% PUFA in P-HFD (Table S1, (B)). Fatty acid composition for the NCD and C-HFD were retrieved from the manufacturer: 16% SFA, 21.9% MUFA and 62.1% PUFA in NCD; and 32.2% SFA, 35.9% MUFA, 31.9% PUFA in C-HFD ((B)). The distinguishing feature of both P-HFD and C-HFD is a higher proportion of SFAs compared to NCD. When comparing the P-HFD to the C-HFD, P-HFD was particularly rich in MUFAs and poor in PUFAs, more detailed analysis of lipid species showed that a variety of fatty acids are differentially abundant across diets. P-HFD contained higher amounts of lauric, pentadecylic, pentadecenoic, margaric, heptadecenic, oleic, linolelaidic, arachidic, eicosenoic, behenic, erucic, and nervonic acids (Table S2). P-HFD contained less amounts of arachidonic acid and of C20:2 and C20:3n6 lipids, compared to C-HFD; and no detectable palmitoleic nor docosapentaenoic acid (Table S1).
Figure 1. MUFA-rich sucrose-supplemented P-HFD influences whole body metabolism. A. Proximate dietary composition of fat, protein, and carbohydrates in NCD, HFD and C-HFD (expressed as percentage of diet). B. Fatty acid composition of SFA, MUFA, and PUFA in NCD, HFD, and C-HFD (expressed as percentage of diet). C. Heatmap and quantification comparing NCD, P-HFD, and C-HFD groups in 24-hour calorimetric analysis for food intake at week 1, week 3, and week 8 of diet. D. Heatmap and quantification comparing NCD, P-HFD, and C-HFD groups in 24-hour calorimetric analysis for water consumption at week 1, week 3, and week 8 of diet. E. Heatmap and quantification comparing NCD, P-HFD, and C-HFD groups in 24-hour calorimetric analysis for average VO2 at week 1, week 3, and week 8 of diet. F. Heatmap and quantification comparing NCD, P-HFD, and C-HFD groups in 24-hour calorimetric analysis for average CO2 at week 1, week 3, and week 8 of diet. G. Heatmap and quantification comparing NCD, P-HFD, and C-HFD groups in 24-hour calorimetric analysis for average RER at week 1, week 3, and week 8 of diet. H. Heatmap and quantification comparing NCD, P-HFD, and C-HFD groups in 24-hour calorimetric analysis for average energy expenditure at week 1, week 3, and week 8 of diet. (n = 3–4/group, *p<0.05, **p<0.001, ****p<0.0001). SFA, saturated fatty acids, MUFA, monounsaturated fatty acids, PUFA, polyunsaturated fatty acids, RER, respiratory exchange ratio. Data are mean ± SEM.
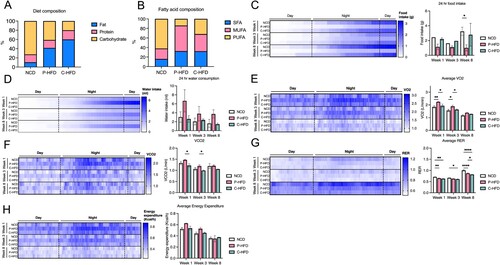
To characterize the effects of these diets in vivo we placed mice on a NCD, P-HFD or C-HFD. We first subjected mice to indirect calorimetry at the beginning of weeks 1, 3, and 8 of feeding to assess food intake, water consumption, gas exchange and energy expenditure. There were no significant differences between NCD, P-HFD, and C-HFD, food intake at 1 and 3 weeks (Two-way ANOVA: no effect of weeks F(2,12) = 1.02, p = 0.3886, effect of diet, F(2,12) = 4.91, p = 0.0276), no interaction F(4,12) = 0.53, p = 0.7714 ((B)). Post-hoc analysis revealed that at week 8, P-HFD mice ate significantly less compared to NCD (p = 0.0348 (C)). Calorimetric analysis revealed no significant differences between NCD, P-HFD, and C-HFD for water intake at 1, 3 and 8 weeks (Two-way ANOVA: no effect of weeks F(2,13) = 0.9965, p = 0.3957, no effect of diet F(2,12) = 2.790, p = 0.0981, no interaction F(4,13) = 0.2125, p = 0.9268, (D)). In terms of oxygen consumption, average VO2 was significantly different between diets (Two-way ANOVA: effect of weeks F(2,14) = 74.32, p<0.0001, effect of diet, F(2,14) = 17.11, p = 0.0002, no interaction F(4,14) = 0.7814, p = 0.557, (E)). In weeks 1 and 3, post-hoc analysis revealed that P-HFD group had higher VO2 compared to NCD (p = 0.0030, p = 0.0107 respectively), and C-HFD (p = 0.0193, p = 0.0382 respectively) ((E)). Average VCO2 was also significantly different between diets (Two-way ANOVA: effect of weeks F(2,14) = 16.83, p = 0.0002, effect of diet, F(2,14) = 10.32, p = 0.0018, no interaction F(4,14) = 0.4960, p = 0.7390, (F)). Post-hoc analysis showed that the P-HFD group had significantly higher VCO2 compared to C-HFD in weeks 1 (p = 0.0149) and 3 (p = .0441) ((F)). The average respiratory exchange ratio (RER) showed significant differences between diets (Two-way ANOVA: effect of weeks F(2,15) = 416.7, p<0.0001, effect of diet, F(2,15) = 54.39, p<0.0001, interaction F(4,15) = 7.216, p = 0.0019, (G)). In week 1, post-hoc analysis revealed that both P-HFD and C-HFD groups had significantly lower average RER, compared to NCD (p = 0.0058, p = 0.0020, respectively, (G)). Similarly, in week 3, post-hoc analysis showed significantly lower average RER in P-HFD and C-HFD groups, compared to NCD (p = 0.00579, p = 0.0188, respectively, (G)). In week 8, post-hoc analysis showed that the average RER was significantly lower in C-HFD compared to P-HFD (p = 0.0150) and NCD (p<0.0001), with P-HFD still lower in average RER compared to NCD (p<0.0001) ((G)). Energy expenditure data showed no significant differences between the groups across timepoints (Two-way ANOVA: effect of weeks F(2,15) = 20.46, p<0.0001, no effect of diet, F(2,15) = 2.497, p = 0.1159, no interaction F(4,15) = 1.030, p = 0.4236, (H)).
Taken together, these data indicate that P-HFD increases metabolism of both fats (VO2) and carbohydrates (VCO2) during early exposure (weeks 1–3), as compared to the NCD and C-HFD. When comparing P-HFD to C-HFD, RER results indicate no difference in predominant energy source between weeks 1 and 3, both of which increase reliance on lipids as compared to NCD.
P-HFD induces early glucose intolerance but not insulin resistance
Several studies showed that intervention times with high-fat feeding lead to weight gain and a variety of metabolic consequences including glucose intolerance and insulin resistance, ranging from 8 days to 27 weeks [Citation15–18]. To determine these kinetics with P-HFD we placed mice on this diet, or a NCD diet. Random glycemia was measured and mice were weighed regularly. Mice were subjected to insulin and glucose tolerance testing (ITT, GTT) at 11–13 weeks, a common timepoint for developing glucose intolerance and insulin resistance on C-HFD, and at 28–32 weeks, an extended time-point for pronounced behavioral effects [Citation19, Citation20] ((A)). Behavioral testing was performed at weeks 13–15, and 28–32 ((A)).
Figure 2. Glucose intolerance precedes weight gain on P-HFD. A. Timeline depicting the duration of P-HFD administration to C56BL6/J mice and metabolic testing (ITT and GTT), and behavioral assessment timepoints. B. Weight analysis across 32 weeks for NCD and P-HFD mice. C. AUC analysis for weight against time for NCD and P-HFD mice. D. End weight analysis at week 32 for NCD and P-HFD mice (NCD, n = 9, P-HFD, n = 24, *p<0.05). E. Non-fasting glycemia measurements for NCD and P-HFD mice for 32 weeks. F. AUC analysis for non-fasting glycemia levels against time in NCD and P-HFD mice. G. End non-fasting glycemia analysis at week 32 for NCD and P-HFD mice (NCD, n = 9, P-HFD, n = 24). H. GTT curve for animals at 11–13 weeks of feeding depicting glycemia levels across 120 min (left), and AUC analysis (right) for glycemia against time in NCD and P-HFD mice (NCD, n = 5, P-HFD, n = 5, p<0.05). I. ITT curve for NCD and P-HFD mice at 11–13 weeks of feeding depicting glycemia levels across 120 min (left), and AUC analysis (right) for glycemia against time in NCD and P-HFD mice (NCD, n = 5, P-HFD, n = 5). J. GTT curve for animals at 28–32 weeks of feeding depicting glycemia levels across 120 min (left), and AUC analysis (right) for glycemia against time in NCD and P-HFD mice (NCD, n = 9, P-HFD, n = 9, p<0.05). K. ITT curve for animals at 28–32 weeks of feeding depicting glycemia levels across 120 min (left), and AUC analysis (right) for glycemia against time in NCD and P-HFD mice (NCD, n = 7, P-HFD, n = 15). L. Weight analysis for tissues collected from NCD and P-HFD at 13 weeks (NCD, n = 5, P-HFD, n = 5, *p<0.05). M. Weight analysis for tissues collected from NCD and P-HFD at 32 weeks (NCD, n = 4, P-HFD, n = 7, *p<0.05). GTT, glucose tolerance test, ITT, insulin tolerance test, SWAT, subcutaneous white adipose tissue, EWAT, epididymal white adipose tissue, BAT, brown adipose tissue. Data are mean ± SEM.
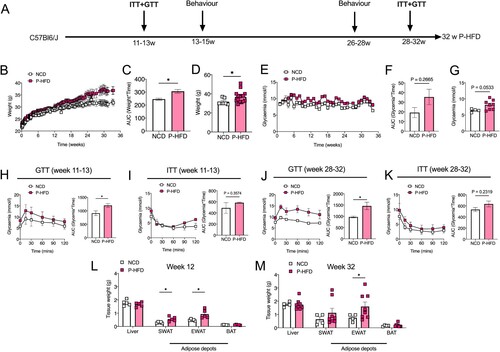
P-HFD caused weight gain, compared to NCD, only after week 13 (Two-way ANOVA: effect of weeks F(95,2566) = 19.93, p<0.0001, effect of diet, F(1,2566) = 211.5, p<0.0001, no interaction F(95,2566) = 0.9252, p = 0.6822, (B)). Area under curve (AUC) was increased across the 32 weeks on P-HFD, compared to NCD mice (p<0.05, (C)), and end-weight at week 32 was ∼14% higher following P-HFD, compared to NCD (p<0.05, (D)). Random glycemia was significantly different between diets across the 32 weeks (Two-way ANOVA: effect of weeks F(32,858) = 3.490, p<0.0001, effect of diet, F(1,858) = 89.67, p<0.0001, no interaction F(32,858) = 0.9401, p = 0.5639, (E)). However, AUC did not show significant differences (p = 0.2665, (F)), and a strong trend was observed with ∼21% increase in end-point random glycemia at week 32 of P-HFD compared to NCD (p = 0.0533, (G)).
At weeks 11-13, GTT showed that mice on P-HFD developed mild glucose intolerance compared to NCD, despite no difference in body weight (Two-way ANOVA: effect of time F(5,48) = 6.977, p<0.0001, effect of diet, F(1,48) = 24.49, p<0.0001, no interaction F(5,48) = 0.4506, p = 0.8108, (H)). AUC was significantly higher in the P-HFD group compared to NCD (p = 0.0377, (H)). Interestingly, P-HFD did not induce significant insulin resistance when ITT was carried out at 13 weeks of diet (Two-way ANOVA: effect of time F(5,48) = 9.981, p<0.0001, effect of diet, F(1,48) = 4.716, p = 0.0348, no interaction F(5,48) = 1.191, p = 0.3276, (I)), with AUC showing no significant differences between P-HFD-fed or NCD-fed mice (p = 0.3574, (I)). Long-term administration (28-32 weeks) of P-HFD exacerbated glucose intolerance, compared to NCD (Two-way ANOVA: effect of time F(5,95) = 3.000, p = 0.0147, effect of diet, F(1,95) = 43.65, p<0.0001, no interaction F(5,95) = 0.6727, p = 0.6451, (J)), with AUC also being higher on P-HFD (p = 0.0111, (J)). At 28–32 weeks of diet, P-HFD mice did not show insulin resistance (Two-way ANOVA: effect of time F(5,120) = 53.83, p<0.0001, effect of diet, F(1,120) = 33.71, p<0.0001, and no interaction F(5,120) = 1.199, p = 0.3137, (K)), with AUC showing no significant differences (p = 0.2319, (K)).
Following early and late timepoints, we collected and weighed major metabolic tissues: liver, subcutaneous white adipose tissue (SWAT), epididymal white adipose tissue (EWAT) and brown adipose tissue (BAT). Of these, SWAT and EWAT weight were increased by 13 weeks of P-HFD (both p<0.05), compared to NCD-fed mice ((L)), and by 32 weeks of diet, EWAT weight remained higher in P-HFD-fed mice compared to NCD (p<0.05, (M)).
P-HFD causes mild loss of metabolic homeostasis compared to C-HFD
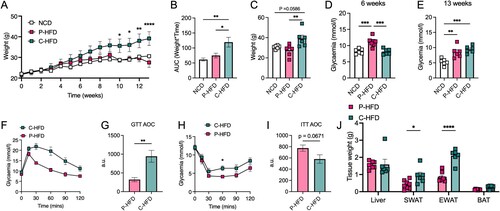
Following nutritional analysis of P-HFD and in vivo testing ( and ), we carried out side-by-side comparison with C-HFD as a validated nutritional model of metabolic disease. We placed mice on P-HFD, C-HFD or NCD for 13 weeks, weighed them regularly and carried out metabolic testing. As previously observed (), body weight on P-HFD was not significantly different when compared to NCD-fed mice at week 13. However, C-HFD significantly increased body weight compared to NCD, the consistent with previous reports [Citation19] (Two-way ANOVA: effect of weeks F(13,219) = 15.35, p<0.0001, effect of diet, F(2,219) = 24.87, p<0.0001, no interaction F(26,219) = 1.505, p = 0.0614, (A)). Post-hoc analysis revealed significant differences between C-HFD and P-HFD starting from week 10 (p = 0.0123), until week 13 (p<0.0001) ((A)). AUC and end-weights confirmed these results, C-HFD mice gained more weight than P-HFD (AUC p = 0.0269, end-weight p = 0.0099) and NCD fed mice (AUC p = 0.0047, end-weight p = 0.0586), with no significant difference between NCD and P-HFD ((B,C)). Interestingly, fasting glycemia at 6 weeks was higher in P-HFD-fed mice compared to C-HFD (p = 0.003) and NCD (p = 0.005) ((D)). However, at 13 weeks, fasting glycemia was similar between mice fed P-HFD or C-HFD (p = 0.5573), with both being significantly higher than NCD feeding (P-HFD vs. NCD, p = 0.0036, C-HFD vs. NCD, p = 0.0005) ((E)). From this cohort, we subjected C-HFD and P-HFD mice to metabolic testing and found glucose intolerance to be less pronounced in P-HFD-fed mice compared to C-HFD (Two-way ANOVA: effect of time F(5,60) = 29.96, p = 0.003, effect of diet F(1,60) = 59.00, p<0.0001, interaction F(5,60) = 3.969, p = 0.0036; (F)), AUC confirmed this finding (p = 0.004; (G)). ITT with a dose adapted to obese animals (0.7U) revealed improved insulin sensitivity upon P-HFD relative to C-HFD (Two-way ANOVA: effect of time F(5,60) = 30.36, p<0.0001, effect of diet F(1,60) = 11.54, p = 0.0012, no interaction F(5,60) = 0.6818, p = 0.639; (H)), and this was represented by a similar trend in AUC (p = 0.067; (I)). Upon analysis of tissue weights, we found that white adipose tissue depots (SWAT, EWAT) were significantly lower in weight in P-HFD-fed mice, relative to C-HFD fed mice (p = 0.032, p>0.0001, respectively; (J)). Taken together these data indicate that although glucose homeostasis is disrupted upon P-HFD; metabolic parameters, weight gain and tissue weights remain less affected than in C-HFD.
Figure 3. P-HFD causes mild metabolic dysfunction compared to C-HFD. A. Weight analysis across 32 weeks for NCD, P-HFD, and C-HFD mice (NCD, n = 6, P-HFD, n = 7, C-HFD = 6, *p<0.05, **p<0.01, ****p<0.0001). B. AUC analysis for weight against time for NCD, P-HFD, and C-HFD mice (NCD, n = 6, P-HFD, n = 6, C-HFD = 6, *p<0.05, **p<0.01). C. End weight analysis at week 32 for NCD, P-HFD, and C-HFD mice (NCD, n = 6, P-HFD, n = 6, C-HFD = 6, **p<0.01). D. Fasting glycemia levels in NCD, P-HFD, and C-HFD mice at 6 weeks of diet (NCD, n = 6, P-HFD, n = 7, C-HFD = 6, ***p<0.001). E. Fasting glycemia levels in NCD, P-HFD, and C-HFD mice at 13 weeks of diet (NCD, n = 6, P-HFD, n = 6, C-HFD = 6, ***p<0.001). F. GTT curve for P-HFD and C-HFD mice at 13 weeks of diet (P-HFD, n = 6, C-HFD = 6) G. AUC analysis for GTT curve for P-HFD and C-HFD mice at 13 weeks of feeding. H. ITT curve for P-HFD and C-HFD mice at 13 weeks of feeding depicting glycemia levels across 120 min (P-HFD, n = 6, C-HFD, n = 6, *p<0.05). I. AUC analysis for ITT curve for P-HFD and C-HFD mice at 13 weeks of feeding (P-HFD, n = 6, C-HFD = 6). J. Weight analysis for tissues collected from NCD and P-HFD at 32 weeks (P-HFD, n = 8, C-HFD, n = 6, *p<0.05, ****p<0.0001). GTT, glucose tolerance test, ITT, insulin tolerance test, SWAT, subcutaneous white adipose tissue, EWAT, epididymal white adipose tissue, BAT, brown adipose tissue. Data are mean ± SEM.
We investigated specific domains of cognition: learning and memory, anxiety and depression. To assess memory, we subjected P-HFD, C-HFD at 13 weeks of diet, and db/db mice to the Novel Object Recognition (NOR) task ((A)). Discrimination index was impaired in C-HFD, and db/db mice compared to controls (One-way ANOVA: effect of groups F(3,33) = 3.717, p = 0.0208, (B)), with post-hoc analysis revealing significant differences between C-HFD and NCD (p = 0.0436), and between db/db and NCD (p = 0.0454, (B)). Interestingly, P-HFD-fed mice did not show any impairment in the NOR task compared to NCD, suggesting that P-HFD does not impair recognition and memory. Moreover, recognition index showed significant differences between NCD and db/db (One-way ANOVA: effect of groups F(3,32) = 4.443, p = 0.0102, post-hoc p = 0.0098; (C)), with post-hoc analysis revealing no differences between NCD and C-HFD (p = 0.1022), nor P-HFD (p = 0.2746) ((C)). This suggests impairments in NOR in db/db and C-HFD-fed mice, but not in P-HFD-fed mice.
Figure 4. Short-term P-HFD induces anxiety-like behavior, without affecting memory or depression. A. Heatmap representative traces of NCD, P-HFD, C-HFD, and db/db mice on the testing phase of the NOR task depicting time spent investigating the novel object (asterisk). B. Discrimination index of NCD, P-HFD, C-HFD, and db/db mice in the testing phase of the NOR task. C. Recognition index of NCD, P-HFD, C-HFD, and db/db mice in the testing phase of the NOR task (*p<0.05, **p<0.01, NCD, n = 12, P-HFD, n = 9, C-HFD, n = 9, db/db, n = 7). C. D. Mobility time of NCD, P-HFD, C-HFD, db/db mice in the FST. E. Immobility time of NCD, P-HFD, C-HFD, and db/db mice in the FST. F. Immobility episodes of NCD, P-HFD, C-HFD, and db/db mice in the FST. (*p<0.05, **p<0.01, ***p<0.001, ****p<0.0001, NCD, n = 15, P-HFD, n = 11, C-HFD, n = 11, db/db, n = 9). G. Representative activity traces of NCD, P-HFD, C-HFD and db/db mice on the OFT. H. Total distance traveled in the OFT for NCD, P-HFD, C-HFD, and db/db mice. I. Time spent in the central zone for NCD, P-HFD, C-HFD, and db/db mice in the OFT. J. Number of entries to the central zone for NCD, P-HFD, C-HFD, and db/db mice in the OFT. K. The distance traveled in the central zone for NCD, P-HFD, C-HFD, and db/db mice in the OFT, expressed as percentage of total distance traveled. (*p<0.05, **p<0.01, ***p<0.001, NCD, n = 14, P-HFD, n = 10, C-HFD, n = 10, db/db, n = 8). Data are mean ± SEM.
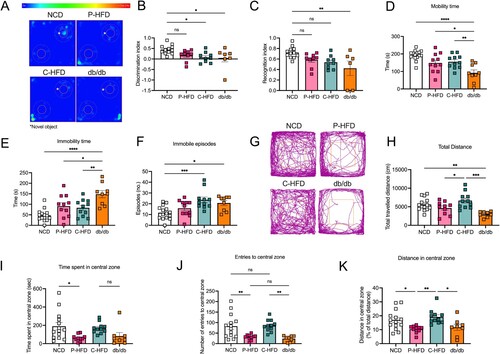
Next, all groups were subjected to the Forced Swim test (FST). Mobility time was significantly different between groups (One-way ANOVA: effect of groups F(3,42) = 10.64, p<0.0001, (D)), with post-hoc analysis revealing that db/db mice were less active than all other groups during testing (NCD p<0.0001, P-HFD p = 0.0235, C-HFD p = 0.0093; (D)). Similarly, immobility time during the FST showed significant differences (One-way ANOVA: effect of groups F(3,42) = 10.52, p<0.0001, (E)), with post-hoc analysis showing that db/db mice were more immobile compared to NCD (p<0.0001), P-HFD (p = 0.0247), and C-HFD mice (p = 0.0081) ((E)). Immobility episodes also showed differences across groups (One-way ANOVA shows effect of groups F(3,42) = 6.467, p = 0.0011, (F)), with post-hoc analysis revealing that C-HFD-fed and db/db mice had significantly more immobility episodes compared to NCD (p = 0.0010, p = 0.0283, respectively) ((F)). These results show that P-HFD-fed mice did not have any impairment in the FST, while db/db mice exhibited overt depressive-like behaviors, and C-HFD displayed moderate depressive-like behaviors.
We then carried out Open Field Tests (OFT) ((G)). Data showed differences in total distance traveled (One-way ANOVA: effect of groups F(3,39) = 7.742, p = 0.0004, (H)), with post-hoc analysis showing that db/db mice traveled significantly less than C-HFD (p = 0.0002), and NCD mice (p = 0.0069) ((H)). Moreover, post-hoc analysis revealed P-HFD-fed mice traveled significantly less than C-HFD-fed mice in the OFT (p = 0.0499) ((H)). To evaluate anxiety-like behavior, we analyzed activity in the central zone of the open field. Only the P-HFD-fed group spent less time in the central zone compared to the NCD group (One-way ANOVA: effect of groups F(3,39) = 3.936, p = 0.0151, (I)), post-hoc analysis revealed that only P-HFD-fed mice differed from NCD-fed mice, having spent less time in the central zone (p = 0.0282). Number of entries to the central zone followed a similar trend, where only P-HFD-fed mice had a lower number of entries compared to NCD-fed mice (One-way ANOVA: effect of groups F(3,39) = 8.436, p = 0.0002; post-hoc p = 0.0068; (J)). Interestingly, the low number of central zone entries by P-HFD-fed mice was at a comparable level to db/db mice that have a much more pronounced metabolic phenotype ((J)). We then analyzed the distance spent in the central zone as a percentage of the total distance and found significant differences among the groups (One-way ANOVA: effect of groups F(3,39) = 5.597, p = 0.0027, (K)), with post-hoc analysis revealing that P-HFD-fed mice traveled significantly less in the central zone compared to NCD (p = 0.0372), and C-HFD (p = 0.0059; (K)). Moreover, db/db mice traveled a comparable distance to P-HFD-fed mice, and significantly less than C-HFD-fed mice (p = 0.0373; (K)). These findings suggest that P-HFD-fed mice exhibit anxiety-like behavior comparable to db/db mice.
Long-term P-HFD feeding is associated with memory impairment and anxiety-like behaviors, but not depressive-like behaviors
The above tests demonstrate that short-term glucose intolerance induced by 11–13 weeks of P-HFD triggered anxiety-like behavior, without influencing memory or depression (). These effects are independent of obesity, insulin resistance and diabetes that are observed in C-HFD-fed and db/db groups. Using a separate naïve cohort, we asked whether long-term (32 weeks) P-HFD-feeding that also causes weight gain, but no significant insulin resistance () would exacerbate behavioral outcomes. Contrary to short-term feeding, long-term P-HFD feeding showed robust impairments of discrimination index in the NOR task (p = 0.0169, (A,B)). The P-HFD group also had significant impairments in the recognition index, compared to the NCD group (p = 0.0138, (C)). To determine whether these memory impairments are spatially related we subjected P-HFD-fed mice to the Morris Water Maze (MWM). During the four days of training in the MWM, P-HFD-fed mice were no different to controls in their latency to find the platform (p = 0.5900, (D)). P-HFD-fed mice, however, took less distance to reach the platform during the four days of training, indicating intact learning ((E)). In the probe trial, no differences were seen between P-HFD and NCD mice (Two-way ANOVA: effect of quadrant F(1,34) = 104.7, p<0.0001, (F)), suggesting no impairment in spatial memory in P-HFD mice.
Figure 5. Long-term P-HFD feeding sustains anxiety-like behaviors and impairs memory. A. Heatmap representative traces of NCD and P-HFD on the testing phase of the NOR task depicting time spent investigating the novel object (asterisk). B. Discrimination index P-HFD and NCD mice in the testing phase of the NOR task. C. Recognition index of NCD and P-HFD mice in the testing phase of the NOR task (*p<0.05, NCD, n = 12, P-HFD, n = 8). D. AUC analysis for latency during the acquisition phase of the MWM task for NCD, and P-HFD mice. E. AUC analysis for distance traveled during the acquisition phase of the MWM task for NCD, and P-HFD mice. F. Percentage time spent in the target vs. the other quadrants in the MWM probe trial for NCD and P-HFD mice (*p<0.05, NCD, n = 7, P-HFD, n = 12). G. Mobility time of NCD and P-HFD mice in the FST. H. Immobility time of NCD and P-HFD mice in the FST. I. Immobility episodes of NCD and P-HFD mice in the FST (NCD, n = 11, P-HFD, n = 16). J. N. Representative activity traces of NCD and mice on the OFT. K. Total distance traveled in the OFT for NCD and P-HFD mice. L. Number of entries to the central zone for NCD and P-HFD mice in the OFT. M. The distance traveled in the central zone for NCD and P-HFD mice in the OFT, expressed as percentage of total distance traveled. N. Time spent in the central zone for NC and P-HFD mice in the OFT (*p<0.05, **p<0.01, NCD, n = 14, P-HFD, n = 11). Data are mean ± SEM.
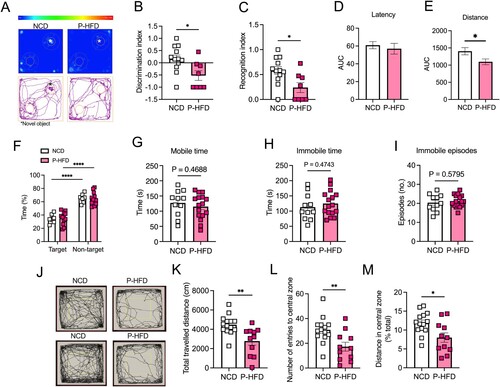
We then assessed whether long-term P-HFD affected depressive-like behavior and found no significant differences between P-HFD and NCD mice in mobility (p = 0.4688, (G)) nor immobility time in the FST (p = 0.4743, (H)). Similarly, there were no differences between P-HFD and NCD in the number of immobility episodes (p = 0.5795, (I)), suggesting no depressive-like behavior.
Next, we tested anxiety-like behaviors using the OFT ((J)). Our data showed that long-term P-HFD-fed mice traveled significantly less in the OFT compared to NCD (p = 0.0032, (K)). Analysis of navigation in the central zone of the OFT revealed that P-HFD had significantly less entries to the central zone (p = 0.0062, (L)), and distance traveled in the central zone as a percentage of total distance (p = 0.0119, (M)). These data suggest that long-term feeding with the P-HFD significantly impairs memory in the NOR task and sustains the anxiety-like behavior seen following short-term feeding, while having no impact on depressive-like behaviors.
P-HFD feeding causes glucose hypometabolism and altered transcriptomic features in the brain
Our data demonstrated that glucose intolerance and weight gain, induced by P-HFD feeding, selectively impaired specific cognitive domains in a temporal manner and induced anxiety-like behaviors. To determine consequences on brain health and metabolism, we used glucose analog 18F-fluorodeoxyglucose (FDG-PET) imaging in 32-week P-HFD fed mice. We administered 18FDG retro-orbitally in NCD and P-HFD mice and performed a whole-body PET/CT scan ((A,B)). We analyzed the biodistribution of radioactivity in the brain, liver, SWAT, EWAT, and BAT ex vivo ((C–G)). PET/CT quantitative analysis revealed that 18FDG uptake in the brains of P-HFD-fed mice was reduced compared to NCD-fed mice (p = 0.0068, (C)). A reduction was also observed in EWAT (p = 0.0080, (D)) and in SWAT (p = 0.0194, (E)) following P-HFD, compared to NCD controls. No significant differences were seen in 18FDG uptake between NCD and P-HFD mice in the liver (p = 0.4011, (F)), nor in BAT (p = 0.1512, (G)).
Figure 6. P-HFD induces glucose hypometabolism in the brain and white adipose tissue and influences the brain transcriptome. Representative PET/CT whole-body scan of A. NCD, B. P-HFD mice. Images are displayed according to the intensity scale for tracer activity, from red (highest), green (intermediate), to purple (lowest). Quantitative ex vivo analysis of 18FDG uptake in C. brain, D. liver, E. SWAT, F. EWAT, and G. BAT of NCD and P-HFD mice. (NCD, n = 6, P-HFD, n = 6) (*p<0.05, **p<0.01). H. Transcriptomic analyses of the forebrain and hindbrain following NCD of P-HFD feeding (forebrain NCD, n = 5, P-HFD, n = 5; hindbrain NCD, n = 4, P-HFD, n = 5). Heatmaps represent differentially expressed genes (p>0,05, +/−1.5-fold change, between diets, per tissue). I. Panther pathway enrichment analysis from forebrain and hindbrain. J. Target gene expression from transcriptomic analysis of genes in glucose metabolism. SWAT, subcutaneous white adipose tissue, EWAT, epididymal white adipose tissue, BAT, brown adipose tissue. Data are mean ± SEM.
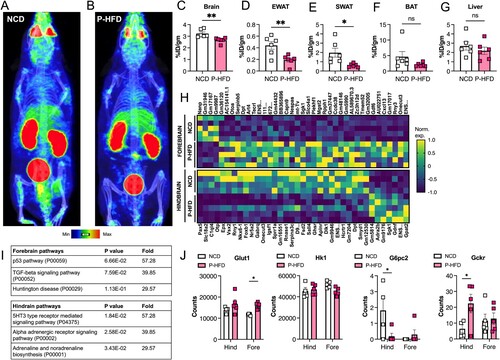
We next carried out transcriptomic analysis of the forebrain and hindbrain to assess the impact of P-HFD feeding on gene expression. Differential expression analysis between diets revealed 39 and 37 differentially expressed genes in the forebrain and in the hindbrain, respectively (p<0,05, log2FC±1.5; (H)). To classify differentially expressed genes we used the PANTHER enrichment tool [Citation21]. There were no significantly enriched pathways in the forebrain, those close to statistical significance (p = 0.067, p = 0.076), with 39–57 fold-enrichment, represented p53 and TGF-beta signaling pathways, potentially indicating stress or immune activation ((H)). In the hindbrain, significantly enriched pathways were mainly related to neuronal and neurotransmitter function (e.g. alpha adrenergic receptor signaling) ((I)). Lastly, we looked at target genes involved in regulating brain glucose metabolism ((J)), functionally contributing to the phenotypic differences seen following PET/CT imaging ((A,B)). We found that the glucose transporter Glut1 was increased in the forebrain following P-HFD feeding, compared to NCD-feeding. Expression of the glucose phosphorylating enzyme Hk1 was not altered, however the expression of G6pc2, downstream of Hk1, was decreased in hindbrains upon P-HFD feeding, and near undetectable in forebrains under both conditions. Interestingly, the expression of Gckr, that encodes the glucokinase regulatory protein, also known as Hk4, was increased in hindbrains. Gckr is known to compete with glucose for phosphorylation, thus inhibiting hexokinase action [Citation22]. While some components of glucose metabolism are dysregulated at the gene expression level, increased expression of Gckr in particular, may explain in part the brain hypometabolism we observed by PET/CT imaging.
Discussion
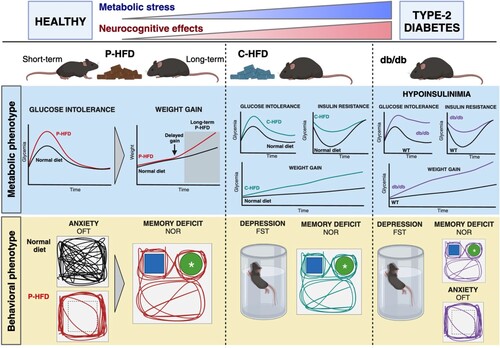
Patients with T2D may suffer neurocognitive impairments like memory loss, anxiety, or depression [Citation1, Citation2]. The metabolic risk factors predisposing to these comorbidities are understudied, in part due to lack of models representing discrete stages of metabolic disease. We developed a nutritional model of mild-to-moderate metabolic stress (P-HFD) where glucose intolerance precedes weight gain, affecting cognitive parameters over time. Comparison to reference models (C-HFD, db/db) allows us to associate components of dysmetabolism to decline in specific neurocognitive domains (). Glucose intolerance under short-term P-HFD feeding causes anxiety-like behaviors. Long-term feeding results in weight gain and memory deficits, associated with reduced brain glucose metabolism. Here, we provide a novel model for understanding the neurocognitive effects of specific components of metabolic dysregulation ().
Figure 7. Dysregulation of specific metabolic components is associated with neurocognitive effects. A proprietary high-fat diet (P-HFD) that induces glucose intolerance is associated with anxiety-like behavior in mice, this is followed by weight gain and onset of memory deficits. On a commercial high-fat diet (C-HFD), glucose intolerance, insulin resistance and obesity induce depressive tendencies and memory deficits. A genetic model of T2D (db/db) results in depression, anxiety, and depressive tendencies. (FST: forced swim test; OFT: Open field test; NOR: novel object recognition; WT wild type). Created with BioRender.com.
Nutritional analysis showed that P-HFD is moderately high in fat content (42% kcal from fat), placing it in between a control diet (10% kcal from fat) and the commonly used C-HFD (60% kcal from fat). This could explain, in part, the delayed weight gain on P-HFD. After analyzing food and water intake in metabolic cages, we noted that food intake was also lower in P-HFD-fed mice, compared to NCD and C-HFD-fed mice. To maintain stable weight, this may have been compensated by increasing fluid intake, since the P-HFD regimen includes 10% (w/v) sucrose in drinking water (Figure S1A-C).
In in vivo tests, P-HFD feeding caused early glucose intolerance without insulin resistance nor weight gain, unlike C-HFD feeding. This striking observation allows us to attribute specific behavioral outcomes to glucose intolerance alone. For comparison C-HFD-fed mice are obese, glucose intolerant, and insulin resistant within the same timeframe, they develop depressive-like behaviors and recognition memory deficits, but no striking anxiety-like behaviors.
Other studies using the C-HFD model, or equivalents, reported similar cognitive and behavioral phenotypes, with inconsistent reports of anxiety. Phenotypes related to anxiety are revealed following longer-term administration (16 weeks) [Citation14] or in older mice (8 months, versus 5–7 weeks in our study) [Citation23], these additional factors may contribute to emergence of anxiety. In the current study, we showed that 13-week C-HFD feeding did not cause overt anxiety, however, total distance traveled was significantly greater than P-HFD-fed and db/db mice in the OFT, suggesting hyperactivity. Such phenotypes have been linked to other neuropsychiatric disorders, such as attention deficit hyperactivity disorder [Citation24]. Other studies show that HFD transiently impacts anxiety-like behaviors [Citation25], suggesting that both age of animals, when HFD feeding commences, and its duration are key factors in triggering anxiety-like behaviors.
Db/db mice, exemplifying most T2D features including hypoinsulinemia [Citation9], showed impaired memory and anxiety behaviors in our and other studies [Citation5, Citation26–28]. They also exhibited depressive tendencies [Citation29]. Here, we confirmed that the db/db model displays anxiety, and depressive-like behaviors, and impaired recognition memory.
Regarding depressive behaviors, we observed these in C-HFD and db/db mice, indicating a link to insulin resistance, which is not present in P-HFD. This is in line with previous findings [Citation30,Citation31,Citation32]. Indeed, insulin resistance associated with inflammation and aberrant activity of the hypothalamic–pituitary–adrenal axis have been linked to depressive behaviors in metabolic disease [Citation32]. Evidence shows that HFD triggers depressive behaviors through astrocyte-mediated activation of hippocampal glutamatergic afferents to the nucleus accumbens. This was alleviated by fluoxetine, a selective serotonin uptake inhibitor [Citation33]. Interestingly, other studies show that fluoxetine also improves obesity and insulin resistance [Citation34]. Studies by the group of Ronald Kahn solidified the role of the neuronal insulin receptor (Insr) in the development of depression, as well as anxiety, in rodents, with age and in DIO. With the use of targeted tissue-specific knockouts, neuronal Insr-deficient mice more readily develop depression, and this was due to mitochondrial dysfunction, and increased dopamine turnover under direct control of insulin signaling [Citation35–37]. Our data support that in the absence of insulin resistance, mice do not exhibit depressive behaviors, at the systemic level and by gene expression in the brain where neither Akt nor Insr expression are altered by P-HFD (Figure S2A). These two genes are key functional components of insulin signaling [Citation38].
Inflammation is a leading mechanism that links insulin resistance and dysmetabolism to depression. We previously reported upregulation of central proinflammatory cytokines in the db/db mice, accompanied with microglial activation [Citation5]. The previously cited studies also report increased central inflammation with depression resulting from Insr deletion [Citation35–37]. This is consistent with us observing depressive behaviors in db/db mice in the current study. Interestingly, with P-HFD feeding, that did not elicit depressive behavior, we also do not observe any significant changes in the expression of pro-inflammatory genes Tnf and Il1b in the brain (Figure S2B).
One important aspect of P-HFD that may impact cognition and behavior as well as the systemic metabolic outcomes is dietary fat composition. The differences in MUFA and PUFA content of C-HFD and P-HFD could explain different metabolic effects observed at different timepoints. Although both diets were high in SFA, the higher content of MUFA in the P-HFD mimics a western dietary pattern: high in SFA, MUFA, yet low in PUFA, in addition to refined sugars. Western diets have been proposed to explain the link between diet and neurocognitive health [Citation39–41]. Indeed, the most consumed SFA in western diets are palmitic acid (C16:0) and stearic acid (C 18:0) [Citation42]. The P-HFD is high in C16:0 (20.79 g per 100g) compared to C18:0 (8.53g per 100g).
Recent evidence suggests that not all high-fat formulations impact metabolic parameters and cognitive function in the same way [Citation14, Citation43, Citation44]. For instance, the effects of high fat, high sugar, and a combination of both impact cognition in different ways [Citation45]. Indeed, the source of fats in models of diet induced-obesity need to be considered [Citation46], specifically. Evidence also shows that HFDs that are composed of specific types of fatty acids modulate the gut-brain axis differently, affecting the expression of insulin in the hippocampus [Citation47]. These studies suggest the need to ascertain the link between specific fatty acids and cognitive dysfunction.
Dietary fats also influence glucose intolerance and metabolic health in mice. The consumption of diets high in SFA and MUFA is linked to impairments in glucose metabolism and adverse metabolic outcomes [Citation48, Citation49]. Arachidonic acid particularly has been found to increase the absorption of glucose in cerebral cortical astrocytes which in turn help regulate cerebral cortex energy metabolism. In the P-HFD, arachidonic acid is absent, and PUFA is low. This could contribute to decreased uptake of glucose in the brain [Citation50, Citation51]. A hyperlipidemic diet administered to rats high in SFA and MUFA similarly reported hyperglycemia and brain dysmetabolism [Citation52].
Investigating glucose metabolism in the brain as a potential mechanism underpinning neurocognitive outcomes of P-HFD, we used 18FDG-PET imaging. 18FDG-PET has been widely adopted for clinical evaluation of neurodegenerative disorders [Citation53]. Indeed, 18FDG-PET imaging in a rodent model of Alzheimer’s Disease (AD) showed brain hypometabolism [Citation54]. Such hypometabolism is proposed as a unifying marker of neurocognitive dysfunction, including in the context of metabolic diseases [Citation55]. We demonstrated that the P-HFD model of glucose intolerance showed robust glucose hypometabolism in key metabolic organs, including the brain. Interestingly, early neurodegeneration is associated with hypermetabolism, whereas advanced neurodegeneration is associated with hypometabolism [Citation56]. Potential mechanisms include transient compensatory reactions in early neurodegeneration that would ultimately lead to neural exhaustion. While these mechanisms were not explored in this study, our previous work does show age-dependent neurodegeneration in the hippocampus of db/db mice [Citation5].
The nutritional model we developed is of value to scientists in the context of metabolic diseases, namely T2D pathophysiology, and to the field of cognitive and behavioral research. In terms of the diet, more in-depth characterization of lipid composition may yield important mechanistic information, since previous studies show that specific lipid species can modulate mood and behavior (e.g. omega 3 fatty acids) [Citation57]. Further effects of the P-HFD model on insulin-producing and insulin-target tissues can also be characterized. Histological and molecular characterization is required to fully discern the effects on important metabolic organs, such as the liver and adipose tissue, as well as in the brain. Such future work will determine to what extent physiological and adaptive changes in these tissues reflect systemic glucose intolerance. The partitioning of metabolic sequelae using multiple nutritional models can elucidate the determinants of neurocognitive decline. Here we demonstrate that glucose intolerance per se is associated with anxiety, concurrent weight gain with memory deficits; and that insulin resistance triggers depressive-like behaviors.
Materials and methods
Animals
C57BL/6J mice (stock number 00664, Jackson Laboratories, Bar Harbor, Maine) aged 5–7 weeks old were fed either a laboratory-formulated 42% high-fat diet (P-HFD), or a commercially sourced 60% high-fat diet (C-HFD, Research diets D12492, New Brunswick, NJ), or a normal chow diet (NCD, ssniff, Germany). Only P-HFD received 10% (w/v) sucrose water. Feeding was ad libitum. Male C57BL/6J-db-/db- mice modeled T2D (B6.BKS(D)-Leprdb/J; stock number 00697), with lean counterparts as controls (stock number 00664; Jackson Laboratories, Bar Harbor, Maine). The animals were offspring of breeding colonies maintained at the Animal Resources Center of Health Sciences at Kuwait University and the Animal Resource Facility at Dasman Diabetes Institute (DDI). Animals were housed in groups of 3–6 per cage without environmental enrichment in a temperature-controlled room (12:12 light to dark cycles, 23°C, 50–60% humidity). All mice were weighed, and glucose levels were measured in the tail vein blood using a glucometer (Accu-Check, Roche) at the beginning of the experiment twice every week until the end. Animals were sacrificed by transcardial perfusion with saline and the following tissues were harvested and weighed: liver, subcutaneous white adipose tissue epididymal white adipose tissue, and brown adipose tissue. All experiments were conducted in accordance with the regulations of Kuwait University (Animal Resources Center), DDI (Animal Resource Facility) and ARRIVE guidelines. Only male mice were used. The protocol for animal studies was reviewed and approved by Animal Ethical Committee of Faculty of Medicine, Health Sciences Center, Kuwait University, Kuwait, 13110 and Animal Ethics Committee of DDI. Experiments were carried out in accordance with recommendations of NIH Guidelines and Guide for the Care and Use of Laboratory animals.
Diet formulation and diet composition analysis
P-HFD was formulated using hazelnut chocolate spread (35% 155.5 g/450 g), 100% casein powder (29% 130.7/450 g), beef tallow (16% 70.1 g/450 g), biscuit rusk (17% 75.9 g/450 g), Stevia rebaudiana derived sweetener (2% 9.1 g/450 g), vitamin and mineral mix (1% 4.9 g/450) and sugar (1% 4.7 g/450 g). The detailed quantities and composition of the ingredients are reported in . All dry components were powdered and mixed using a blender. Wet ingredients were mixed with dry ingredients in a stand mixer until all ingredients were combined and homogenous. The mixture was formed and shaped into pellet form and air dried overnight. The laboratory prepared P-HFD was stored in a freezer. Dietary proximate analyses of the P-HFD sample were performed at Kuwait Institute for Scientific Research (KISR) according to AOAC Official Methods. The crude protein-nitrogen was determined using the Kjeldahl procedure (American Oil Chemists’ Society (AOAC) official method 2001.11 protein (crude) in animal feed, forage, grain). The crude fat was measured using the Soxhlet extractor (AOAC official method 920.39A fat crude in animal feed and pet food), and crude dietary fiber and crude ash were determined using the hot extraction method (AOAC official method 962.09-Fiber crude in animal feed and pet food). Fatty acid methyl esters were quantitively determined using Gas Chromatography with Flame ionization detector (GC/FID) technique (AOCS Ce 1h-05). The Food and Agriculture Organization (FAO) recommendations were used to estimate the carbohydrate content in the P-HFD. The determined fat (F), protein (P), ash (A) and dietary fibers (DF) were used to calculate the amount of carbohydrates [carbohydrates (%) = 100 – (%F + %A + %P + %M + %DF)]. The energy density of the P-HFD was calculated by adding the energy value from proteins, carbohydrates, and fats using the Atwater conversion factor numbers [proteins = 4 kcal/g, carbohydrates = 4 kcal/g, and fats = 9 kcal/g].
Glucose and insulin tolerance tests
For the oral glucose tolerance test (GTT) and insulin tolerance test (ITT), cages were changed, mice were fasted for 6 h, and their weights were measured prior to testing [Citation58]. For both tests, the fasting glucose levels were measured at t = 0 via tail vein blood using a glucometer (Accu-Check, Roche). For GTT, 2 g/kg dosage of glucose solution (20% D-glucose in sterile 0.9% NaCl saline solution) was orally administered using flexible plastic feeding tubes with time lapse of 2–3 min between each animal. For ITT, an intraperitoneal injection of insulin (Actrapid, UK) at a dose of 0.5UI/kg, or 0.75UI/kg (for P-HFD and C-HFD) was administered. For both OGTT and ITT, glucose measurements were measured at 15, 30-, 60-, 90-, and 120-mins post administration.
Metabolic cages
Mice were housed individually in metabolic cages at weeks 1, 3, and 8 of the experiment. The Promethion High-Definition Behavioral Phenotyping System (Sable Systems International) was used to metabolically characterize mice. This system consisted of a two-door configuration for 16 mouse cages. This Promethion Environmental Sensor Assay (ESA) integrated temperature, light, humidity, barometric pressure, and enclosure activity with metabolic and behavioral data. Chambers were linked to an open-circuit flow-through calorimetric device connected to a computer-controlled system of data acquisition. Mice were habituated 24 h before measurement. Oxygen consumption (VO2) and carbon dioxide production were measured every 3 min for 24 h. Measurements were recorded and divided during day 1 (0800 and 1959), night (2000 and 0359), and day 2 (0400 and 0759). During 24 h the respiratory quotient (carbon dioxide production-to-VO2 ratio), the average energy expenditure, food intake and water consumption were measured.
Novel object recognition task
Mice were acclimatized to the experimental room for 1 hr prior to testing. The test was performed in an open field box (WxLxD = 50cm×50cm×50 cm). During the learning phase, mice were placed in presence of two identical objects and were allowed to freely explore the objects for 5 min, after which they returned to their home cages. The box and objects were cleaned with 70% ethanol immediately before and at the end of each testing animal to minimize olfactory cues. Mice were re-introduced to the chamber 1 h later for the recall phase. Mice were left for 5 min in the presence of one of the familiar objects along with a new object with similar size, texture, and shape. A digital camera was placed above the open field and connected to a computer with a video-tracking system (ANY-Maze, Stoelting Co, IL, USA) which objectively measures and records parameters such as time spent exploring the objects. Object exploration was defined as either touching or exploring the object with less than 5 cm proximity. The experimental box and the different objects were systemically cleaned between each test and each mouse. Mice were randomized and mice whose exploration time were less than 20 s during the training sessions are excluded from analysis. The total exploration time was calculated Recognition Index (RI) = time novel (TN)/(TN + time familiar (TF)) and Discrimination Index (DI) = (TN − TF)/(TN + TF) were analyzed.
Open field test
Open field test is used to analyze locomotion and anxiety-like behavior using a sound insulated open field box (WxLxD = 50cmx50cmx50 cm) with a digital camera oriented above the open field and connected to a computer with a video-tracking system (ANY-Maze, Stoelting Co, IL, USA) which objectively measures and records movements. Mice were acclimatized to the experimental room for 1 hr before being introduced into the chamber. Mice were allowed to freely move in the novel environment for 30 min. Their movements in the box during were recorded. The distance traveled, number of entries and time spent in the peripheral and central zone were assessed.
Forced Swim Test
Mice were subjected to the forced swim test to assess depressive-like behaviors. Mice were placed in the testing room to acclimate to the environment for 1 hr before testing. Next, each mouse was placed in a 2 L beaker with 1.8 L of water (25–27°C) for 6 min. A video camera was placed above the beaker and immobility time, immobility episodes and distance swam were recorded and analyzed using ANYMaze software (Stoelting Co., IL). The first minute of activity was not used for the analysis, results were presented as data from 2 to 6 min testing. Water was changed after every 2 mice completed testing.
Morris Water Maze
This task was performed as previously described [Citation5]. Briefly, mice were given two 90s sessions per day for training for four consecutive days, with a 5-minute inter-trial interval. Mice that did not reach the platform during the training sessions were gently guided to the platform. On the fifth day, memory was tested with a probe trial (one 60s session). In the probe trial, the platform was removed, and time spent in each quadrant of the pool was measured and calculated. The experiment was performed in a 95-cm diameter pool filled with 18-20°C water. The platform was submerged one cm below the water surface, and different spatial cues were distributed around the pool. The mice were acclimated to the test room for one hour prior to the experiment for each day of the experiment. Sessions were recorded and data were analyzed using a video tracking software (ANY-Maze, Stoelting Co, IL, USA). Parameters of spatial learning performance, such as latency to reach the hidden platform and time spent in quadrant were recorded and analyzed.
In Vivo PET/CT Imaging and biodistribution analysis
All animal experiments were conducted in accordance with Kuwait University Animal Resources Center approved protocol. Mice fasted for at least 6 h. They were anesthetized with ketamine (100mg/kg) and xylazine (25mg/kg) in 0.9% sodium chloride and received intra-orbital injection of clinical grade 18F-FDG (127 ± 20 µCi; 4.7 ± 0.7 MBq). Mice were kept under anesthesia for 60 min post injection then a whole-body PET scan (NanoScan® SPECT/CT/PET) was obtained using a 1:5 coincidence mode (where each detector module is in coincidence with five opposing ones and is equivalent to maximum field of view of 212 × 212 × 283 mm). Then, a CT scan was acquired (semi-circular full trajectory, maximum field of view, 360 projections, 35 kVp, 170 ms and 1:4 binning) for attenuation correction. For image reconstruction, whole-body Tera-Tomo 3-dimensional reconstruction algorithm and the following settings were used: 4 iterations, 6 subsets, full detector model, low regularization, spike filter on, voxel size 0.4 mm and 400–600 keV energy window. PET data were corrected for randoms, scatter and attenuation. InterViewFusion software (version 3.09.008.0000) provided by Mediso was used to analyze the reconstructed images. Mice were kept under anesthesia for 60 min post injection then were euthanized for biodistribution analysis. Blood was collected by cardiac puncture. Major organs (liver, brain, SWAT, EWAT and BAT) were harvested, weighed, and counted in an automated γ counter (1470 Wizard, PerkinElmer, USA). The percent injected dose per gram (% ID/g) of tissue and the percent injected dose per organ (%ID/organ) were calculated by comparison with standards of known radioactivity.
RNA-seq
RNA was extracted from tissues using Qiagen RNeasy mini kit (Qiagen, Hilden, Germany) and prepared for Illumina sequencing as previously described [Citation59]. Raw RNA-seq data were preprocessed using Trimmomatic (version 0.39) to remove low-quality bases and adapter sequences. Paired-end reads were quality trimmed and filtered. The quality-trimmed reads were aligned to the reference genome using HISAT2 (version 2.1.0). Aligned SAM files were processed using HTSeq (version 0.6.1p1) to quantify reads mapping to gene features.
The count matrix obtained from HTSeq was used to create a DESeq2 dataset. Sample metadata, including experimental conditions and replicates, were incorporated into the analysis. DESeq2 models were fit to the dataset to detect differentially expressed genes between NCD and P-HFD.
Statistical analysis
Data were presented as mean ± SEM. For power analysis, estimation of sample sizes was informed by preliminary experiments, previous literature, and through sample size calculation tools [Citation60–62]. Throughout the entire study, Grubb’s test was used, when appropriate, to determine outliers to eliminate from analysis [Citation63, Citation64]. Normality of the data was assessed using the Shapiro-Wilks test. When comparing two sample means, Student’s t-test was used. A one-way or two-way analysis of variance (ANOVA) with repeated measures (RM) was performed when comparing more than two sample means. When appropriate, a Bonferroni post hoc analysis test was used. GraphPad Prism (v10.0) was used for statistical analysis. P < 0.05 was used as a threshold for statistical significance.
Supplemental Fig 2.jpg
Download JPEG Image (391.2 KB)
Supplemental fig1.jpg
Download JPEG Image (1.1 MB)
Disclosure statement
No potential conflict of interest was reported by the author(s).
Data availability statement
The authors declare that all data associated with the current study are available from the corresponding author upon reasonable request. Gene raw counts and raw fastq files for RNA-seq data generated in this study are available on GEO repository.
Author statement
All authors have read and approved the final version of the manuscript. The authors declare no conflict of interest and contributed to the study as follows; MA-O: conceptualization, investigation, formal analysis, writing original draft, writing review editing, funding acquisition; KB: investigation, formal analysis; SK: formal analysis, writing review editing; DAlt: formal analysis, writing review editing; SD: investigation; DAla: investigation; HA: investigation; MA: investigation; AK: investigation; RN: investigation; MRW: investigation; RA: formal analysis, writing review editing; HA: formal analysis, writing review editing; FA-M: writing review editing, funding acquisition; FAlz: investigation, formal analysis, writing original draft, funding acquisition.
Additional information
Funding
Notes on contributors
Mohammed Al-Onaizi
Mohammed Al-Onaizi is an assistant professor at the Department of Anatomy, Faculty of Medicine, Kuwait University and a Scientist at the Dasman Diabetes Institute. He obtained his PhD from the Department of Anatomy and Cell Biology, at the University of Western Ontario, Canada and was a visiting scientist at the Department of Molecular Medicine, University of Laval, Quebec, Canada.
Kawthar Braysh
Kawthar Braysh is a research associate in the Al-Onaizi laboratory at the Department of Anatomy, College of Medicine, Kuwait University.
Selma S. Alkafeef
Selma Alkefeef is an assistant professor at the Department of Biochemistry, College of Medicine, Kuwait University.
Dana Altarrah
Dana Altarrah is an assistant professor at the Department of Social and Behavioural Science, College of Public Health, Kuwait University.
Shorouk Dannoon
Shorouk Dannoon is an associate professor at Department of Nuclear medicine, College of Medicine, Kuwait University.
Dalal Alasousi
Dalal Alasousi is a fourth-year biochemistry student at College of Science Kuwait University.
Hawraa Adel
Hawraa Adel is an MSc student at the Department of Anatomy, College of Medicine, Kuwait University.
Mariam Al-Ajmi
Mariam Al-Ajmi is a research assistant at the department of biochemistry, College of Medicine, Kuwait University.
Anwar Kandari
Anwar Kandari is a post-doctoral fellow at the Department of Bioenergetics and Neurometabolism at Dasman Diabetes Institute.
Rawan Najem
Rawan Najem is a senior research assistant at the Department of Bioenergetics and Neurometabolism, Dasman Diabetes Institute.
Rasheeba Nizam
Rasheeba Nizam is a senior research associate at the Genetics and Bioinformatics Department, Dasman Diabetes Institute.
Michayla R. Williams
Michayla R Williams is a research technical specialist at the Department of Bioenergetics and Neurometabolism, Dasman Diabetes Institute.
Sumi John
Sumi John is a research associate II at the Genetics and Bioinformatics Department, Dasman Diabetes Institute.
Thangavel Alphonse Thanaraj
Thangavel Alphonse Thanaraj is a principal scientist and head of the Genetics and Bioinformatics Department, Dasman Diabetes Institute.
Rasheed Ahmad
Rasheed Ahmad is a principal scientist and head of the Immunology and Microbiology Department, Dasman Diabetes Institute.
Heba Al-Hussaini
Heba Al-Hussaini is an associate professor at the Department of Anatomy at the College of Medicine at Kuwait University.
Fahd Al-Mulla
Fahd Al-Mulla is Chief Scientific Officer of the Dasman Diabetes Institute.
Fawaz Alzaid
Fawaz Alzaid is a Senior Scientist at the Dasman Diabetes Institute, Kuwait, and an INSERM Researcher at the Institut Necker Enfants Malades, Paris, France. He obtained his PhD from King's College London and was postdoctoral fellow at the Cordeliers Research Centre, Paris, France.
References
- Deschenes SS, McInerney A, Nearchou F, Byrne B, Nouwen A, Schmitz N. Prediabetes and the risk of type 2 diabetes: investigating the roles of depressive and anxiety symptoms in the Lifelines cohort study. Diabet Med. 2023;40(7):e15061. doi:10.1111/dme.15061.
- Hryhorczuk C, Sharma S, Fulton SE. Metabolic disturbances connecting obesity and depression. Front Neurosci. 2013;7:177. doi:10.3389/fnins.2013.00177.
- Willmann C, Brockmann K, Wagner R, Kullmann S, Preissl H, Schnauder G, Heni M. Insulin sensitivity predicts cognitive decline in individuals with prediabetes. BMJ Open Diabetes Res Care. 2020;8(2): doi:10.1136/bmjdrc-2020-001741.
- Wang R, Yan W, Du M, Tao L, Liu J. The effect of physical activity interventions on cognition function in patients with diabetes: a systematic review and meta-analysis. Diabetes Metab Res Rev. 2021;37(7):e3443. doi:10.1002/dmrr.3443.
- Al-Onaizi M, Al-Sarraf A, Braysh K, Kazem F, Al-Hussaini H, Rao M, ElAli A. Impaired spatial navigation and age-dependent hippocampal synaptic dysfunction are associated with chronic inflammatory response in db/db mice. Eur J Neurosci. 2022;56(11):6003–21. doi:10.1111/ejn.15835.
- Guest PC, Rahmoune H. Characterization of the db/db Mouse Model of Type 2 Diabetes. Methods Mol Biol. 2019;1916:195–201. doi:10.1007/978-1-4939-8994-2_18.
- Leffa DD, Valvassori SS, Varela RB, Lopes-Borges J, Daumann F, Longaretti LM, Andrade VM. Effects of palatable cafeteria diet on cognitive and noncognitive behaviors and brain neurotrophins’ levels in mice. Metab Brain Dis. 2015;30(4):1073–82. doi:10.1007/s11011-015-9682-0.
- Ogrodnik M, Zhu Y, Langhi LGP, Tchkonia T, Kruger P, Fielder E, Jurk D. Obesity-induced cellular senescence drives anxiety and impairs neurogenesis. Cell Metab. 2019a;29(5):1233. doi:10.1016/j.cmet.2019.01.013.
- Burke SJ, Batdorf HM, Burk DH, Noland RC, Eder AE, Boulos MS, Collier JJ. db/db Mice exhibit features of human Type 2 Diabetes that are not present in weight-matched C57BL/6J mice fed a Western Diet. J Diabetes Res. 2017;2017:8503754. doi:10.1155/2017/8503754.
- Strissel KJ, Stancheva Z, Miyoshi H, Perfield 2nd JW, DeFuria J, Jick Z, Obin MS. Adipocyte death, adipose tissue remodeling, and obesity complications. Diabetes. 2007;56(12):2910–8. doi:10.2337/db07-0767.
- Diaz de Leon-Guerrero S, Salazar-Leon J, Meza-Sosa KF, Valle-Garcia D, Aguilar-Leon D, Pedraza-Alva G, Perez-Martinez L. An enriched environment re-establishes metabolic homeostasis by reducing obesity-induced inflammation. Dis Model Mech. 2022;15(6): doi:10.1242/dmm.048936.
- DeLany JP, Windhauser MM, Champagne CM, Bray GA. Differential oxidation of individual dietary fatty acids in humans. Am J Clin Nutr. 2000;72(4):905–11. doi:10.1093/ajcn/72.4.905.
- Nakajima S, Fukasawa K, Gotoh M, Murakami-Murofushi K, Kunugi H. Saturated fatty acid is a principal cause of anxiety-like behavior in diet-induced obese rats in relation to serum lysophosphatidyl choline level. Int J Obes (Lond). 2020;44(3):727–38. doi:10.1038/s41366-019-0468-z.
- Ogrodnik M, Zhu Y, Langhi LGP, Tchkonia T, Kruger P, Fielder E, Jurk D. Obesity-induced cellular senescence drives anxiety and impairs neurogenesis. Cell Metab. 2019b;29(5):1061–77e1068. doi:10.1016/j.cmet.2018.12.008.
- Blancas-Velazquez A, Mendoza J, Garcia AN, la Fleur SE. Diet-induced obesity and circadian disruption of feeding behavior. Front Neurosci. 2017;11:23. doi:10.3389/fnins.2017.00023.
- de Moura EDM, Dos Reis SA, da Conceicao LL, Sediyama C, Pereira SS, de Oliveira LL, Milagro FI. Diet-induced obesity in animal models: points to consider and influence on metabolic markers. Diabetol Metab Syndr. 2021;13(1):32), doi:10.1186/s13098-021-00647-2.
- Matias AM, Estevam WM, Coelho PM, Haese D, Kobi J, Lima-Leopoldo AP, Leopoldo AS. Differential effects of high sugar, high lard or a combination of both on nutritional, hormonal and cardiovascular metabolic profiles of rodents. Nutrients. 2018;10(8). doi:10.3390/nu10081071.
- Wu H, Liu Q, Kalavagunta PK, Huang Q, Lv W, An X, Shang J. Normal diet vs high fat diet - a comparative study: behavioral and neuroimmunological changes in adolescent male mice. Metab Brain Dis. 2018;33(1):177–90. doi:10.1007/s11011-017-0140-z.
- Dalmas E, Toubal A, Alzaid F, Blazek K, Eames HL, Lebozec K, Venteclef N. Irf5 deficiency in macrophages promotes beneficial adipose tissue expansion and insulin sensitivity during obesity. Nat Med. 2015;21(6):610–8. doi:10.1038/nm.3829.
- Han J, Nepal P, Odelade A, Freely FD, Belton DM, Graves JL, et al. High-fat diet-induced weight gain, behavioral deficits, and dopamine changes in young C57BL/6J mice. Front Nutr. 2020;7:591161. doi:10.3389/fnut.2020.591161.
- Thomas PD, Campbell MJ, Kejariwal A, Mi H, Karlak B, Daverman R, Narechania A. PANTHER: a library of protein families and subfamilies indexed by function. Genome Res. 2003;13(9):2129–41. doi:10.1101/gr.772403.
- Van Schaftingen E, Detheux M, Veiga da Cunha M. Short-term control of glucokinase activity: role of a regulatory protein. FASEB J. 1994;8(6):414–9. doi:10.1096/fasebj.8.6.8168691.
- Yamada N, Katsuura G, Ochi Y, Ebihara K, Kusakabe T, Hosoda K, Nakao K. Impaired CNS leptin action is implicated in depression associated with obesity. Endocrinology. 2011;152(7):2634–43. doi:10.1210/en.2011-0004.
- Zhuang X, Oosting RS, Jones SR, Gainetdinov RR, Miller GW, Caron MG, Hen R. Hyperactivity and impaired response habituation in hyperdopaminergic mice. Proc Natl Acad Sci U S A. 2001;98(4):1982–7. doi:10.1073/pnas.98.4.1982.
- Gainey SJ, Kwakwa KA, Bray JK, Pillote MM, Tir VL, Towers AE, Freund GG. Short-term high-fat diet (hfd) induced anxiety-like behaviors and cognitive impairment are improved with treatment by glyburide. Front Behav Neurosci. 2016;10:156. doi:10.3389/fnbeh.2016.00156.
- Dinel AL, Andre C, Aubert A, Ferreira G, Laye S, Castanon N. Cognitive and emotional alterations are related to hippocampal inflammation in a mouse model of metabolic syndrome. PLoS One. 2011;6(9):e24325. doi:10.1371/journal.pone.0024325.
- Korolenko TA, Dubrovina NI, Ovsyukova MV, Bgatova NP, Tenditnik MV, Pupyshev AB, Amstislavskaya TG. Treatment with autophagy inducer trehalose alleviates memory and behavioral impairments and neuroinflammatory brain processes in db/db mice. Cells. 2021;10(10): doi:10.3390/cells10102557.
- Stranahan AM, Lee K, Martin B, Maudsley S, Golden E, Cutler RG, Mattson MP. Voluntary exercise and caloric restriction enhance hippocampal dendritic spine density and BDNF levels in diabetic mice. Hippocampus. 2009;19(10):951–61. doi:10.1002/hipo.20577.
- Sharma AN, Elased KM, Garrett TL, Lucot JB. Neurobehavioral deficits in db/db diabetic mice. Physiol Behav. 2010;101(3):381–8. doi:10.1016/j.physbeh.2010.07.002.
- McIntyre RS, Rasgon NL, Kemp DE, Nguyen HT, Law CW, Taylor VH, Goldstein BI. Metabolic syndrome and major depressive disorder: co-occurrence and pathophysiologic overlap. Curr Diab Rep. 2009;9(1):51–9. doi:10.1007/s11892-009-0010-0.
- McIntyre RS, Soczynska JK, Konarski JZ, Woldeyohannes HO, Law CW, Miranda A, Kennedy SH. Should depressive syndromes be reclassified as “Metabolic Syndrome Type II?" Ann Clin Psychiatry. 2007;19(4):257–64. doi:10.1080/10401230701653377.
- Vagena E, Ryu JK, Baeza-Raja B, Walsh NM, Syme C, Day JP, Baillie GS. A high-fat diet promotes depression-like behavior in mice by suppressing hypothalamic PKA signaling. Transl Psychiatry. 2019;9(1):141. doi:10.1038/s41398-019-0470-1.
- Tsai SF, Hsu PL, Chen YW, Hossain MS, Chen PC, Tzeng SF, Kuo YM. High-fat diet induces depression-like phenotype via astrocyte-mediated hyperactivation of ventral hippocampal glutamatergic afferents to the nucleus accumbens. Mol Psychiatry. 2022;27(11):4372–84. doi:10.1038/s41380-022-01787-1.
- Chiu YJ, Tu HH, Kung ML, Wu HJ, Chen YW. Fluoxetine ameliorates high-fat diet-induced metabolic abnormalities partially via reduced adipose triglyceride lipase-mediated adipocyte lipolysis. Biomed Pharmacother. 2021;141:111848. doi:10.1016/j.biopha.2021.111848.
- Bruning JC, Gautam D, Burks DJ, Gillette J, Schubert M, Orban PC, Kahn CR. Role of brain insulin receptor in control of body weight and reproduction. Science. 2000;289(5487):2122–5. doi:10.1126/science.289.5487.2122.
- Fisher SJ, Bruning JC, Lannon S, Kahn CR. Insulin signaling in the central nervous system is critical for the normal sympathoadrenal response to hypoglycemia. Diabetes. 2005;54(5):1447–51. doi:10.2337/diabetes.54.5.1447.
- Kleinridders A, Cai W, Cappellucci L, Ghazarian A, Collins WR, Vienberg SG, Kahn CR. Insulin resistance in brain alters dopamine turnover and causes behavioral disorders. Proc Natl Acad Sci U S A. 2015;112(11):3463–8. doi:10.1073/pnas.1500877112.
- Boucher J, Kleinridders A, Kahn CR. Insulin receptor signaling in normal and insulin-resistant states. Cold Spring Harb Perspect Biol. 2014;6(1):4. doi:10.1101/cshperspect.a009191.
- Jacka FN, Pasco JA, Williams LJ, Meyer BJ, Digger R, Berk M. Dietary intake of fish and PUFA, and clinical depressive and anxiety disorders in women. Br J Nutr. 2013;109(11):2059–66. doi:10.1017/S0007114512004102.
- Melo HM, Santos LE, Ferreira ST. Diet-derived fatty acids, brain inflammation, and mental health. Front Neurosci. 2019;13:265. doi:10.3389/fnins.2019.00265.
- Ravaut G, Legiot A, Bergeron KF, Mounier C. Monounsaturated fatty acids in obesity-related inflammation. Int J Mol Sci. 2020;22(1). doi:10.3390/ijms22010330.
- van Rooijen MA, Mensink RP. Palmitic acid versus stearic acid: effects of interesterification and intakes on cardiometabolic risk markers - a systematic review. Nutrients. 2020;12(3). doi:10.3390/nu12030615.
- Guo Y, Zhu X, Zeng M, Qi L, Tang X, Wang D, Chen D. A diet high in sugar and fat influences neurotransmitter metabolism and then affects brain function by altering the gut microbiota. Transl Psychiatry. 2021;11(1):328. doi:10.1038/s41398-021-01443-2.
- Rodenas-Gonzalez F, Blanco-Gandia MC, Minarro J, Rodriguez-Arias M. Cognitive profile of male mice exposed to a Ketogenic Diet. Physiol Behav. 2022;254:113883. doi:10.1016/j.physbeh.2022.113883.
- Abbott KN, Arnott CK, Westbrook RF, Tran DMD. The effect of high fat, high sugar, and combined high fat-high sugar diets on spatial learning and memory in rodents: a meta-analysis. Neurosci Biobehav Rev. 2019;107:399–421. doi:10.1016/j.neubiorev.2019.08.010.
- Timmers S, de Vogel-van den Bosch J, de Wit N, Schaart G, van Beurden D, Hesselink M, Schrauwen P. Differential effects of saturated versus unsaturated dietary fatty acids on weight gain and myocellular lipid profiles in mice. Nutr Diabetes. 2011;1(7):e11. doi:10.1038/nutd.2011.7.
- Hua Y, Shen J, Fan R, Xiao R, Ma W. High-fat diets containing different types of fatty acids modulate gut-brain axis in obese mice. Nutr Metab (Lond). 2022;19(1):40. doi:10.1186/s12986-022-00675-3.
- Ma T, Liaset B, Hao Q, Petersen RK, Fjære E, Ngo HT, Treebak JT. Sucrose counteracts the anti-inflammatory effect of fish oil in adipose tissue and increases obesity development in mice. PLoS One. 2011;6(6):e21647.
- Lenighan Y, O'Reilly M, Kajani S, Curley S, Bruen R, McGillicuddy F, Roche H. To investigate the effect of ALA and CLA on glucose tolerance and adipose tissue inflammation in the ApoE. 3L. CETP transgenic mouse model. Proc Nutr Soc. 2017;76(OCE3):E71.
- Das UN, Fams. Long-chain polyunsaturated fatty acids in the growth and development of the brain and memory. Nutrition. 2003;19(1):62–5. doi:10.1016/s0899-9007(02)00852-3.
- Yu N, Martin JL, Stella N, Magistretti PJ. Arachidonic acid stimulates glucose uptake in cerebral cortical astrocytes. Proc Natl Acad Sci U S A. 1993;90(9):4042–6. doi:10.1073/pnas.90.9.4042.
- Estadella D, Oyama LM, Bueno AA, Habitante CA, Souza GI, Ribeiro EB, Oller do Nascimento CM. A palatable hyperlipidic diet causes obesity and affects brain glucose metabolism in rats. Lipids Health Dis. 2011;10:168), doi:10.1186/1476-511x-10-168.
- Minoshima S, Cross D, Thientunyakit T, Foster NL, Drzezga A. (18)F-FDG PET imaging in neurodegenerative dementing disorders: insights into subtype classification, emerging disease categories, and mixed dementia with copathologies. J Nucl Med. 2022;63(Suppl 1):2S–12S. doi:10.2967/jnumed.121.263194.
- Bouter C, Henniges P, Franke TN, Irwin C, Sahlmann CO, Sichler ME, Bouter Y. (18)F-FDG-PET detects drastic changes in brain metabolism in the Tg4-42 Model of Alzheimer's Disease. Front Aging Neurosci. 2018;10:425. doi:10.3389/fnagi.2018.00425.
- Iozzo P, Guzzardi MA. Imaging of brain glucose uptake by PET in obesity and cognitive dysfunction: life-course perspective. Endocr Connect. 2019;8(11):R169–R183. doi:10.1530/EC-19-0348.
- Ashraf A, Fan Z, Brooks DJ, Edison P. Cortical hypermetabolism in MCI subjects: a compensatory mechanism? Eur J Nucl Med Mol Imaging. 2015;42(3):447–58. doi:10.1007/s00259-014-2919-z.
- Liao Y, Xie B, Zhang H, He Q, Guo L, Subramanieapillai M, McIntyre RS. Efficacy of omega-3 PUFAs in depression: a meta-analysis. Transl Psychiatry. 2019;9(1):190. doi:10.1038/s41398-019-0515-5.
- Virtue S, Vidal-Puig A. GTTs and ITTs in mice: simple tests, complex answers. Nat Metab. 2021;3(7):883–6. doi:10.1038/s42255-021-00414-7.
- Dashti M, Nizam R, Hebbar P, Jacob S, John SE, Channanath A, Al-Mulla F. Differentially methylated and expressed genes in familial type 1 diabetes. Sci Rep. 2022;12(1):11045. doi:10.1038/s41598-022-15304-5.
- Experimental Design Assistant. (2013). How to define the experimental groups and calculate the sample size needed to obtain reliable results. Available from: https://eda.nc3rs.org.uk/experimental-design-group.
- Kingdom S. (2017). Regression and ANOVA - Sample Size Calculator. Available from: https://www.statskingdom.com/sample_size_regression.html.
- Lasec. (2015). Sample size & power calculator. Available from: http://www.lasec.cuhk.edu.hk/sample-size-calculation.html.
- Barnett V, Lewis T. Outliers in statistical data (Vol. 3). New York: Wiley; 1994.
- Iglewicz B, Hoaglin D. The ASQC basic references in quality control: statistical techniques. How to detect and handle outliers (Vol. 6). Milwaukee: ASQC Quality Press; 1993.