
ABSTRACT
Objective:
Vitamin D is thought to be deficient in patients with bipolar disorder. The purpose of this study is to use latent profile analysis to identify the patterns of vitamin D levels in patients with episodes of bipolar depression, and to examine the relationship among these latent profiles and demographic and clinical characteristics.
Methods:
A total of 149 patients diagnosed with bipolar depression were selected in Guangzhou, China. Depression was evaluated by Zung Self-Rating Depression Scale. Serum 25-hydroxyvitamin D levels tested at baseline and after two weeks of psychiatric treatment were included in the latent profile analysis to identify subgroups. P-trend analysis was used to assess the association between subgroups and depression improvement. Multinomial logistic regression analysis was used to assess the influencing factors of subgroups.
Results:
A three-profiles solution was found to demonstrate the best fit [low-level profile (32.9%), medium-level profile (51.0%), and high-level profile (16.1%)]. There was a significant nonlinear relationship between depression improvement and vitamin D high-level profile, compared to medium-level profile (P for trend <0.05). In multinomial logistic regression analysis, baseline and post-treatment SDS scores, admission season, age, and body mass index significantly affect the profile membership.
Conclusions:
This study found that individuals with high levels of vitamin D showed a significant improvement in depression severity. However, those with low levels of vitamin D remained deficient, indicating a need for targeted vitamin D supplementation. Our findings may provide valuable insights for designing tailored vitamin D supplement interventions to address vitamin D deficiency in bipolar depression.
Introduction
Bipolar disorder is the fourth most disabling conditions among adolescents worldwide and often associated with extremely high disability rates and high health care costs [Citation1]. Depressive episodes in patients with bipolar disorder have become a growing worldwide concern. Conventional treatment for episodes of bipolar disorder includes medication, physical therapy, and psychotherapy. While medication is crucial to maintain a stable status, patients often have recurrent episodes and there is still no effective cure. Augmentation strategies for the improvement of inadequate response to antidepressants have generated a high level of interest in the field, including the use of nutrient-based therapies such as vitamin D supplementation [Citation2].
Vitamin D is a pleiotropic secosteroid with numerous effects in human physiology, where it plays a critical part in bone metabolism, calcium and phosphorus homeostasis, immune response as well as the normal functioning of the brain [Citation3]. The biologically inactive forms of vitamin D2 and D3 are converted into the main circulating form 25(OH)D through 25 hydroxylation in the liver, with a half-life of about 2 weeks [Citation4]. The most active form, 1,25(OH)2D, is converted in the kidney through 1-alpha-hydroxylation, with a half-life of about 4 h. Vitamin D insufficiency can lead to low levels of plasma 25(OH)D, which reduces 1,25(OH)2D synthesis and calcium intake. Given that serum 1,25(OH)2D concentration is closely feed-back regulated and thus does not represent nutritional status, the concentration of plasma 25(OH)D can reflect the vitamin D status in the body [Citation4].
More than a billion people are estimated to have varying levels of vitamin D deficiency, which reached 70.3 percent in a survey of 26,010 adults in the United States [Citation5]. The prevalence of vitamin D deficiency is higher in individuals with psychiatric disorders than in the general population [Citation6]. In a study involving 89 patients diagnosed with schizophrenia, alcohol addiction or major depressive disorder, the patients were found to have significantly lower levels of vitamin D than healthy controls [Citation7]. While the study results are inconsistent, one study found that hypovitaminosis D was found to be considerably worse in patients with mood disorders than in those with alternative psychiatric disorders [Citation8]. Specially, vitamin D deficiency has been linked to a higher chance of depression in patients [Citation9]. Similarly, vitamin D deficiency has been found to occur frequently in patients with bipolar disorder, and vitamin D levels have been associated with clinical symptoms, especially experiencing acute episodes [Citation10]. Thus, more research is needed to focus on the levels of vitamin D during depressive episodes of bipolar disorder.
Although there have been several studies investigating vitamin D in patients with bipolar depression, the trend of vitamin D changes in bipolar patients during hospitalization is unclear. The trend, which indicates the change in vitamin D levels at admission and after psychiatric treatment, may result in an increase, maintenance, or decrease of vitamin D levels. Given that the level of vitamin D is influenced by a variety of factors, understanding the trend in vitamin D during acute episodes of bipolar depression is critical. A person-centered approach, such as latent profile analysis (LPA), may be an option. LPA has been widely used in psychology and humanities research to identify different types of people based on their personal attribute profiles [Citation11]. This approach could aid in gaining a deeper understanding of the patterns of vitamin D changes during hospitalization and develop targeted intervention strategies for vitamin D deficient patients.
Accordingly, this study aimed to: (1) identify homogenous groups of bipolar depression patients based on the latent profile of the trend of vitamin D levels before and after treatment; (2) examine the vitamin D levels, socio-demographic and clinical correlates of these profiles.
Materials and methods
Participants
This study was performed at the Department of Psychiatry of the Third Affiliated Hospital of Sun Yat-sen University. The study population consisted of 149 inpatients who were independently diagnosed with bipolar depression by two senior psychiatrists based on DSM-5 criteria. Each patient had a bipolar disorder spectrum diagnosis and was currently experiencing a depressive episode requiring admittance to the hospital. All participants were gathered in the same time interval between April 2017 and March 2018. Inclusion criteria for all groups were age between 15 and 65 years old and consent to participate in the study. Exclusion criteria for all participants were: known neurological disease, developmental disability, abnormal phospholipid metabolism, nutrient malabsorption, unstable and severe physical illness, bone disease or endocrinological disease associated with vitamin D metabolism, or current prescription for vitamin D supplementation during the 6 months prior to the assessment.
Design and procedure
We performed a prospective, open, naturalistic case–control study with a two-week follow-up to examine the association between disease activity and serum total vitamin D levels in patients with bipolar depression. The sample consisted of two groups: the case and control. Data and serum samples were collected on the second day of hospital admission for acute depressive episodes, and data and serum samples were collected again after two weeks of psychiatric treatment. The study was approved by the local ethics committee in January 2017, and all patients and their families signed the informed consent forms.
Demographic and clinical characteristics
As described below, demographic and clinical characteristics of the participants were evaluated at baseline. The study assessed various demographic and clinical parameters, including age (in years), gender (male or female), smoking status (yes or no), Body Mass Index (BMI), and admission season (Spring/Summer or Autumn/Winter). Considering the diverse impacts of different sampling seasons on vitamin D levels, the admission season was taken into account in this study. Additionally, disease characteristics and treatments were assessed, such as (1) illness duration (in years), (2) total episode number, (3) current depressive episode duration (in days), and (4) treatment including mood stabilizers, antipsychotics, antidepressants, benzodiazepines, and modified electroconvulsive therapy (MECT). Each patient received 1–2 medications tailored to stabilize their emotions based on their individual condition, following the guidelines for bipolar disorder.
Assessment
For assessment of the patient’s subjective view of his/her depressive symptoms, we used the Zung Self-Rating Depression Scale (SDS) [Citation12]. The SDS contains 20 items and is designed based on the diagnostic criteria for depression. The raw sum scores of the SDS range from 20 to 80 but the results are usually presented as the standard scores, which are obtained by converting the raw scores to a 100-point scale. Patients were asked to fill out the SDS questionnaires on baseline day and two weeks later. Serum vitamin D level was also tested at baseline and 2 weeks later. Vitamin D levels were classified as follows: 50.0 nmol/L or lower (deficiency), 50.1 to74.9 nmol/L (insufficiency), and higher than 75.0 nmol/L (sufficiency) [Citation13]. Hypovitaminosis D was defined as vitamin D levels lower than 75.0 nmol/L.
Statistical analysis
Statistical analysis was performed using SPSS Statistics version 20.0 (IBM Corp.) and Mplus version 7.0. The data analysis was divided into three subsections. First, a descriptive analysis of the socio-demographic and clinical characteristics of the study subjects, including mean levels of vitamin D and percent with deficiency, was performed. To identify factors associated with hypovitaminosis D, all study variables were compared between subjects with and without hypovitaminosis D. The chi – square tests for categorical variables and independent t-tests for continuous variables were used to evaluate these associations. Continuous variables were reported as means and standard deviations, while categorical variables were reported as frequencies and proportions. Second, LPA was performed to identify the vitamin D profile of 149 participants after psychiatric inpatient treatment based on the baseline and post-treatment vitamin D. An exploratory approach was used to identify patterns of vitamin D variation that were not uniform across the sample. We explored models that identified one to five profiles and utilized the fit indicators listed below to determine the best number of latent profiles: Akaike information criterion (AIC), Bayesian information criterion (BIC), and adjusted Bayesian information criterion (aBIC) were used to compare models of different profiles, and the smaller the value, the better the model fit; bootstrap likelihood ratio test (BLRT) were used for mutual comparison between k and k-1 profiles models, and p < 0.05 suggested that the k-profiles fit better than the k-1 profile [Citation14]. Third, after identifying the optimal profile, we analyzed and named each group based on its features and compared the differences in socio-demographic and clinical characteristics across the subgroups. Multinomial logistic regression was performed to examine the effect of socio-demographic and clinical variables on the latent profile.
In addition, to validate the correlation between SDS score change and vitamin D latent profile and to explore the possibility of a nonlinear relationship between them, the SDS improvement, which was calculated by subtracting the post-treatment SDS score from the baseline SDS score, was further grouped into quartiles. The P-value for the trend was calculated using the quartiles median value as a quasi-continuous variable in the model. Logistic regression models were used to investigate the association between SDS improvement and latent profiles of vitamin D. Three models were used in this study. The crude model did not adjust for any potential confounders. Model 1 was adjusted for age, gender, BMI, smoking and admission season. Model 2 was further adjusted for the course of the disease, the number of episodes, the duration of the episodes, and psychiatric treatment. The statistical significance level was set at P-value <0.05.
Results
Descriptive characteristics
A total of 149 patients with bipolar depression were enrolled. There were 63 males (42.3%) and 86 females (57.7%). The mean age of the patients was 29.2 ± 14.4 years (range, 15-65) and the mean BMI was 22.9 ± 4.2. The majority of the patients reported no smoking experience (128, 85.9%) and admission in autumn/winter (87, 58.4%). The mean serum vitamin D concentration of the patients was 69.9 nmol/L. In addition, mean disease course was 5.7 ± 6.2 years, mean number of episodes was 2.4 ± 1.8, and mean duration of this episode was 21.3 ± 11.1 years. For SDS scores, the baseline SDS score was 62.6 ± 5.5, which decreased to 43.6 ± 6.1 after 2 weeks of treatment. Based on baseline vitamin D levels, patients were divided into normal vitamin D groups and hypovitaminosis D groups. 93 (62.4%) patients had hypovitaminosis D and 56 (37.6%) patients had normal vitamin D levels. The T-test showed that the normal vitamin D group had significantly higher scores for post-treatment vitamin D (p = 0.007) as compared with the hypovitaminosis D group. Furthermore, there was a high statistically significant difference between the two groups as regards the baseline SDS score (p < 0.001). shows the socio-demographic and clinical characteristics of the case group.
Table 1. The socio-demographic and clinical characteristics of case group
Latent profile analysis (LPA)
LPA was performed with the two domains as input variables (baseline vitamin D level), post-treatment vitamin D level. We tested the model with one to four profiles. Model selection was based on an examination of the most commonly recommended statistical model fitting criteria at the time. The solution with three-latent profiles was chosen as the best model.
The fitting information for the one – to five-profiles solutions were shown in . Based on the fitting information, the three-profile solution was chosen as the most theoretically coherent solution. As the number of latent profile group increased, the information indicators (AIC, BIC, aBIC) gradually decreased. According to the literature, the most significant fitting indices were BIC and BLRT[Citation15]. Compared to the one – and two – profiles solutions, the three-profiles had lower AIC, BIC, aBIC and a significant BLRT p-values, indicating higher accuracy. In the four – and five – profiles solution results, the probability of class size was less than 5%. Due to the practical importance of the measurement, an excess of subgroups could scatter the effective information, so the four – and five – profiles solutions were not chosen. Moreover, since the three-profiles solutions was theoretically interpretable, it was chosen as the optimum solution.
Table 2. Model fitting results for one – to five-class solutions in LCA models.
The names of the latent profiles were determined by comparing the mean values of the grouped variables in each latent profile with the pattern of the probability response to items in each latent profile. The first profile consisted of 32.9% of the sample and was characterized by lower vitamin D levels at baseline than the other profiles and lower than normal levels after treatment. We named it ‘low-level profile’. The second profile, which included 51.0% of the sample, was represented by vitamin D levels that were close to but below normal. After treatment, vitamin D levels could return to normal. We named it ‘medium-level profile. The third profile defined 16.1% of the sample and was characterized by normal vitamin D levels at baseline and after treatment. We named it ‘high-level profile’. The results of the average vitamin D levels from the three latent profiles were shown in . The three profiles showed significant differences in baseline vitamin D and post-treatment vitamin D levels, as well as in the mean change of vitamin D levels after the two-week treatment (P = 0.024), as shown in .
Figure 1. Comparison of the baseline and post-treatment vitamin D mean from the three latent profiles.
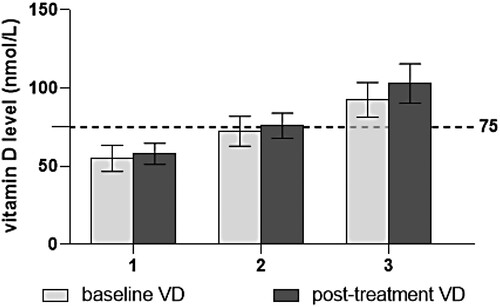
Table 3. Descriptive statistics for vitamin D level subgroup disaggregated by latent profile class.
Associations between SDS improvement and vitamin D latent profiles
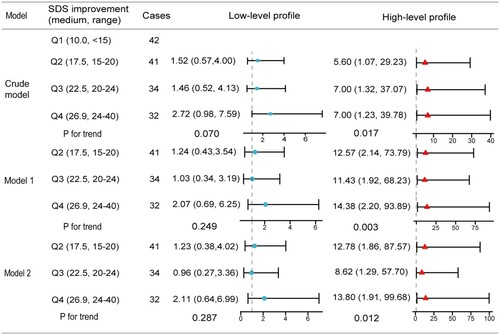
The association between SDS improvement and vitamin D latent profiles was presented in . During the two-week hospitalization, higher SDS improvement was associated with a significant possibility of high-level profile without adjusting covariates in the highest quintile of SDS improvement (OR = 7.00; 95% CI: 1.23, 39.78; P-trend, 0.017) compared with the lowest. When adjusting for age, gender, BMI, smoking and admission season in model 1, the association (OR for highest quintile relative to lowest: 14.38; 95% CI: 2.20, 93.89; P-trend, 0.003) between SDS improvement and high-level profile was strengthened. However, additionally adjusting for disease course, number of episodes, duration of this episode, and psychiatric treatment in model 2 attenuated this association (OR for highest quintile relative to lowest: 13.80; 95% CI: 1.91, 99.68; P-trend, 0.012). On the other hand, the association was weakened in Q3 compared to Q1 and Q4 for both models in 1 and 2. Besides, the SDS improvement did not affect the low-level vitamin D groups.
Figure 2. Logistic regression analysis models showing the associations between SDS improvement and vitamin D latent profiles (medium-level profile as the reference). Crude model: Unadjusted model. Model 1: Adjusted for age, gender, BMI, smoking and admission season. Model 2: Additionally adjusted for disease course, number of episodes, duration of this episode, and psychiatric treatment.
Influencing factors of latent profiles membership
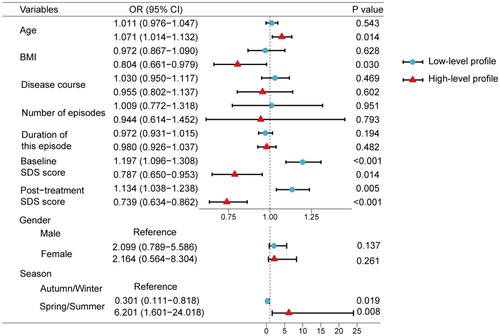
In addition, multinomial logistic regression was used to explore the socio-demographic and clinical variables of profile membership, using the medium-level profile group as a reference group. The results were presented in . Considering that the inclusion of smoking and psychiatric treatment greatly reduced the fitting effect of the model, they were not included in the regression model. In the results, the patients with higher baseline (odds ratio [OR]: 1.197; confidence interval [CI]: 1.096, 1.308) and post-treatment (OR: 1.134; CI: 1.038, 1.238) SDS scores tended to be in the low-level profile than in the medium-level profile. The patients with older age (OR: 1.071; CI: 1.014, 1.132) and lower BMI (OR: 0.804; CI: 0.661, 0.979) were more likely to belong to high-level profile compared to the medium-level profile. Conserve to the low-level profile, the patients with higher baseline (OR: 0.787; CI: 0.650, 0.953) and post-treatment (OR: 0.739; CI: 0.634, 0.862) SDS scores were more unlikely to be in the high-level profile than in the medium-level profile. Compared to medium-level profile, patients who admitted in autumn or winter had a 3.322 times higher risk being classified in low-level profile (OR: 0.301; CI: 0.111, 0.818), and patients who admitted in spring or summer had a 6.201 times higher possibility of being classified in high-level profile (OR: 6.201; CI: 1.601, 24.018).
Figure 3. Odds ratios for the socio-demographic and clinical variables predicting latent profile membership. Abbreviation: OR odds ratio; CI Confidence interval.
Discussion
To the best of our knowledge, this is the first prospective, non-interventional study to assess changes in vitamin D concentration in patients admitted to a psychiatry unit in China with episodes of bipolar depression who were undergoing standard psychiatric treatment. Consistent with extant studies [Citation8], we found a high prevalence of vitamin D insufficiency in patients with bipolar depression that were admitted to psychiatric department, with 62.4% hypovitaminosis D and 8.7% vitamin D deficient. Our results indicate that patients with acute depressive episode have lower serum concentrations of vitamin D compared to patients treated for two weeks. In our study, the mean concentration of serum vitamin D for bipolar depression patients was 69.9 nmol/L, which was higher than that found in other studies [Citation16]. Possible explanations for the differences were seasonality, ethnicity, and dietary habits [Citation13].
Using the LPA, we grouped patients with bipolar depression by their baseline and post-treatment vitamin D levels and identified three distinct profiles: low-level profile, medium-level profile, and high-level profile. In our study, we identified that the patients in high-level profile retained high vitamin D levels at baseline and following the psychiatric therapy, in contrast to earlier work that reported reduced vitamin D levels in BD patients [Citation17]. Patients in this profile had the lowest SDS scores, both at baseline and after treatment, in contrast to the other profiles, suggesting that the severity of symptoms in this patient was related to vitamin D levels. Through the comparison of the three profiles, we also found that those with mild depressive symptoms tended to maintain high vitamin D levels during psychiatric treatment. At the same time, we identified the vitamin D low-level profiles that maintained the lowest vitamin D levels at baseline and after psychiatric treatment. In contrast to the high-level profile, the low-level vitamin D profile had the highest SDS score among the three profiles, further indicating that the severity of symptoms was related to vitamin D levels. Notably, the vitamin D levels in the low-level vitamin D profile did not revert to normal after two weeks of psychiatric treatment. This may be due to the severity of the patient's symptoms, which limit outdoor pursuits and cause a delayed recovery. This suggests that greater attention should be paid to vitamin D supplementation in patients with severe depressive symptoms, particularly those with low vitamin D at the time of admission. In addition, we identified the vitamin D medium-level profile, which accounted for the majority of patients in this study. With a mild degree of depressive symptoms, medium-level profile had a borderline level of vitamin D at admission, but was able to recover to normal levels following psychiatric treatment, suggesting that we can reduce interventions for vitamin D therapy in patients with borderline vitamin D and mild depressive symptoms. The increase in vitamin D levels may be due to the patients’ improved willingness to spend time outdoors in the sunlight and eat more after experiencing the improvement in depressive symptoms. Taken together, it is meaningful to pay attention to both depressive symptoms and vitamin D levels during hospitalization for patients with bipolar depression.
We additionally elucidate the association of SDS improvement with vitamin D variation. Patients with improved SDS were more likely to belong to the vitamin D high-level profile, suggesting that patients with adequate, rather than low, levels of vitamin D were more likely to achieve a significant improvement in the severity of depression. According to the P trend analysis, this tendency becomes apparent as the depression gradually improves. On the other hand, patients with low vitamin D may not significantly improve their vitamin D levels even if their depressive symptoms improve significantly during treatment. As a result, additional vitamin D supplementation should be given to patients with low vitamin D levels, even if their depression has improved. The reverse causality limited the interpretation of the results, as the peculiar relationship between vitamin D and depression was not yet clear.
We also analyzed whether the three profiles showed differential associations with socio-demographic and clinical characteristics. This study covered a wide range of demographic and clinical characteristics of patients with bipolar depression. Current results suggest that seasonality appears to be an important factor in vitamin D levels. Patients admitted in the fall or winter compared to the spring or summer had a 3.32 times higher risk of being included in low-level profile compared to the medium-level profile. Patients admitted in the spring or summer, on the other hand, were 6.20 times more likely to be included in the high-level profile compared to the medium-level profile. Consistent with previous studies suggesting that vitamin D was primarily supplemented through ultraviolet B radiation, this study discovered that different seasons could significantly affect patients’ vitamin D levels, indicating that bipolar depressive patients need tailor interventions according to different seasons [Citation18]. In addition, finding indicated that older patients were more likely to be in high-level profile, which could be related to better exercise coherence in older patients [Citation19]. A possible explanation is that elderly individuals may be more inclined to improve their emotions through outdoor activities, while also benefiting from increased exposure to sunlight to boost their vitamin D levels. Due to regional cultural peculiarities, the sample area for this study was recruited in Guangzhou, a city with a historical heritage and an elderly population in China, where majority of older people have a long tradition of physical activities, while younger people are more hesitant to participate in outdoor activities [Citation20]. Our study also showed that patients with bipolar depression who had a lower BMI were more likely to be included in the vitamin D normal group. This was consistent with previous studies showing that obese patients were more likely to experience vitamin D deficiency because the body fat sequesters the fat-soluble vitamin [Citation13, Citation21]. Excess in body weight and fat tissue functioned as a reservoir, reducing vitamin D bioavailability [Citation21].
However, no significant differences were found among the psychiatric drugs in this study, which may be attributed to the fact that most patients followed comparable diagnostic and treatment regimens. Anticonvulsants, a regularly used mood stabilizer in clinical practice, could enhance the catabolism of 25(OH)D [Citation22]. In addition, studies on drug-induced bone disorder have found that both antidepressants and antiepileptic drugs were mentioned in the cases of osteomalacia and osteoporosis [Citation23]. Munson et al. studied the impact of drugs on second fragility fractures and found that antidepressants, antipsychotics, and non-benzodiazepine hypnotics increased second fracture risk [Citation24]. Considering the relationship between vitamin D and bone formation, additional studies are needed to investigate the association between psychiatric medication and vitamin D deficiency in more depth. Unlike Remco at al. study [Citation25], this study did not find any gender differences in vitamin D levels in bipolar depressive patients. The disparity may be attributed to differences in the inclusion samples across studies.
The current study has several strengths. First, vitamin D is often studied as it relates to the treatment of bipolar disorder, yet this study provides insight into the role of dynamic changes in vitamin D during hospitalization, and the prospective design of the study allow us to understand shifts in vitamin D over time. Second, by including vitamin D levels in one model, we identified three patterns of changes in vitamin D during the treatment of bipolar disorder. In addition, we explore the influence of different patterns, which can help clinicians to intervene in a timely and early manner.
Some limitations of our study should be considered while understanding the findings. First, we recruited a sample of bipolar disorder inpatients in a single site; Hence, our results may not be fully generalizable to other domains. Second, this study only included patients with bipolar depression, making it impossible to apply the findings to other types of bipolar disorder patients. Third, this study was a non-interference study and vitamin D supplementation was not included in this study. However, considering that previous studies had shown that supplementing treatment with vitamin D in bipolar depression patients did not improve reduction in depressive symptoms, adding a vitamin D treatment group will enrich the results of this study and make it more comparable and practical. In addition, considering that vitamin D deficiency may occur in different psychiatric disorders, further research is needed to determine whether the conclusions of this study can be extended to patients diagnosed with other psychiatric disorders [Citation6, Citation26]. In addition, a drawback of the LPA model is the subjectivity involved in determining the number of classes. The three-profiles LPA model was chosen for this study on the basis of its theoretical and statistical validity. Another limitation is that the observation time in our study was only two weeks. Future research should expand on our sample and extend the treatment time to create a more holistic understanding of vitamin D and bipolar disorder through the use of LPA.
Conclusions
The current study fills a gap by exploring the trend of vitamin D changes during psychiatric treatment in hospitalized patients with bipolar depression. Taking a person-centered perspective, we utilized LPA to identify three profiles: low-level profile, medium-level profile, high-level profile. Our study revealed that individuals with high levels of vitamin D showed a significant improvement in depression severity. However, those with low levels of vitamin D remained deficient, indicating a need for targeted vitamin D supplementation. These findings have significant implications for identifying trend of vitamin D changes in patients with bipolar depression, and may provide valuable insights for designing tailored vitamin D supplement interventions to address vitamin D deficiency.
Disclosure statement
No potential conflict of interest was reported by the author(s).
Additional information
Funding
Notes on contributors
Xiabing Zheng
Dr. Xiabing Zheng serves as a dedicated member of the Bipolar Disorder Department at Shenzhen Kangning Hospital. With a profound commitment to advancing the understanding and treatment of bipolar disorder, His researches primarily center around the unique challenges and complexities associated with bipolar disorder, particularly among the adolescent population. His expertise extends to investigating the multifaceted causes, intricate comorbidities, and tailored treatment approaches for individuals grappling with bipolar disorder.
Dhondee Neeraj
Dr. Dhongdee Neeraj is a master's student under the guidance of Dr. Guan Nianhong, specializing in bipolar disorder research.
Qi Zhu
Dr. Qi Zhu, an attending physician at the Third Affiliated Hospital of Sun Yat-sen University, is a graduate student of Dr. Guan Nianhong, contributing significantly to research on the diagnosis and treatment of bipolar disorder.
Yaqi Zhang
Dr. Yaqi Zhang, a doctoral student mentored by Dr. Guan Nianhong, focuses on adolescent bipolar disorder, particularly studying agitation in this population.
Tong Li
Dr. Tong Li, a doctoral student of Dr. Guan Nianhong, is involved in mood disorders research, exploring the therapeutic effects and influencing factors of various psychotropic drugs in clinical settings.
Weirui Yang
Dr. Weirui Yang, a master's student and resident physician at the Third Affiliated Hospital of Sun Yat-sen University, concentrates on non-suicidal self-injury in bipolar disorder and endeavors to address emotional issues in adolescents.
Nianhong Guan
Dr. Nianhong Guan is a distinguished professor at the Third Affiliated Hospital of Sun Yat-sen University and a former director of the Department of Psychiatry. As a dedicated master’s supervisor, she has mentored numerous students. Her researches are primarily centered around the identification and comprehensive understanding of the diagnosis and treatment of mood disorders, with a particular emphasis on bipolar disorder. Her significant contributions to the field are reflected in the publication of numerous scholarly articles on bipolar disorder.
References
- Petrov B, Aldoori A, James C, Yang K, Algorta GP, Lee A, et al. Bipolar disorder in youth is associated with increased levels of vitamin D-binding protein. Transl Psychiatry. 2018;8(1):61.
- van der Burg KP, Cribb L, Firth J, Karmacoska D, Sarris J. Nutrient and genetic biomarkers of nutraceutical treatment response in mood and psychotic disorders: a systematic review. Nutr Neurosci. 2021;24(4):279–295.
- Querfeld U. Vitamin D and inflammation. Ped Nep (Berlin, Germany). 2013;28(4):605–610.
- Chang SW, Lee HC. Vitamin D and health - The missing vitamin in humans. Ped Neo. 2019;60(3):237–244.
- Liu X, Baylin A, Levy PD. Vitamin D deficiency and insufficiency among US adults: prevalence, predictors and clinical implications. Br J Nutr. 2018;119(8):928–936.
- Grønli O, Kvamme JM, Jorde R, Wynn R. Vitamin D deficiency is common in psychogeriatric patients, independent of diagnosis. BMC Psy. 2014;14:134.
- Schneider B, Weber B, Frensch A, Stein J, Fritz J. Vitamin D in schizophrenia, major depression and alcoholism. J Neur Trans (Vienna, Austria: 1996). 2000;107(7):839–842.
- Belzeaux R, Boyer L, Ibrahim EC, Féron F, Leboyer M, Fond G. Mood disorders are associated with a more severe hypovitaminosis D than schizophrenia. Psychiatry Res. 2015;229(1–2):613–616.
- Anglin RE, Samaan Z, Walter SD, McDonald SD. Vitamin D deficiency and depression in adults: systematic review and meta-analysis. Br J Psychiatry. 2013;202:100–107.
- Cereda G, Enrico P, Ciappolino V, Delvecchio G, Brambilla P. The role of vitamin D in bipolar disorder: Epidemiology and influence on disease activity. J Affect Disord. 2021;278:209–217.
- Hensel DJ. Using latent profile analysis and related approaches in adolescent health research. Journal of Adolescent Health. 2020;67(2):153–154.
- Zung WW. A self-rating depression scale. Arch Gen Psychiatry. 1965;12:63–70.
- Holick MF, Binkley NC, Bischoff-Ferrari HA, Gordon CM, Hanley DA, Heaney RP, et al. Evaluation, treatment, and prevention of vitamin D deficiency: an Endocrine Society clinical practice guideline. J Clin Endocrinol Metab. 2011;96(7):1911–1930.
- Tein JY, Coxe S, Cham H. Statistical power to detect the correct number of classes in latent profile analysis. Struct Equat Model: A Multi J. 2013;20(4):640–657.
- Kim SY. Determining the number of latent classes in single- and multi-phase growth mixture models. Struct Equat Model: A Multi J. 2014;21(2):263–279.
- Patel D, Minajagi M. Prevalence of vitamin D deficiency in adult patients admitted to a psychiatric hospital. BJPsych Bull. 2018;42(3):123–126.
- Cuomo A, Maina G, Bolognesi S, Rosso G, Beccarini Crescenzi B, Zanobini F, et al. Prevalence and correlates of vitamin D deficiency in a sample of 290 inpatients with mental illness. Front Psychiatry. 2019;10:167.
- Antonucci R, Locci C, Clemente MG, Chicconi E, Antonucci L. Vitamin D deficiency in childhood: old lessons and current challenges. J Ped Endo Meta. 2018;31(3):247–260.
- Paluska SA, Schwenk TL. Physical activity and mental health: current concepts. Sports Med (Auckland, NZ). 2000;29(3):167–180.
- Ling CW, Zhong H, Zeng FF, Chen G, Fu Y, Wang C, et al. Cohort Profile: Guangzhou Nutrition and Health Study (GNHS): A Population-Based Multi-Omics Study. J Epidemiol. 2023. Advance online publication.
- Wortsman J, Matsuoka LY, Chen TC, Lu Z, Holick MF. Decreased bioavailability of vitamin D in obesity. Am J Clin Nutr. 2000;72(3):690–693.
- Zhou C, Assem M, Tay JC, Watkins PB, Blumberg B, Schuetz EG, Thummel KE. Steroid and xenobiotic receptor and vitamin D receptor crosstalk mediates CYP24 expression and drug-induced osteomalacia. J Clin Invest. 2006;116(6):1703–1712.
- Dardonville Q, Salguiero E, Rousseau V, Chebane L, Faillie JL, Gautier S, et al. Drug-induced osteoporosis/osteomalacia: analysis in the French and Spanish pharmacovigilance databases. Eur J Clin Pharmacol. 2019;75(12):1705–1711.
- Munson JC, Bynum JPW, Bell JE, McDonough C, Wang Q, Tosteson T, Tosteson ANA. Impact of prescription drugs on second fragility fractures among US Medicare patients. Osteoporos Int. 2018;29(12):2771–2779.
- Boerman R, Cohen D, Schulte PF, Nugter A. Prevalence of vitamin D deficiency in adult outpatients With bipolar disorder or schizophrenia. J Clin Psychopharmacol. 2016;36(6):588–592.
- Menkes DB, Lancaster K, Grant M, Marsh RW, Dean P, du Toit SA. Vitamin D status of psychiatric inpatients in New Zealand's Waikato region. BMC Psych. 2012;12:68.