
ABSTRACT
Objectives
Common mental disorders (CMD) are associated with impaired frontal excitatory/inhibitory (E/I) balance and reduced grey matter volume (GMV). Larger GMV (in the areas that are implicated in CMD-pathology) and improved CMD-symptomatology have been observed in individuals who adhere to high quality diets. Moreover, preclinical studies have shown altered neurometabolites (primarily gamma-aminobutyric acid: GABA and glutamate: GLU) in relation to diet quality. However, neurochemical correlates of diet quality and how these neurobiological changes are associated with CMD and with its transdiagnostic factor, rumination, is unknown in humans. Therefore, in this study, we examined the associations between diet quality and frontal cortex neuro-chemistry and structure, as well as CMD and rumination in humans.
Methods
Thirty adults were classified into high and low diet quality groups and underwent 1H-MRS to measure medial prefrontal cortex (mPFC) metabolite concentrations and volumetric imaging to measure GMV.
Results
Low (vs High) diet quality group had reduced mPFC-GABA and elevated mPFC-GLU concentrations, as well as reduced right precentral gyrus (rPCG) GMV. However, CMD and rumination were not associated with diet quality. Notably, we observed a significant negative correlation between rumination and rPCG-GMV and a marginally significant association between rumination and mPFC-GLU concentrations. There was also a marginally significant association between mPFC-GLU concentrations and rPCG-GMV.
Discussion
Adhering to unhealthy dietary patterns may be associated with compromised E/I balance, and this could affect GMV, and subsequently, rumination.
1. Introduction
Common mental disorders (CMD), such as depressive and anxiety disorders, affect around 300 million people globally [Citation1]. The associated social, economic, and health burden of common mental health disorders cost the world economy trillions of dollars each year [Citation2Citation3]. Most importantly, subclinical symptoms associated with CMD such as low mood, worry, and anxiety are even more prevalent across populations, hence, they add even further personal and economic burden on a population scale. Of specific importance, ruminative negative thinking, which could be defined as uncontrolled, excessive and repetitive thinking about one’s current concerns, problems, past experiences or worries about the future [Citation4], has been repeatedly shown to be a transdiagnostic factor in CMD [Citation5Citation6].
It is well known that impaired prefrontal excitatory/inhibitory (E/I) balance (i.e. the imbalance between glutamate [GLU] and gamma-aminobutyric acid [GABA] neurotransmission/metabolism, specifically through downregulation of GABAergic inhibition) is implicated in the aetiology and maintenance of CMD [Citation7–9]. Specifically, altered frontal GABA and GLU concentrations (as measured by Magnetic Resonance Spectroscopy, usually in a pre-defined region of voxel of the brain) have been observed in individuals with anxiety and depression [Citation10, Citation11]. Additionally, neuroanatomical (structural) abnormalities (such as alterations in grey matter volume, cortical thickness, and gyrification) in the frontal and temporal regions have been observed in these individuals relative to control groups [Citation12–4], possibly as a result of excitotoxicity due to E/I imbalance. As expected, same pattern of findings has been observed in relation to ruminative thinking, such that rumination was found to be negatively correlated with grey matter volume (GMV) in frontal areas (inferior frontal gyrus, anterior and mid cingulate, and dorsolateral prefrontal cortices) [Citation15, Citation16]. An essential objective of treatment must be to restore E/I balance and prevent further structural alterations.
Targeting E/I systems via pharmacological and non-pharmacological routes has been shown to improve CMD and CMD-related symptomatology (e.g. meeting remission criteria and/or reporting improvements in depression/anxiety/stress levels) [Citation17–19]. Of specific importance, non-pharmacological dietary routes (due to diet being a leading risk factor for non-communicable diseases), such as adhering to high quality dietary patterns (that are rich in polyphenols, fibre, anti-oxidants, and monounsaturated fats and low in saturated fats and animal proteins) has been shown to improve depression and anxiety outcomes [Citation20–22]. Expectedly, in line with the evidence presented above in relation to neuroanatomical (structural) abnormalities and CMD, in addition to larger brain and grey matter volumes, better diet quality was found to be related to larger hippocampal, frontal, and temporal volumes [Citation23–26]. However, to date, only preclinical studies have shown altered brain metabolites in relation to diet, such that high-fat diet adherence (i.e. diets enriched with lard and/or palm oil) was shown to be associated with decreased GABA and elevated GLU concentrations in the frontal cortex and hippocampus of rats [Citation27–30].
As mentioned above, although preclinical studies began to shed light to mechanisms of action (MOA) associating diet with CMD, these are complex, multifaceted, interacting, and not restricted to any one biological pathway and include (but not limited to) through modulating inflammation, oxidative stress, the HPA axis, and the gut microbiota pathways [Citation31]. Most importantly, the MOAs are largely identified in preclinical studies and need to be fully confirmed and elucidated in human studies. As a first step, in the current preliminary study, our aim was to assess the associations between diet quality and prefrontal cortex (PFC; due to its significance in affective disorders as reported above) GABA and GLU levels (by using proton magnetic resonance spectroscopy, 1H-MRS), GMV, and on CMD and their transdiagnostic factor, rumination in humans. We predicted to observe associations between neurobiological measures and (i) diet quality and (ii) rumination (given the transdiagnostic role of rumination in CMD).
2. Methods
2.1. Participants
One hundred and sixty-four students from Universities of Roehampton and Royal Holloway, as well as members of the public (from London, Egham or surrounding areas in the UK) responded to an online survey (delivered on Qualtrics; https://www.qualtrics.com) that was advertised via posters and online ads and were screened using the Mediterranean Diet Adherence Screener (MEDAS) [Citation32], as this dietary pattern has repeatedly been used as an index of a healthy diet [Citation33]. Thirty-eight participants were selected based on the upper and lower quartiles to establish high MEDAS score (High MEDAS; > 8, n = 19) and low MEDAS score (Low CT; < 6, n = 19) groups.
Exclusion criteria, assessed via a self-report pre-screening survey, included presence of contraindications for magnetic resonance imaging (MRI) scanning (i.e. presence of metal, etc.), current use of prescribed medication for neuropsychiatric disorders, or history of or presence of psychiatric and neurological disorders, current use of illicit substances misuse, BMI lower than 18.5 kg/m2 and at or higher than 30 kg/m2, and having diabetes mellitus, hypertension (systolic blood pressure ≥ 140 mmHg or diastolic blood pressure ≥ 90 mmHg) or cardiovascular diseases (clinical history). Participants in the Low and High-MEDAS groups did not differ for age, gender, education, income, energy, and macro-nutrient intake. Participants received £50 for participation. All participants provided informed consent. The research protocol was approved by the Ethical committee at the University of Roehampton (Reference: PSYC 22/444) on 30/01/2023.
2.2. Demographic, dietary, and clinical assessment
All participants completed a demographics form that assessed variables including, but not limited to, age, sex, level of education, handedness (assessed via Annett Hand Preference Questionnaire [Citation34]), income, alcohol consumption (units per day), tobacco consumption (cigarettes per day) … etc. These measures were used to ensure that High and Low MEDAS groups did not differ for these demographic and environmental/lifestyle factors.
The MEDAS [Citation32], a 14-item questionnaire, was used to estimate adherence to the Mediterranean style diets and it includes 12 questions on food consumption frequency (e.g. ‘How many servings of whole fruit do you eat per day?’) and 2 questions on food intake habit (e.g. ‘Do you use olive oil as the main source of fat for cooking?’). Each question is scored 0 or 1, and higher scores represent higher adherence to the Mediterranean diet, hence higher diet quality. The MEDAS demonstrates good test-retest reliability (r = 0.69) [Citation35] and validity (coefficients ranging from 0.52 to 0.79) [Citation32, Citation35, Citation36] in healthy and unhealthy (e.g. high cardiovascular risk) adult populations in the UK and in other European countries.
Depression and Anxiety Stress Scale (DASS) [Citation37], a 42-item questionnaire, was used to quantify the current (state) levels of depression, anxiety, and /stress that the participants were experiencing over the past week. Each item (e.g. ‘I found it difficult to relax’) is rated on a 4-point Likert scale based on symptom severity/frequency. On the depression subscale, a score of 0–9 indicates no depression, 10–3 mild depression, 14–20 moderate depression, 21–7 severe depression, and 28 + extremely severe depression. On the anxiety subscale, a score of 0–7 indicates no anxiety, 8–9 mild anxiety, 10–4 moderate anxiety, 15–9 severe anxiety, and 20 + extremely severe anxiety. On the stress subscale, a score of 0–14 indicates no stress, 15–8 mild stress, 19–25 moderate stress, 26–33 severe stress, and 34 + extremely severe stress. The DASS demonstrates good test-retest reliability (r = 0.71 = 0.81) [Citation38] and validity (coefficients ranging from 0.84 and 0.91) [Citation37].
Ruminative Response Scale (RRS) [Citation39], a 22-item questionnaire, was used to assess reflection, brooding, and depression-related rumination. Each item (e.g. ‘How often do you Think about how sad you feel?’) is rated on a 5-point Likert scale from 1 (almost never) to 4 (almost always) and higher scores reflect increased levels of ruminative thinking. The RRS demonstrates good test-retest reliability (r = 0.67) and validity (0.90) [Citation39].
Finally, to estimate habitual food intake, EPIC Norfolk Food Frequency Questionnaire (FFQ) was used [Citation40]. Participants needed to report (i) how frequently they consume 130 food items, with options ranging from ‘never or less than once a month’ to ‘6 + per day’ and (ii) other foods they consume. Additionally, the FFQ EPIC Tool for Analysis (FETA) software [Citation41], a tool for converting food frequency questionnaire data into nutrient and food group values, was also utilised in the current study to compare energy and macro-nutrient intakes between High and Low MEDAS groups.
It is important to note that, in the current study, the MEDAS was used to select/screen participants (as reported in Section 2.1), whereas EPIC Norfolk FFQ was used to assess energy and macronutrient intakes.
2.3. MRI acquisition
All MRI scans were acquired on a 3 T Siemens Magnetom TIM Trio scanner using a 32-channel head coil at the Combined Universities Brain Imaging Centre. Structural (neuroanatomical) T1-weighted magnetization-prepared rapid acquisition gradient echo (MPRAGE) whole brain images were acquired with a spatial resolution of 1 mm × 1 mm × 1 mm, in plane resolution of 256 × 256 × 176 continuous slices and scanning time of approximately 5 min.
2.4. 1H-MRS data acquisition and analysis
1H-MRS in vivo spectra of metabolites were acquired from a 20 × 20 × 20 mm voxel located in medial PFC (mPFC) during rest (see for voxel placement and spectral fit as these are considered as gold standards in MRS research as they allow researchers to replicate the study and judge the quality of the spectral fit and to see the peaks of metabolites). The voxel was positioned manually by reference to an axial T1-weighted gradient echo image. Spectra were acquired using SPin ECho full Intensity-Acquired Localized spectroscopy (SPECIAL) [Citation42]. The 1H-MRS sequence was acquired with water suppression (TR 3000 ms, TE 8.5 ms, Phase cycle Auto, 192 averages from the mPFC voxel) in each participant [Citation43]. Water unsuppressed spectra (16 averages) were also acquired. Six outer volume suppression slabs were applied (one on each side at 5 mm from the edge of the cubic voxel) to suppress signals originating from outside the volume of interest and to minimise motion-related image-selected in vivo spectroscopy subtraction artefacts. Spectra were analysed using LCModel 6.3-1L with the basis set consisting of 19 simulated basis spectra: alanine (Ala), ascorbate (Asc), aspartate (Asp), creatine (Cr), gamma aminobutyric acid (GABA), glucose (Glc), glutamine (Gln), glutamate (Glu), glycine (Gly), glutathione (GHS), glycerophosphocholine (GPC), phosphocholine (PCh), lactate (Lac), myo-inositol (mI), N-acetylaspartate (NAA), N-acetylaspartateglutamate (NAAG), phosphorylethanolamine (PE), scyllo-inositol (Scyllo) and taurine (Tau). Additionally, Glx (glutamate + glutamine) levels (as another measure for central glutamatergic neurotransmission) were calculated.
Figure 1. (A) Example of 1H-MRS voxel placement in the mPFC (sagittal, coronal, and axial orientations) (B) 1H-MRS spectrum obtained from the voxel in A (black line) and the overlay of the spectral fit (red line).
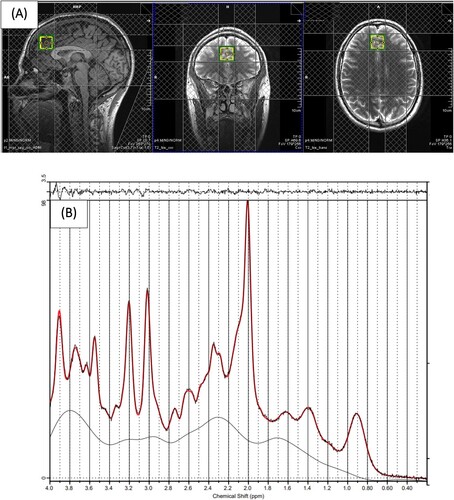
The basis set was simulated using FID-A [Citation44], for TE = 8.5 ms, magnetic field strength = 3 T and assuming ideal RF pulses. Following the standard protocol (as detailed in the LC-Model manual), we excluded spectra with Cramér–Rao lower bounds (CRLB) > 20% (that allowed us to analyse the metabolites with acceptable reliability only). In addition to metabolite levels, line widths and signal-to-noise (SNR) ratios were estimated by LCModel. All spectra had a LineWidth <8 Hz and a mean SNR >40 which are within the accepted ranges [Citation43, Citation45]. These cut-off values are routinely used in 1H-MRS studies as a criterion for estimates of acceptable reliability. Following these quality control checks (which are necessary to be able to reliably estimate the metabolite concentrations), due to data loss, we reported results from 30 (16 High MEDAS and 14 Low MEDAS) and 31 (15 High MEDAS and 16 Low MEDAS) participants for mPFC GABA and mPFC GLU, respectively. Cramér–Rao lower bounds, line widths and signal-to-noise ratios did not differ between groups for mPFC GABA and mPFC GLU analyses (all p > 0.05).
Water referencing and eddy current correction were used to quantify metabolite levels. When quantified in this way, metabolite levels are influenced by cerebral spinal fluid (CSF), grey (GM) and white (WM) matter volumes of the region in which spectra are obtained within the voxel [Citation46], and inter-individual differences in cortical grey matter [Citation47]. In order to account for these confounds, we used the T1-weighted anatomical images to estimate the GM and WM content of the mPFC voxel in which the 1H-MRS measures were performed using GABA Analysis Toolkit (Gannet 2.0, https://github.com/markmikkelsen/Gannet) adapted to work with Siemens SPECIAL data. The segmentation was performed using ‘new segment’ in SPM 8 (http://www.fil.ion.ucl.ac.uk/spm/software/spm8/). CSF, GM volume and WM volume were then accounted for in the expression of GABA and GLU levels using LCModel [Citation48]; corrected metabolite levels will be referred to as GLU ‘Corr’ and GABA ‘Corr’ using the formula GLU ‘Corr’ = (GLU *(43300*GMV + 35880*WMV + 55556*CSF))/(35880* (1-CSF)) and GABA ‘Corr’ = (GABA*(43300*GMV + 35880*WMV + 55556*CSF))/(35880*(1-CSF)). Relaxation corrections were not applied apart from correcting for tissue water relaxation, assuming T2 = 80 ms, by using LCModel parameter ATTH2O = 0.899.
It is important to note that absolute concentrations given by LCModel are normalisations of each resonance to the water peak, resulting in institutional units. Hence, metabolite concentrations do not reflect scores; rather, they are directly related to molecular concentrations and enable comparison between studies.
2.5. Voxel based morphometry (VBM) and region of interest (ROI) analysis
Computational Anatomy Toolbox 12 (CAT12; http://www.neuro.uni-jena.de/cat) implemented in SPM12 (Wellcome Trust Centre for Neuroimaging; www.fil.ion.ac.uk/spm/software/spm12) was used for VBM and ROI analyses. As per standard protocol (see http://www.neuro.uni-jena.de/cat12/CAT12-Manual.pdf), data were skull-stripped using the adaptive probability region-growing approach, normalised to the standard tissue probability map, and segmented into grey matter, white matter, and cerebral spinal fluid. These images were ‘modulated normalised’ images (i.e. voxel values were modulated using the Jacobian determinant), derived from the spatial normalisation so that the absolute volume of grey matter could be compared between groups. This type of modulation requires group analyses to correct for individual differences in brain size; total intracranial volume (TIV) was therefore added as a covariate to all group-level general linear models (GLMs). The images were then registered to the Montreal Neurological Institute (MNI) template using Diffeomorphic Anatomical Registration Through Exponentiated Lie Algebra (DARTEL) registration and smoothed using an 8 mm Gaussian Kernel. Data quality was checked based on the image quality ratings generated by CAT12, which factors in both noise (e.g. motion) and spatial resolution. The visual inspection revealed no issues. Only the images where the quality rating was above the ‘good’ threshold (i.e. B minus = 80) were included in the analyses, hence the reported results for VBM and ROI analyses are from 32 participants (18 High MEDAS and 14 Low MEDAS).
In order to examine whole-brain level GM volume differences between High MEDAS and Low MEDAS groups, two-sample t-tests that control for TIV were used to determine brain regions in which GMV differed between the groups. A threshold of alpha = 0.05 with family-wise error (FWE) correction for multiple comparisons was applied to all contrasts (as VBM measures the GMV at the whole-brain level, at each voxel and cluster).
As CAT12 also enables the estimation of mean tissue volumes for different volume-based atlas maps, we used region-of-interest (ROI) labelling approach that parcellates each brain into several anatomical regions according to Neuromorphometric atlas (an anatomical atlas used to estimate the volume of specific neuroanatomical structures, provided by Neuromorphometrics, Inc. (http://Neuromorphometrics.com)) to estimate the sum of local GM inside the frontocortical areas (see https://neuromorphometrics.com/ParcellationProtocol_2010-04-05.PDF for the list of the areas in the frontal lobe). The BrainNet Viewer [Citation49] was used to visualise the ROIs.
2.6. Statistical analysis
IBM® SPSS Statistics Version 26 was used for data analysis. High and Low MEDAS groups were compared on demographic and clinical measures, as well as SNR, line width and CRLB by using chi-square or independent sample t-tests (two-tailed). Separate univariate ANCOVAs (adjusted for BMI) were used to compare High and Low MEDAS groups on GABA ‘Corr’ and GLU ‘Corr’ metabolite concentrations. Separate univariate ANCOVAs (adjusted for BMI and TIV) were used to compare High and Low MEDAS groups on and grey matter volume (GMV). Relationships between clinical measures, GABA ‘Corr’ and GLU ‘Corr’ metabolite concentrations, and GMVs were analysed using separate bivariate correlations. A threshold of p < 0.05 was applied throughout.
3. Results
3.1. Participant characteristics
Due to the slightly differing group configurations for GABA Corr and GLU Corr concentrations and GMV resulting from quality control checks, results are reported separately. provides a full summary of participant characteristics in Low and High MEDAS groups for the analysis of GABA Corr and GLU Corr metabolite concentrations and GMV. The groups did not differ for sex, age, education, income, energy and macronutrient intakes, handedness, and BMI (apart from GLU Corr analyses) but by design, differed significantly on MEDAS. Groups did not differ on measures of depression, anxiety, and stress, however, for GLU Corr, the low MEDAS group reported higher rumination compared to high MEDAS group (trend-level). Groups did not differ on GM, WM, and CSF tissue volumes.
Table 1. Demographic summary, questionnaire measures and GM, WM, and CSF tissue volumes in the High MEDAS and Low MEDAS groups for GABA Corr, Glu Corr metabolite and GMV analysis.
3.2. GABA Corr and GLU Corr metabolite concentrations
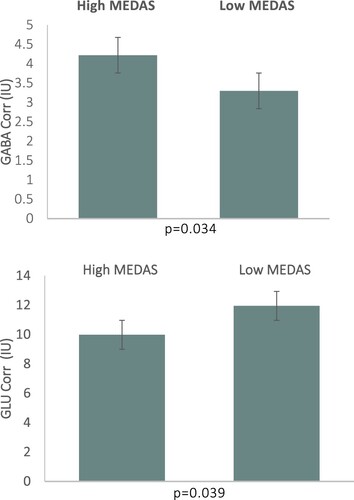
There was a main effect of Group (High vs Low MEDAS) on mPFC GABA Corr levels, F(1,28) = 4.997, p = 0.034, η2 = 0.156; see . Individuals in High MEDAS group (M = 4.22, SD = 1.23 institutional units), exhibited higher mPFC GABA levels compared to individuals in Low MEDAS group (M = 3.30, SD = 0.88 institutional units). There was also a main effect of Group on mPFC GLU Corr levels, F(1,28) = 4.696, p = 0.039, η2 = 0.144; see . Individuals in High MEDAS group (M = 9.98, SD = 2.08 institutional units), exhibited lower mPFC GLU levels compared to individuals in Low MEDAS group (M = 11.95, SD = 2.46 institutional units). The differences between High and Low MEDAS groups for all other metabolite levels (NAA, Cr, mI, Glx = glutamate + glutamine) were non-significant (p > 0.05).
Figure 2. (Upper Panel) mPFC GABA Corr (Lower Panel) mPFC GLU Corr levels by MEDAS groups in institutional units (IU). Bars represent standard errors.
3.3. VBM and ROI analysis
Following whole brain VBM analysis, for both contrasts (Low MEDAS > High MEDAS and High MEDAS > Low MEDAS), no GM volume differences were found. The ROI analysis in the frontal lobe showed that individuals in the High MEDAS group (M = 11.40, SD = 0.82), exhibited greater right precentral gyrus (PCG) GMV, compared to individuals in Low MEDAS group (M = 10.62, SD = 0.83); F(1,28) = 77,374, p = 0.011, η2 = 0.208; see . All other PFC ROIs analyses were non-significant (all p > 0.05).
Figure 3. (Upper Panel) Right Precentral Gyrus, visualised with the BrainNet Viewer [Citation49] (Lower Panel) Right Precentral Gyrus GMV by MEDAS groups.
![Figure 3. (Upper Panel) Right Precentral Gyrus, visualised with the BrainNet Viewer [Citation49] (Lower Panel) Right Precentral Gyrus GMV by MEDAS groups.](/cms/asset/7f35a30a-d4f7-42f0-b3fa-549a134e209a/ynns_a_2355603_f0003_oc.jpg)
3.4. Associations between clinical and imaging measures
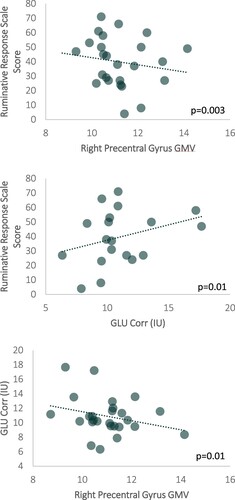
We observed a significant negative correlation between ruminative response scale scores and right PCG GMV, r(25) = −0.5877, p = 0.003; See . Correlations between other clinical measures and right PCG GMV were non-significant (all p > 0.05). Additionally, there was a trend of a positive association between ruminative response scale scores and mPFC GLU Corr concentrations, r(25) = 0.320, p = 0.1; See . Correlations between other clinical measures and other mPFC neurometabolite levels were non-significant (all p > 0.05). Interestingly, we observed a trend of a negative association between mPFC GLU Corr concentrations and right PCG GMV, r(25) = −0.273, p = 0.1; See .
Figure 4. Associations between (Upper Panel) Ruminative Response Scale Score and Right Precentral Gyrus GMV (Middle Panel) Ruminative Response Scale Score and GLU Corr in institutional units (IU) (Lower Panel) Right Precentral Gyrus GMV and GLU Corr (IU).
4. Discussion
To the best of our knowledge, this was the first study that has investigated brain neurochemistry in relation to diet quality (measured with an a priori MEDAS score) in humans. Overall, the results showed altered GABA and GLU concentrations, as well as GMV in the frontal cortex of individuals in the low (vs high) MEDAS group. Unexpectedly, CMD outcomes and their transdiagnostic factor, rumination, were not associated with diet quality. However, a significant association between increased rumination and decreased frontal GMV was observed. Furthermore, we observed trends of associations between increased frontal GLU concentrations and (i) increased rumination and (ii) decreased frontal GMV.
Our observation of reduced frontal GABA and elevated frontal GLU levels in the low (vs high) MEDAS group is consistent with previous experimental work in animals showing the impact of unhealthy (high saturated fat) diets on frontal GABA and GLU concentrations [Citation27–30]. There may be a few explanations for these findings. Firstly, as obesity and high (saturated) fat diets have been shown to alter GLU metabolism and neurotransmission in rats, possibly due to downregulation of the glucose transporter GLUT1 and/or other GLU-degrading enzymes [Citation50, Citation51], unhealthy dietary patterns (higher intakes of products high in fat and sugar), could disturb the metabolism of GLU and subsequently, could alter GABA concentrations in humans. However, it is important to highlight that these results from these preclinical studies may or may not translate into replications in human trials; hence, future research in humans is warranted. Secondly, as consumption of a high-fat high-sugar diet has been shown to reduce the number of parvalbumin interneurons (that contain and release GABA) in the mPFC of rats [Citation52], our findings may reflect a selective loss of parvalbumin-containing interneurons in the mPFC of individuals who adhere to unhealthy diets. Thirdly, unhealthy diets may affect GABA and GLU through their impact on glucose, as in preclinical studies (i) Western diets rich in saturated fat and cholesterol increased average glucose and plasma insulin levels [Citation53] and (ii) high glucose increases GLU release in cerebral synaptosomes and plasma GLU [Citation54] and reduces GABA production [Citation55] and release [Citation56]. Fourthly, high (saturated) fat diets are known to increase lipid and protein oxidation [Citation29], which may alter the membrane cell and damage the organelles and protein structures, altering neurotransmitter release [Citation57]. Lastly, distinct alterations of intestinal microbiome (i.e. reduced abundance of good bacteria such as Bacteroidetes following high (saturated) fat diets) [Citation28] could also explain our findings due to the modulation of GABAergic and glutamatergic receptor activity along the microbiota-gut-brain axis [Citation58, Citation59]. It is crucial to note that, due to GABA’s role in regulating food intake (type, quantity, and quality) and appetite [Citation60], it is also possible that reduced frontal GABA and/or increased frontal GLU concentrations may increase neuronal hyperexcitability, and therefore, affect inhibitory control processes related to food intake and appetite, resulting in making unhealthy food choices/adhering to unhealthy diets. Converging evidence showing frontal hypoactivity in obesity and/or overeating supports this view [Citation61].
In accordance with recent systematic reviews showing a positive correlation with lower diet quality (e.g. lower adherence to the Mediterranean style and/or prudent diets) and reduced brain volume, especially in the frontal areas [Citation25, Citation62, Citation63], our results revealed reduced right PCG volume in individuals who adhere to unhealthy dietary patterns (i.e. lower adherence to the Mediterranean style diets and/or higher adherence to Western style diets). Although the specific mechanism of action of this morphological change is not well understood, results could reflect a loss of neuronal homeostasis [Citation64] and an increase in neuroinflammation [Citation65], and subsequently neuronal dysfunction or death in individuals who follow unhealthy diets(i.e. lower adherence to the Mediterranean style diets and/or higher adherence to Western style diets).. Alternatively, as high levels cholesterol may interfere with the supply of oxygen-rich blood supply to the brain (via the accumulation of plaques), this can then lead to neuronal health deficits such as oxidative stress [Citation66]. On the other hand, supporting evidence shows that adhering to healthy diets such as the Mediterranean, high-polyphenol, and MIND diets; as well as patterns high in antioxidants, anti-inflammatory nutrients, and fibre were generally associated with preserved brain structures [Citation63].
Surprisingly, we did not observe associations between diet quality and CMD outcomes, although diet quality [Citation20, Citation67, Citation68], altered frontal GABA/GLU [Citation10, Citation11] and frontal GMV [Citation12–14] were all associated with CMD. However, we observed a correlation between higher ruminative response scale scores and (i) reduced right PCG GMV and (ii) increased mPFC GLU Corr concentrations (albeit, marginally significant). Although the lack of group (low vs high MEDAS) differences on depression, anxiety, stress, and rumination scores, warrant a replication in a bigger sample, our finding related to morphological changes in relation to rumination extends previous research showing a negative correlation between rumination and grey matter volume in frontal areas (inferior frontal gyrus, anterior and mid cingulate, and dorsolateral prefrontal cortices) [Citation15, Citation16]. As these frontal areas are implicated in cognitive control processes [Citation69, Citation70], previous research results showing benefits of high quality diets on CMD [Citation20, Citation67, Citation68] may be attributable to the impact of diet quality on cognitive symptoms of CMD (in this case, rumination), hence, future nutritional research should consider focusing not only on common, but also dimensional measures of CMD. Additionally, to the best of our knowledge, this was the first study that has shown an association between mPFC GLU and rumination. This finding is in line with previous studies that were conducted in different samples where rumination was a key symptom (e.g. schizophrenia, post-traumatic stress disorder, and even subclinical anxiety) [Citation71–73], therefore, may demonstrate that aberrant glutamatergic function and/or dysfunction in glutamate neurotransmission as a cardinal feature of rumination and disorders where rumination is a transdiagnostic factor. Though further investigation is warranted, decreasing frontal GLU concentrations and/or increasing frontal GABA concentrations via dietary approaches may hold promise as alternative interventions for these disorders, given that adherence to low GLU diets (whole food diets that restrict consumption of free glutamate and aspartate that are mainly found as flavour-enhancing food additives and in some foods including soy sauce, fish sauces, and aged cheeses) and consumption of high dietary GABA (found naturally in tea, tomato, soybean, germinated rice, fermented foods, and could be produced by lactic acid bacteria fermentation) have already been shown to affect brain and behaviour (improved subjective stress and sleep-related outcomes and altered cognitive performance, blood oxygen level dependent (BOLD) response and functional connectivity) [Citation18, Citation74, Citation75].
There are several notable caveats to be aware of in this study. First, our results would benefit from replication in a larger sample, which could be achieved by combining 1H-MRS and morphometric data from multiple centres. Second, given the dimensions and orientation of our 1H-MRS voxel, other frontal lobe structures might have also been included in the voxel, which may have confounded our results. Third, by using conventional 1H-MRS, one cannot simply determine whether differences in neurometabolite levels are associated with neurotransmission or metabolism, to address this issue, future research should utilise more sophisticated MRS protocols [Citation76]. Fourth, as some participants were excluded from the volumetric analysis based on image quality, we cannot exclude the possibility that image quality might have affected the tissue segmentation within the MRS voxel. Fifth, due to the cross-sectional nature of our study, we could not determine cause and effect relationships; therefore, further longitudinal studies are warranted to allow stronger causal inferences to examine the impact of diet quality on brain chemistry and volume. Finally, with respect to GABA measurement, it is crucial to highlight that MEshcher-GArwood Point-RESolved Spectroscopy (MEGA-PRESS) [Citation77] is the most widely used MRS acquisition protocol with reproducible within- and between-session GABA measurement [Citation78, Citation79]. However, SPECIAL was utilised with promising results in the current and previous studies [Citation11, Citation43, Citation80, Citation81]. Moreover, both GABA [Citation82] and other metabolite levels (e.g. glutathione) [Citation83] were found to be comparable between SPECIAL and more conventional spectral editing techniques (despite by using larger voxels), therefore, replication of our results by using other sequences are warranted.
In conclusion, our findings suggest that adhering to unhealthy dietary patterns may be associated with decreased frontal GABA and increased frontal GLU neurotransmission/metabolism, as well as reduced right PCG GMV, possibly through excitotoxicity due to E/I imbalance, and therefore, these neurochemical and morphological alterations could result in the development of CMD. Adherence to healthy dietary patterns, as well as low GLU and/or high GABA diets may establish a new E/I balance, and subsequently, could offer a promising alternative and/or complementary method to improve and prevent CMD and CMD-related symptomatology. Aside from the aforementioned suggestions, future research is needed to (i) replicate our preliminary findings in a bigger sample, ideally while utilising other biomarkers including (but not limited to) glucose, cholesterol, and triglycerides, and (ii) assess, in well-controlled clinical trials, whether higher adherence to healthy and/or low GLU and/or high GABA diets may restore the E/I balance and reverse the impact of excitability on GMV, and, potentially, on CMD.
Disclosure statement
Piril Hepsomali, Adele Costabile, and Paul Allen have received research funding, consultancy, travel support, and speaking honoraria from various industrial companies. MS is employed by FrieslandCampina, Amersfoort, the Netherlands. Other authors declare that they have no conflicts of interest.
Additional information
Funding
Notes on contributors
Piril Hepsomali
Piril Hepsomali is an Assistant Professor in the School of Psychology and Clinical Language Sciences at the University of Reading. Her research focuses on examining the interactions between diet/nutrients and mental, sleep, and cognitive wellbeing, and their biological and neural correlates.
Adele Costabile
Adele Costabile is a Professor in the School of Life and Health Sciences at the University of Roehampton. She works in the field of nutrition, food science and biotechnology.
Marieke Schoemaker
Marieke Schoemaker is Nutrition Credibility Roadmap Manager of Adult Nutrition in the Expert Team Nutrition at Friesland Campina Innovation Centre.
Florencia Imakulata
Florencia Imakulata is a Research Assistant in the School of Psychology at the University of Roehampton.
Paul Allen
Paul Allen is a Professor in Department of Neuroimaging, Kings College London. He conducts research into the cognitive and neural mechanisms of psychiatric disorders.
References
- WHO. Depression and other common mental disorders global health estimates; 2017. https://apps.who.int/iris/bitstream/handle/10665/254610/WHO-MSD-MER-2017.2-eng.pdf.
- Chisholm D, Sweeny K, Sheehan P, Rasmussen B, Smit F, Cuijpers P, Saxena S. Scaling-up treatment of depression and anxiety: a global return on investment analysis. Lancet Psychiatry. 2016;3(5):415–24.
- Freeman M. The World Mental Health Report: transforming mental health for all. World Psychiatry. 2022;21(3):391–2.
- Ehring T, Watkins ER. Repetitive negative thinking as a transdiagnostic process. Int J Cogn Ther. 2008;1(3):192–205.
- McLaughlin KA, Nolen-Hoeksema S. Rumination as a transdiagnostic factor in depression and anxiety. Behav Res Ther. 2011;49(3):186–93.
- Drost J, van der Does W, van Hemert AM, Penninx BW, Spinhoven P. Repetitive negative thinking as a transdiagnostic factor in depression and anxiety: a conceptual replication. Behav Res Ther. 2014;63:177–83.
- Nemeroff CB. The role of GABA in the pathophysiology and treatment of anxiety disorders. Psychopharmacol Bull. 2003;37(4):133–46.
- Sanacora G, Treccani G, Popoli M. Towards a glutamate hypothesis of depression: an emerging frontier of neuropsychopharmacology for mood disorders. Neuropharmacology. 2012;62(1):63–77.
- Page CE, Coutellier L. Prefrontal excitatory/inhibitory balance in stress and emotional disorders: Evidence for over-inhibition. Neurosci Biobehav Rev. 2019;105:39–51.
- Hasler G, van der Veen JW, Tumonis T, Meyers N, Shen J, Drevets WC. Reduced prefrontal glutamate/glutamine and γ-aminobutyric acid levels in major depression determined using proton magnetic resonance spectroscopy. Arch Gen Psychiatry. 2007;64(2):193–200.
- Morgenroth E, Orlov N, Lythgoe DJ, Stone JM, Barker H, Munro J, et al. Altered relationship between prefrontal glutamate and activation during cognitive control in people with high trait anxiety. Cortex. 2019;117:53–63.
- Maletic V, Robinson M, Oakes T, Iyengar S, Ball SG, Russell J. Neurobiology of depression: an integrated view of key findings. Int J Clin Pract. 2007;61(12):2030–40.
- Martin EI, Ressler KJ, Binder E, Nemeroff CB. The neurobiology of anxiety disorders: brain imaging, genetics, and psychoneuroendocrinology. Psychiat Clin North Am. 2009;32(3):549–75.
- Besteher B, Gaser C, Nenadić I. Brain structure and subclinical symptoms: a dimensional perspective of psychopathology in the depression and anxiety spectrum. Neuropsychobiology. 2020;79(4):270–83.
- Kühn S, Vanderhasselt MA, De Raedt R, Gallinat J. Why ruminators won't stop: the structural and resting state correlates of rumination and its relation to depression. J Affect Disord. 2012;141(2-3):352–60.
- Sin ELL, Shao R, Geng X, Cho V, Lee TMC. The neuroanatomical basis of two subcomponents of rumination: a VBM study [original research]. Front Hum Neurosci. 2018;12:324. doi:10.3389/fnhum.2018.00324.
- Mathews DC, Henter ID, Zarate CA. Targeting the glutamatergic system to treat major depressive disorder: rationale and progress to date. Drugs. 2012;72(10):1313–33.
- Hepsomali P, Groeger JA, Nishihira J, Scholey A. Effects of oral gamma-aminobutyric acid (GABA) administration on stress and sleep in humans: a systematic review [systematic review]. Front Neurosci. 2020;14(923):923. English.
- Kraal AZ, Arvanitis NR, Jaeger AP, Ellingrod VL. Could dietary glutamate play a role in psychiatric distress? Neuropsychobiology. 2020;79(1-2):13–9.
- Melanson KJ. Nutrition review: relationships of nutrition with depression and anxiety. Am J Lifestyle Med. 2007;1(3):171–4.
- Sarris J, Logan AC, Akbaraly TN, Amminger GP, Balanzá-Martínez V, Freeman MP, et al. Nutritional medicine as mainstream in psychiatry. Lancet Psychiatry. 2015;2(3):271–4.
- Sarris J. Nutritional psychiatry: from concept to the clinic. Drugs. 2019;79(9):929–34.
- Gu Y, Brickman AM, Stern Y, Habeck CG, Razlighi QR, Luchsinger JA, et al. Mediterranean diet and brain structure in a multiethnic elderly cohort. Neurology. 2015;85(20):1744–51.
- Croll PH, Voortman T, Ikram MA, Franco OH, Schoufour JD, Bos D, Vernooij MW. Better diet quality relates to larger brain tissue volumes: the Rotterdam Study. Neurology. 2018;90(24):e2166–e2173.
- Jensen DEA, Leoni V, Klein-Flügge MC, Ebmeier KP, Suri S. Associations of dietary markers with brain volume and connectivity: a systematic review of MRI studies. Ageing Res Rev. 2021;70:101360.
- Macpherson H, McNaughton SA, Lamb KE, Milte CM. Associations of diet quality with midlife brain volume: findings from the UK Biobank Cohort Study. J Alzheimer's Dis. 2021;84(1):79–90.
- Sandoval-Salazar C, Ramírez-Emiliano J, Trejo-Bahena A, Oviedo-Solís CI, Solís-Ortiz MS. A high-fat diet decreases GABA concentration in the frontal cortex and hippocampus of rats. Biol Res. 2016;49:15-15.
- Hassan AM, Mancano G, Kashofer K, Fröhlich EE, Matak A, Mayerhofer R, et al. High-fat diet induces depression-like behaviour in mice associated with changes in microbiome, neuropeptide Y, and brain metabolome. Nutr Neurosci. 2019;22(12):877–93.
- Sandoval-Salazar C, Oviedo-Solís CI, Lozoya-Gloria E, Aguilar-Zavala H, Solís-Ortiz MS, Pérez-Vázquez V, et al. Strawberry intake ameliorates oxidative stress and decreases GABA levels induced by high-fat diet in frontal cortex of rats. Antioxidants. 2019;8(3):70. doi:10.3390/antiox8030070.
- Sandoval-Salazar C, Jiménez-García SN, Beltrán-Campos V, Vera-Becerra LE, Núñez-Colín CA. Effect of berrycactus fruit (Myrtillocactus geometrizans) on glutamate, glutamine, and GABA levels in the frontal cortex of rats fed with a high-fat diet. Open Life Sci. 2023;18(1):20220529.
- Marx W, Lane M, Hockey M, Aslam H, Berk M, Walder K, et al. Diet and depression: exploring the biological mechanisms of action. Mol Psychiatry. 2021;26(1):134–150. doi:10.1038/s41380-020-00925-x.
- Schröder H, Fitó M, Estruch R, Martínez-González MA, Corella D, Salas-Salvadó J, et al. A short screener is valid for assessing Mediterranean diet adherence among older Spanish men and women. J Nutr. 2011;141(6):1140–5.
- Guasch-Ferré M, Willett WC. The Mediterranean diet and health: a comprehensive overview. J Intern Med. 2021;290(3):549–66.
- Annett M. A classification of hand preference by association analysis. Br J Psychol. 1970;61(3):303–21. doi:10.1111/j.2044-8295.1970.tb01248.x.
- Papadaki A, Johnson L, Toumpakari Z, England C, Rai M, Toms S, et al. Validation of the English version of the 14-item Mediterranean diet adherence screener of the PREDIMED study, in people at high cardiovascular risk in the UK. Nutrients. 2018;10(2):138.
- García-Conesa MT, Philippou E, Pafilas C, Massaro M, Quarta S, Andrade V, et al. Exploring the validity of the 14-item Mediterranean diet adherence screener (MEDAS): a Cross-National Study in seven European Countries around the Mediterranean Region. Nutrients. 2020;12(10):2960. doi:10.3390/nu12102960.
- Lovibond SH, Lovibond PF. Manual for the depression anxiety stress scales. 2nd ed. Sydney: Psychology Foundation; 1995.
- Brown TA, Chorpita BF, Korotitsch W, Barlow DH. Psychometric properties of the Depression Anxiety Stress Scales (DASS) in clinical samples. Behav Res Ther. 1997;35(1):79–89.
- Treynor W, Gonzalez R, Nolen-Hoeksema S. Rumination reconsidered: a psychometric analysis. Cognit Ther Res. 2003;27(3):247–59.
- Bingham SA, Gill C, Welch A, Cassidy A, Runswick SA, Oakes S, et al. Validation of dietary assessment methods in the UK arm of EPIC using weighed records, and 24-hour urinary nitrogen and potassium and serum vitamin C and carotenoids as biomarkers. Int J Epidemiol. 1997;26(suppl_1):S137–S137.
- Mulligan AA, Luben RN, Bhaniani A, Parry-Smith DJ, Connor L, Khawaja AP, et al. A new tool for converting food frequency questionnaire data into nutrient and food group values: FETA research methods and availability. BMJ Open. 2014;4(3):e004503.
- Mlynárik V, Gambarota G, Frenkel H, Gruetter R. Localized short-echo-time proton MR spectroscopy with full signal-intensity acquisition. Magn Reson Med. 2006;56(5):965–70. doi:10.1002/mrm.21043.
- Godlewska BR, Near J, Cowen PJ. Neurochemistry of major depression: a study using magnetic resonance spectroscopy. Psychopharmacology. 2015;232(3):501–7.
- Simpson R, Devenyi GA, Jezzard P, Hennessy TJ, Near J. Advanced processing and simulation of MRS data using the FID appliance (FID-A)—an open source, MATLAB-based toolkit. Magn Reson Med. 2017;77(1):23–33. doi:10.1002/mrm.26091.
- Hollestein V, Buitelaar JK, Brandeis D, Banaschewski T, Kaiser A, Hohmann S, et al. Developmental changes in fronto-striatal glutamate and their association with functioning during inhibitory control in autism spectrum disorder and obsessive compulsive disorder. NeuroImage Clin. 2021;30:102622.
- Srinivasan R, Cunningham C, Chen A, Vigneron D, Hurd R, Nelson S, Pelletier D. TE-averaged two-dimensional proton spectroscopic imaging of glutamate at 3 T. NeuroImage. 2006;30(4):1171–8.
- Huster RJ, Westerhausen R, Kreuder F, Schweiger E, Wittling W. Morphologic asymmetry of the human anterior cingulate cortex. NeuroImage. 2007;34(3):888–95.
- Ernst T, Kreis R, Ross BD. Absolute quantitation of water and metabolites in the human brain. I. Compartments and water. J Magn Reson B. 1993;102(1):1–8.
- Xia M, Wang J, He Y. BrainNet Viewer: a network visualization tool for human brain connectomics. PLoS One. 2013;8(7):e68910.
- Sickmann HM, Waagepetersen HS, Schousboe A, Benie AJ, Bouman SD. Obesity and type 2 diabetes in rats are associated with altered brain glycogen and amino-acid homeostasis. J Cereb Blood Flow Metab. 2010;30(8):1527–37.
- Valladolid-Acebes I, Merino B, Principato A, Fole A, Barbas C, Lorenzo MP, et al. High-fat diets induce changes in hippocampal glutamate metabolism and neurotransmission. Am J Physiol Endocrinol Metab. 2012;302(4):E396–E402.
- Reichelt AC, Gibson GD, Abbott KN, Hare DJ. A high-fat high-sugar diet in adolescent rats impairs social memory and alters chemical markers characteristic of atypical neuroplasticity and parvalbumin interneuron depletion in the medial prefrontal cortex. Food Funct. 2019;10(4):1985–98. doi:10.1039/C8FO02118J
- Merat S, Casanada F, Sutphin M, Palinski W, Reaven PD. Western-type diets induce insulin resistance and hyperinsulinemia in LDL receptor-deficient mice but do not increase aortic atherosclerosis compared with normoinsulinemic mice in which similar plasma cholesterol levels are achieved by a fructose-rich diet. Arterioscler Thromb Vasc Biol. 1999;19(5):1223–30.
- Wang C, Kerckhofs K, Van de Casteele M, Smolders I, Pipeleers D, Ling Z. Glucose inhibits GABA release by pancreatic beta-cells through an increase in GABA shunt activity. Am J Physiol Endocrinol Metab. 2006;290(3):E494–499.
- Huang XT, Li C, Peng XP, Guo J, Yue SJ, Liu W, et al. An excessive increase in glutamate contributes to glucose-toxicity in β-cells via activation of pancreatic NMDA receptors in rodent diabetes. Sci Rep. 2017;7:44120.
- Winnock F, Ling Z, De Proft R, Dejonghe S, Schuit F, Gorus F, Pipeleers D. Correlation between GABA release from rat islet beta-cells and their metabolic state. American Journal of Physiology-Endocrinology and Metabolism. 2002;282(4):E937–942.
- Cobb CA, Cole MP. Oxidative and nitrative stress in neurodegeneration. Neurobiol Dis. 2015;84:4–21.
- Baj A, Moro E, Bistoletti M, Orlandi V, Crema F, Giaroni C. Glutamatergic signaling along the microbiota-gut-brain axis. Int J Mol Sci. 2019;20(6):1482. doi:10.3390/ijms20061482.
- Cryan JF, O'Riordan KJ, Cowan CSM, Sandhu KV, Bastiaanssen TFS, Boehme M, et al. The microbiota-gut-brain axis. Physiol Rev. 2019;99(4):1877–2013.
- Delgado TC. Glutamate and GABA in appetite regulation. Front Endocrinol (Lausanne). 2013;4:103.
- Lowe CJ, Reichelt AC, Hall PA. The prefrontal cortex and obesity: a health neuroscience perspective. Trends Cogn Sci. 2019;23(4):349–61.
- Townsend RF, Woodside JV, Prinelli F, O'Neill RF, McEvoy CT. Associations between dietary patterns and neuroimaging markers: a systematic review. Front Nutr. 2022;9:806006.
- Arnoldy L, Gauci S, Young LM, Marx W, Macpherson H, Pipingas A, et al. The association of dietary and nutrient patterns on neurocognitive decline: a systematic review of MRI and PET studies. Ageing Res Rev. 2023;87:101892.
- Shalev D, Arbuckle MR. Metabolism and memory: obesity, diabetes, and dementia. Biol Psychiatry. 2017;82(11):e81–e83.
- Swarbrick MM. A lifetime on the hips: programming lower-body fat to protect against metabolic disease. Diabetes. 2014;63(11):3575–7.
- Schmahmann JD. Vascular syndromes of the thalamus. Stroke. 2003;34(9):2264–78.
- Lai JS, Hiles S, Bisquera A, Hure AJ, McEvoy M, Attia J. A systematic review and meta-analysis of dietary patterns and depression in community-dwelling adults. Am J Clin Nutr. 2013;99(1):181–97.
- Hepsomali P, Groeger JA. Diet and general cognitive ability in the UK Biobank dataset. Sci Rep. 2021;11(1):11786. doi:10.1038/s41598-021-91259-3.
- Padmala S, Pessoa L. Interactions between cognition and motivation during response inhibition. Neuropsychologia. 2010;48(2):558–65.
- Yang M-H, Yao Z-F, Hsieh S. Multimodal neuroimaging analysis reveals age-associated common and discrete cognitive control constructs. Hum Brain Mapp. 2019;40(9):2639–61.
- Modi S, Rana P, Kaur P, Rani N, Khushu S. Glutamate level in anterior cingulate predicts anxiety in healthy humans: a magnetic resonance spectroscopy study. Psychiatry Res Neuroimaging. 2014;224(1):34–41.
- Averill LA, Purohit P, Averill CL, Boesl MA, Krystal JH, Abdallah CG. Glutamate dysregulation and glutamatergic therapeutics for PTSD: Evidence from human studies. Neurosci Lett. 2017;649:147–55.
- McCutcheon RA, Krystal JH, Howes OD. Dopamine and glutamate in schizophrenia: biology, symptoms and treatment. World Psychiatry. 2020;19(1):15–33.
- Holton KF, Kirkland AE, Baron M, Ramachandra SS, Langan MT, Brandley ET, Baraniuk JN. The low glutamate diet effectively improves pain and other symptoms of gulf war illness. Nutrients. 2020;12(9):2593.
- Langan MT, Kirkland AE, Rice LC, Mucciarone VC, Baraniuk J, VanMeter A, Holton KF. Low glutamate diet improves working memory and contributes to altering BOLD response and functional connectivity within working memory networks in Gulf War Illness. Sci Rep. 2022;12(1):18004.
- Jelen LA, King S, Mullins PG, Stone JM. Beyond static measures: a review of functional magnetic resonance spectroscopy and its potential to investigate dynamic glutamatergic abnormalities in schizophrenia. J Psychopharmacol. 2018;32(5):497–508.
- Mescher M, Merkle H, Kirsch J, Garwood M, Gruetter R. Simultaneous in vivo spectral editing and water suppression. NMR Biomed. 1998;11(6):266–72.
- Brix MK, Ersland L, Hugdahl K, Dwyer GE, Grüner R, Noeske R, et al. Within- and between-session reproducibility of GABA measurements with MR spectroscopy. J Magn Reson Imaging. 2017;46(2):421–30. doi:10.1002/jmri.25588.
- Baeshen A, Wyss PO, Henning A, O'Gorman RL, Piccirelli M, Kollias S, Michels L. Test–retest reliability of the brain metabolites GABA and Glx With JPRESS, PRESS, and MEGA-PRESS MRS sequences in vivo at 3 T. J Magn Reson Imaging. 2020;51(4):1181–91. doi:10.1002/jmri.26921.
- Kozhuharova P, Diaconescu AO, Allen P. Reduced cortical GABA and glutamate in high schizotypy. Psychopharmacology. 2021;238(9):2459–70.
- Hepsomali P, Machon S, Barker H, Lythgoe DJ, Hugdahl K, Gudbrandsen M, Allen P. Signatures of exposure to childhood trauma in young adults in the structure and neurochemistry of the superior temporal gyrus. J Psychopharmacol. 2023;37(5):510–9.
- Near J, Andersson J, Maron E, Mekle R, Gruetter R, Cowen P, Jezzard P. Unedited in vivo detection and quantification of γ-aminobutyric acid in the occipital cortex using short-TE MRS at 3 T. NMR Biomed. 2013;26(11):1353–62.
- Wijtenburg SA, Near J, Korenic SA, Gaston FE, Chen H, Mikkelsen M, et al. Comparing the reproducibility of commonly used magnetic resonance spectroscopy techniques to quantify cerebral glutathione. J Magn Reson Imaging. 2019;49(1):176–83.