
ABSTRACT
The paper is about practice, rather than research, and shows how a complex systems engineering project was done. The project was unique, involving a problem never before investigated, namely, to find the difference in occupational safety of a train driver between being alone in a locomotive cab and having an accompanying assistant. The project used a systems methodology discussed elsewhere. It required understanding the overall New Zealand Rail system and ensuring the objective was clear. A strategy was developed based on a set of system principles. Fault trees gave accident probabilities, from which relative values of Fatal Accident Frequency Rates were computed. As a practical simplification, detailed analysis was confined to a limited part of the overall rail system which could be taken as representative of the whole. Care was taken to treat input information as a whole rather than as separate unconnected items, emphasising information quality, which varied depending on type and source. Major points were the importance of (a) a clear and coherent strategy including careful system decomposition, (b) having a body of information of high and consistent quality, (c) fostering clarity and transparency in communication, and (d) having – and learning – good communication skills. This work is part of a Special Issue on Systems Perspectives: Clarity through Examples (see Dias 2023).
Introduction
The aim of this paper is to discuss a way of dealing with systems engineering problems in practice, and particularly systems problems that are complex, large in that they require significant effort, and unique in that there is no precedent – where they have not been tackled before and so demand novel thinking and execution. It builds on earlier work which argues that novel and complex problems require not just technique but also a specific attitude: the Systems Stance (Elms Citation2020).
We proceed by first outlining the Systems Stance, or at least, some significant aspects of it. This leads to discussion of how the approach was used in a real-life application where an assessment was required of the effect on locomotive engineer safety in a rail network if the operating procedure changed from having two people in a locomotive cab to running trains where the driver was alone in the cab. As will be seen, the issues were complex, requiring careful definition of systems and purpose.
The systems stance
The systems stance starts from the point of view that we never see reality directly in all its detail, but rather through the medium of models. It is as true for engineering as it is for all aspects of life. This is not in the least to say that there is no such thing as reality. There is indeed, but the point is that we construct what we see as reality out of many inputs of information such as photons received by our eyes. The act of construction is founded on the basis of expectations coming from both our own experience and that of others. And we label what we have constructed. As I write this I am looking at something in front of me. Photons stream into my eyes. I cut out – construct – a pattern and label it ‘computer’. It is a model within a surrounding environment. And this model is what I see, what I perceive, and I call it reality. There is no problem with this. Normally it works well and our everyday lives are formed through model-perceptions of this sort.
However, when we are in a situation which is novel and unique, dealing with something new and unfamiliar, this model-perception activity can be treacherous. We don’t see everything and might miss something crucial. This is particularly true when working with systems, which usually are new in some way. A system is, after all, something we define as such through a mental act – we have carved it by choice from the totality of reality. Thus we have to be careful with systems. The act of definition requires discipline – the sort of discipline of thought that structural engineers, for example, use in defining a free body.
The point is that in a sense everything we see can be thought of as a model. Some things we talk about as ‘reality’, and some we overtly deal with as models – physical models, computer models and so on. But a model is not a simple thing, even though familiarity can make it seem so. The Systems Stance paper (Elms Citation2020) gives 29 comments on models, of which two examples are, by way of illustration, A model should have a purpose, which drives its form. Its purpose is to provide information. The model is not an end point in itself, and, A model has a range of applicability relating to its purpose, which must be known and understood by its user. Normally we do not have to think deeply about familiar models. We just use them. However, as noted above we have to be careful when working with systems, especially when dealing with novel situations with little or no precedent. We must get our models right. But what exactly do we mean by ‘right’? It demands a discipline of thought, of considering those 29 comments, otherwise the work can go badly wrong. It also requires that we are clear as to what we mean by ‘system’, and that we follow a set of principles.
As to what we mean by ‘system’, in one sense and following on from the ideas in the previous paragraph, a system is a model. Suppose we are working with a river. We begin by defining the overall system and this must include its environment – not the whole world, but those aspects of it that affect and are affected by the system proper. We need to get quantitative results of, say, flood levels. To do this we need to do some quantitative modelling. This means we have another model, a model within a model so to speak. In practice, working with a large river system would require many systems defined in the course of the work, defined in their own right. They are by no means always subsystems of the overall system. They do not need to be. Rather, it depends on the purpose and context, on what one is trying to achieve at that point. A system is defined by its purpose, and in the course of a large project there will be as many purposes as there are tasks to be done.
The Systems Stance (Elms Citation2020) deals with many system-related issues such as values, time-related issues and common biases, but also, particularly relevant to this paper, it provides a set of methodological principles as guides for good systems work. They are
The Principle of Sufficiency (Rodriguez-Nikl and Brown Citation2012), which requires that any system should be sufficiently broad in scope to cover all issues relevant to the problem in hand. (That is, the problem defined by the immediate purpose).
The Principle of Requisite Detail (Elms and Brown Citation2013), which says that a system model must have sufficient detail to capture the phenomena of interest.
The Principle of Consistent Crudeness (Elms Citation1985, Citation1992), which relates to getting the balance right. It is a methodological principle stating (roughly) that when there are a number of contributors to a model outcome, then given the sensitivity of the outcome to these contributors, the quality of the outcome will be determined, even dominated, by the contributor with the lowest quality. It is wrong to believe that any arbitrary improvement in accuracy in some detail would necessarily improve the quality of the result. (‘Quality’ is a broad term including uncertainty and dependability).
The Healthy System Criteria (Elms Citation1998), which is a set of five criteria that can be used in judging the well-formedness of a system model. They are Balance, Completeness, Cohesion, Clarity and Consistency. These criteria could also be thought of as five independent principles for well-formed systems.
The next section shows the importance of these principles in carrying out the Single-Manning project discussed below. Note, though, that while the principles might seem clear enough and relatively straightforward, they are not trivial and in practice their use can be far from simple.
The single-manning project
New Zealand Rail had a problem in the 1980s. A new government required the organisation to change from being a state-governed organisation to a stand-alone state-owned enterprise. This meant that it had to move towards acting and operating within the constraints of a budget, and it was ring-fenced as to what it could do. Costs had to be severely reduced. The main costs were salaries. The organisation had to reduce the number of employees. To give an idea of the scale, over a few years the number of NZ Rail employees fell from about 22,000 to just over 4000.
Before the restructuring, the skills and capabilities of rail staff varied widely. Many were superbly competent, but there were others with little training or capability who were there because the government wanted them employed as a social welfare service. It gave the unemployable a way to live with dignity. They often had little to do – they might be porters at a station, perhaps – but at least they had a job. It was government policy. But in the new regime, they were redundant to the railways operation.
Some employees, too, were there for historical reasons, and their role could be questioned. Such was the case for those who were the drivers’ companions in the two-man crews required in locomotives. In the days of coal-fired steam locomotives, the second man, the fireman, had an important role. He had to stoke the fire and shovel coal to provide the energy source. He also had secondary roles, keeping a lookout, for instance, on his side of the train, and even making sure the driver was awake. With the change to diesel or electric power, most of this work was no longer needed. The second-man role was now to sit in the left-hand seat and, whenever a periodic buzzer sounded, to press a button to show he was awake and paying attention. If he failed to press the button within a given period of time, the brakes would come on and the train would stop. It was hardly an arduous task. I’ve tried it myself. But was it necessary? Would removing the driver’s assistant have a significant impact on safety? (Note that nowadays New Zealand locomotive engineers can be women, but at the time of the project, all were men). The rail management needed to reduce manning levels substantially and they believed that safety would be a key point in discussion with the rail unions. Specifically, changing to single manning by taking out the second man from the locomotive could be seen as an unacceptable reduction in driver safety.
But the safety reduction was only conjecture. How in fact would driver safety be affected if the second man were removed? Could this be identified and quantified? Facts would be helpful in any discussion. So New Zealand Rail management asked me to produce a figure for the loss of safety in moving to single manning. I agreed to do so. The question was principally how could driver safety be measured and assessed? I had to start by producing a strategy.
Strategy
First I had to understand and define the overall system of concern. The task was formidable. The physical system alone was huge. The rail network had 4100 km of track ranging over the whole country from Invercargill in the south to Whangarei and beyond in the north. It had 2100 level crossings, 1787 bridges and 150 tunnels. Mostly it was single track line with passing loops. The gauge between rails was 1067 mm, considerably narrower than the international standard gauge of 1435 mm. (The reason for the narrow gauge was historical: a narrow-gauge line could be built with tighter curves in New Zealand’s hilly country, as well as being cheaper and quicker to construct). Overall, most rail traffic was freight, though there were substantial commuter passenger operations in the Auckland and Wellington regions as well as a few long-distance tourist trains. The rail track was seldom in easy country. For most of its length it went through hills and mountains, involving tunnels, bridges and viaducts. It was frequently challenged by landslides (slips), washouts and floods. The physical system also included means of controlling train movements – signals, for instance.
The system as a whole was more than the physical system, though. Following the Principle of sufficiency it had to include all those aspects necessary for achieving its purpose, which was to develop an estimate of the difference in driver safety between single- and double-manning. Thus it had to include management issues, such as operational rules, as well as the employees and their skills, knowledge and capabilities. To stop a train, for instance, required a physical system – correctly functioning signals for instance – a driver who could see the signals and know, from knowing the rule book, what they meant, as well as having the skill to operate the brakes correctly (more difficult than stopping a car). To understand why a train might not stop when required evidently needed knowledge of many things beyond the physical system – operational rules, control systems and skilled and trained personnel who, like any people, would be prone to error.
The overall aim was twofold. First, the overall level of driver safety had to be assessed compared with other occupations. This was needed so that it could give a context to relative safety. If the overall safety were low, then it increased the urgency of getting a good estimate of relative safety. If driving a locomotive was unusually hazardous under normal conditions, then any decrease in safety would be unacceptable. An overall level was also required in order to ground estimates of relative safety in reality. Secondly, the difference in safety had to be assessed between single- and double-manning operations. This required a far greater level of detailed understanding of what both the driver and the second man had to do, particularly in heightened-hazard situations, such as at a crossing loop where there might be another train present. The principle of requisite detail demanded analysis of a far more complex system than that used for assessing overall driver safety.
Fortunately, the operational system we were dealing with was of such a nature that it could be decomposed into separate parts. Decomposition of a complex system can be tricky and could easily go wrong. However, in this case we could consider different accident types, and there was little or no correlation between them.
Discussions with rail personnel and a study of historical accidents showed that accidents could be grouped into ten types, namely
Derailment due to track fault or mechanical reason
Collision with an obstruction
Collision with maintenance equipment
Head-on collision with a train standing at a crossing loop
Tail-on collision with a train standing at a crossing loop
Tail-on collision in a following movement
Collision when running under Mis.59 rule (an alternative train-running protocol)
Collision when running under pilot working
Tip-over at a tight curve
Tip-over at a turnout
The first three on the list could happen anywhere on the entire network, but the rest could only occur at specific heightened-hazard locations, and here, more detail was needed for assessing train accident probabilities. These would then lead to driver safety estimations for the heightened-hazard situations when combined with operational information such as train timetables, location and number of heightened-hazard locations and so on.
We now faced a problem. The number of heightened-hazard locations and types over the whole rail network was huge. We had to deal with the detail (principle of requisite detail), but the size of the system at that level of detail was too big. Simplification was needed, while still maintaining the necessary detail. We chose to use a T-strategy (as I’ve called it) in which we consider the whole problem in its entirety at a low level of detail (the cross-bar of the T) but analyse the required greater detail in only part of the overall problem (the vertical bar of the T) and take it (an important assumption, agreed by those concerned) as representative of the whole. It has proved a useful strategy for other projects I’ve tackled.
In this case, after discussion with rail personnel, we decided to consider heightened-hazard location accidents on the 100 km section of trunk line between the towns of Palmerston North and Taihape in the North Island as typifying the situation in the whole rail network. A second simplification, requested by the client, was to consider only long-distance freight trains and not the very different operations of localised shunting, suburban commuter trains or the very few long-distance tourist-oriented trains.
As a measure of safety we chose Fatal Accident Frequency Rate (FAFR), sometimes referred to as the Fatal Accident Rate (FAR), defined as the number of fatal accidents per hundred million working hours.
In order to achieve estimates of relative safety, we used a fault tree approach which had the advantage of being transparent as well as being able to take account of detailed accident causes. An example of fault tree use is given below. However, in order to use this approach, and indeed to be able to carry out the whole project, I needed a great deal of information, some of it highly specialised.
Information
I had to learn about rail operations in detail at all levels, discover how accidents could happen and their causes, and decide on an achievable measure for driver safety.
To understand rail operations I needed access to staff in many situations, from gangers maintaining the track to signals engineers and the logical complexity of their work, and of course, to locomotive engineers – engine drivers. So I partnered with a skilled member of rail staff, John Mander, who could both give me a deal of information himself but also provide introductions so that I could talk to others. John and I became good friends. Later he left railways and became a structural engineering academic, and at the time of writing is a professor in Texas. Without John, the project would have been impossible. It is one of many instances when I’ve needed to work with someone with particular inside knowledge and skills, to complement my own more general systems skills. Insofar as I specialise in generality, I’ve found it vital to work closely with those with specialist skills at all sorts of level. Obviously, good communication skills are vital in this sort of systems task.
I emphasise this. It is not a trivial point. I repeat: good communication skills are vital when working with complex systems. And it is not simply a matter of being naturally able to get along well with people. The skills are learnable skills and matters one would not think of in the normal course of life. There are many tricks to learn. To give one example, people in any organisation tend to develop a particular vocabulary in their everyday conversation. Of course they will also have technical jargon connected with their work, but I am not talking about this. The point is to listen carefully to how they talk and try to pick up their special use of words. For instance, rail staff at all levels will often talk about being on the right track, going ahead when the signals are right, steaming ahead, driving a project through, shunting uncomfortable issues to one side and so on. This is not done deliberately – it is just their normal way of speaking. It is also quite subtle, and only occasionally do these work-related metaphors turn up. The trick is, first spot these words, then occasionally drop them into your own way of speaking. Translate, if you like, what you are saying into their language. It immediately smooths the way and gives the impression that you are someone they are comfortable to talk with, able to understand what they want to share with you. This trick is surprisingly powerful. There are many other possibilities. I emphasise the point because communication skills of this sort are not normally included in the training of good systems engineers. They are not in the curriculum, which tends to focus more on analysis. However, this paper is about practice, not theory. I am well aware that some of the ideas here have implications for engineering education.
Returning to the single-manning example, quite apart from learning theoretically about rail operations and talking to people, I went to look at the situation in the field. I visited crossing loops, bridges, curves and signals. I rode sections of the line on a jigger. At times I rode in a locomotive, finding at first hand the difficulty of keeping awake in the early hours of the morning.
I needed to know how accidents could happen, their frequency and the gravity of their consequences. The company kept good accident records, so I went through them to see what had happened over many years. Rolling stock and operating systems changed over time, but although this meant the immediate causes of accidents might change, the overall categories were the same. Either a train would hit something – an obstruction, a land slip, a washout or another train – or it would derail due to a track fault, a weather problem such as high wind, or excessive speed on a curve. A bridge failure could also involve a serious accident. As well as New Zealand records I also looked through accident records in other parts of the world to try to understand the broader picture. For example a serious accident occurred in 2023 when a Spanish high-speed train derailed due to excessive speed at a curve when approaching Santiago de Compostela. Many passengers were injured and 79 died though the driver was not hurt (Wikipedia Citation2023). The direct cause was driver inattention, but it could also have been because there was no automatic train braking system.
One cause of an accident could be a failure in the operating system. A signal might have shown the path was clear when it was not. I would have to find out what could go wrong, its likelihood of occurrence and the corresponding likelihood of trains being present. It turned out that the New Zealand Rail signalling system involved complex and interconnected logic such that personnel in the company’s signals section needed high technical skill and tended to keep itself apart from the rest of the operation. The overall system for controlling train movements would have to include the people involved – not only those in the locomotive, but also those in the signalling system who might have to react to information such as that there was a fault in the line from natural causes or otherwise. In addition, those responsible for checking the line and letting the controllers know of any problem would have to be included. Repairs or modifications to the physical system could also be potential sources of failure, as with the Clapham Junction accident in 1988 when a passenger train ran into the rear of another because of faulty rewiring of part of the signalling system (Hidden Citation1989). A mistake was made, but also the checking procedure designed to catch errors was not carried out correctly. Clearly, the full system would not be simple, and the physical aspects would only be the most straightforward part of it.
A serious issue was the possibility that a driver would fall asleep and miss a signal or a speed warning. Many trains ran at night. What would the likelihood be of sleep, and how would that likelihood be affected by a second person in the cab? This would need some understanding of the psychology of sleep. Driving a train for long distances could often involve periods of boredom (‘It’s a boring job most of the time,’ a driver told me, though another said, ‘That line is so beautiful – I love it’). There was also the question of the effect of juggling day and night shifts. I joined the driver for one long night trip and discovered that sleep has many stages and levels. It is not an on or off situation. Though not completely asleep and with some awareness I could nevertheless be in a low-functioning daze.
And indeed, accidents often had nothing to do with the operating system. Many accidents in New Zealand were simply a matter of a train colliding with a vehicle at a level crossing. One bad accident occurred when a concrete truck turned off a main road, ignored flashing warning lights and ran into the side of a passenger train causing three fatalities, though only minor injuries to the truck driver (Dunphy Citation1994). Often bad weather would cause a landslip to impact the line or a river to wash it out from below. A bad accident, though with no fatalities, occurred when an insufficiently secured heavy object on a train shifted and impacted the side of a through-truss bridge, ripping out much of the bridge and causing many following waggons to pile up within the bridge. This accident had nothing to do with either operating system or driver (Jeffries Citation1998).
Then there was the issue of track maintenance, of making sure the track was sound, for instance with no buckles in the line on a hot day. Bridges had to be checked for structural degradation or scour from a river.
An important aspect of safety was the rule book, which set out the responsibilities and duties of rail staff. As new safety measures and operating procedures were introduced over time, the rule book grew. Old and outdated rules tended to be kept in the book for the good reason that in such a complex system the consequences of removing any requirement might not always be clear. It was safer to keep them in. But as the book grew, its ease of use decreased.
Obviously, the situation was complex and there were many things to learn. I needed to have a clear picture of train operations, what could go wrong and the safety checks that were in place. This gave a structure as to how to think about the problem. I also required detailed information as to causes and likelihoods. We needed numbers for the quantitative fault tree analyses which were to follow. The important thing was to see all the different pieces of information as a whole, rather than a set of uncoordinated items. I used a ‘pegging’ approach, as will be seen.
As to finding the numbers, some data was specific and reasonably well documented. Other information, while equally important, was much harder to pin down, such as the degree to which sleep would affect the average driver. The strategy adopted was first to insert the better-documented information items, and then to estimate the rest from whatever information was available, adjusting the latter figures to ensure the overall results from the fault tree analyses were compatible with known overall figures (such as a driver FAFR value) as well as possible. Such figures were used to ‘peg’ the tree models to reality. In a sense it was a calibration and bounding exercise, but it was also more than that.
The important point is that although the entire exercise required many individual estimates of occurrence frequency, the entire mass of information had to be treated as a whole. Different individual items varied in their reliability or quality. Some were very reliable such as the number of trains a day, because trains run to a known timetable. Others would be of far lower quality, such as the information from experienced track workers that the incidence of landslips on to the line in a certain area was about one in ten years or so. Such information was less specific, but it was still useful. The pegging approach could be thought of as assuming that all the different pieces of information were spread out on a rubber sheet. The hard or higher quality items were better known items and could be used to peg the rubber sheet in place. The sheet could then be stretched so that the lower quality items ended up in positions in effect bounded by the hard items. We knew their value roughly, but their final contributions were appropriately held in place on the sheet. The pegging process was also used in an overall sense in that the accident frequency results from all ten accident types were combined to give a total FAFR figure. The individual contributions could then be massaged so that the calculated FAFR was roughly the same as that observed in practice.
While many of the issues leading to accidents are physical, such as the incidence of a land slip bocking the line, many others are due to human factors. We divided them into five categories: confusion, distraction, misjudgement of speed, sleep and illness. There is a broad literature on human error, but two useful sources were books by Reason (Citation1990), and Turner and Pidgeon (Citation1997). We needed expert help here, and turned to OPRA, an industrial psychology consultancy, for help and advice in probability estimates for sleep, distraction and so forth. We did not need precise values – ball-park estimates would be good enough (the principle of consistent crudeness applied and also the pegging procedure) – but rather, we required good estimates of the effect on the probability of a driver falling asleep (or being distracted etc.) when switching from double- to single-manning operation.
New Zealand Rail accident records gave an overall FAFR value for NZ Rail locomotive engineers with double-manning. They showed that over the two years ending on 31 December 1986, locomotive engineers suffered 59 injuries, while there were 3273 injuries to all other railway employees. Locomotive engineers comprise about 11% of railway staff, so that from these figures a driver is about seven times as safe as the average of rail employees. In terms of fatalities, the historical data showed there was about one driver fatality in ten years, or 0.1 fatalities per year. In a year the total number of train kilometres travelled was about 21 × 106 km. Dividing the annual fatality frequency of 0.1 by the distance travelled, dividing by 2 for the number of people at risk (in the cab) and multiplying by the average speed of 55 km/h between Palmerston North and Taihape gave a resulting FAFR value of 13. This is about a quarter of the risk of travelling by car.
Fault trees
A fault tree calculates the probability of an accident (or fault) by combining the probabilities of its causes. There a are two steps: first the logic must be correct so that the tree has the correct structure, and second, occurrence probabilities must be found and inserted into the tree. The immediate causes of the overall fault will in turn be caused by other matters, with yet others causing them, and so on. The easiest way to show this is to take a specific example. is the fault tree we used for the case of a train tipping over due to entering a tight curve too fast, as with the Santiago accident mentioned earlier. The tree given here assumes there are two people in the cab. A parallel tree was used for the single-manning case. The box at the top of the tree in shows the final result – an estimate of the probability of a single train tipping over when it enters a curve as 5.86 E−07, which means a probability of 5.86 × 10−07, or 0.000000586. As one would expect, this is a very small figure. For the train to tip over, a combination of two things is required: that the train in travelling at excessive speed, AND that it would tip over given that it was going too fast. For the Santiago accident the speed limit was 80 kph and the train was travelling at about 180 kph. All vehicles derailed, and four overturned. Returning to the tree of , where two contributors are both required for an accident, their probabilities are combined by multiplying them – if, that is, the two are independent. In this case they obviously are, with an estimate for excessive speed being 5.86 E−06 coming from the next lower level of the tree and for the conditional probability of tipping over given that there was excessive speed as 0.1, or one in ten. The latter figure was the best estimate of a group of experienced railway personnel. The definition of excessive speed was simply that the train was travelling above the speed limit for that curve. At or just above the speed limit, the train would not tip over. It would have to be going significantly faster for an accident to happen. How likely would that be? There was no detailed data, so we had to rely on professional judgement. Such information is not to be downplayed. Its quality might be poor in terms of precision, but it is valuable nonetheless, both because of its place in the analysis, which is, recall, comparative, and also because it came from locomotive engineers, who were the people most likely to be affected by the results. The point is that information where it is combined as here in an overall analysis is part of a whole – it must be seen in the context of the whole.
Figure 1. Fault tree for a tip-over accident at a tight curve.
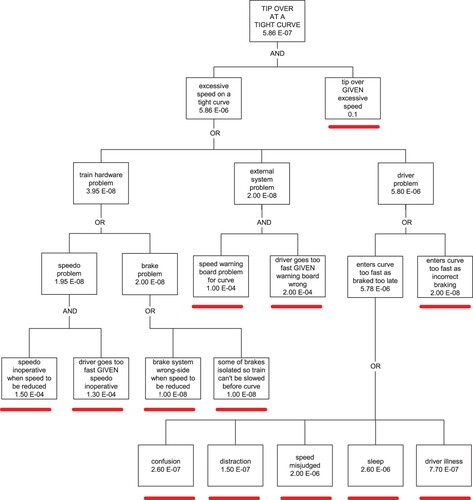
The left-hand box at the second level gives an estimate of the likelihood of a train going too fast (5.86 E−06) based on a number of different factors and possibilities. The three possible causes of the train going too fast are given in the next level down as: a train hardware problem such as a fault with the brakes or the speedometer, OR an external system problem such as a wrong speed limit notice, OR a driver problem such as inattention or sleep. Each of the three alternatives in this OR gate has a probability, and the three values are combined by adding them,, assuming they are independent. The values are 3.95 E−08, 2.00 E−08 and 5.80 E−06. Clearly the last dominates the other two.
Continuing down the tree from the Driver Problem box, the fault is either that the driver has braked too late OR that he braked incorrectly with probabilities of 5.78 E−06 and 2.00E−08 respectively. In turn, braking too late has the five possible reasons shown at the bottom of the diagram, which are dominated by the two possibilities that the speed was misjudged, or the driver was asleep. Obviously, following up the tree, these two possibilities are the dominant contributors to the final figure at the top. It meant in this particular tree we had to focus on the quality of the driver misjudgement and sleep estimates.
The source probability numbers in the trees were the result of a great deal of discussion and consultation, both with those in the field and with industrial psychologists. We had to bear in mind in mind that overall driver safety estimation was only needed at an indicative level, and that regarding the differential results between single and double manning the main things that had to be considered were those factors which would change between single and double manning, such as the likelihood of inadvertent sleep.
The tree in this example is relatively simple, but others were more complicated. Ten different fault tree structures were used for the project. As complexity increases it is imperative that the logic is understood and handled correctly, to ensure that any lack of independence between items is considered. Fortunately none of the trees used for this analysis had such complications.
Results
The tree analyses produced estimates of the probability of an accident. FAFR value estimation also required the likelihood of the accident resulting in a fatality as well as the time of exposure, which could be obtained from the known time a driver would take to traverse the analysed stretch of line and the number of heightened hazard points of each type on it. FAFR results for each accident type were added to get an overall result. shows the results. It can be seen that moving from double- to single-manning would mean an estimated increase of FAFR of about 1.3 over an initial value of 16.32, or an increase of about eight percent. Recall that the FAFR value obtained from accident statistics was 13. This is acceptably close to the 16.3 obtained using the tree analyses. Given that for either figure the FAFR value is reasonably low – about a quarter of the risk of driving a car, as noted earlier – the eight percent decrease in safety predicted for changing to single manning is not significant. In any case, the analysis identifies the two outstanding risks to drivers as tip-over at a curve and collision with an obstruction such as a level-crossing accident. Any management initiative to improve safety should focus on these two accident types.
Table 1. Fatal Accident Frequency Rate results.
When the findings complete I had to present them to a meeting of union representatives. The transparency provided by fault trees was a great help in making it very clear exactly what the project had done and how the results were achieved. The union accepted the findings. From that point on, safety issues were no longer part of the talks between union and management. Single manning was adopted.
Conclusion
This paper gives an example of systems engineering practice, highlighting practical issues rather than theoretical techniques. It shows how a particular real-life systems project was carried out. Here are the most significant points.
The first task was to gain a sufficient understanding of the problem – of the overall system being dealt with as well as its environment and potential difficulties. This required extensive reading and research as well as discussions with people at all levels in the New Zealand Rail organisation. It was essential to have skills in finding relevant documents as well as an ability to interact easily with relevant people. Skills of good communication are centrally important in practice. They are learnable, but not often taught.
Closely related to the previous point, I had to make sure that I was very clear as to the required outcome, which meant I also needed to know why it was needed.
Next came the need to develop a strategy: how to achieve (b) in the light of (a). I used the discipline of a set of principles. These are important in practice. The use of a T-strategy for achieving the requisite degree of detail helped keep the size of the project within reasonable bounds. Fault trees were used not only for finding quantifiable results but also, importantly, because they provided a transparency to the process which was useful to both the client and others affected.
A strategy is a framework. The framework had to be filled with quantitative information. A great many individual pieces of information were involved. Those available had many levels of quality and came from many sources. It was important to deal with the required information as a whole rather than as independent pieces. This was achieved by a ‘pegging’ process where poorer-quality information could be bounded by information of higher quality, and also by grounding the detail on known overall and observed safety statistics.
The analysis was carried out and the results tested for sense.
Finally the results had to be presented to a sceptical (union) audience, where the transparency of the fault tree analyses led to acceptance of the findings with little dissention.
Acknowledgements
The formidable energies of John Mander and Ray Ryan of New Zealand Rail were of great help in this project. I also particularly want to acknowledge the support of the New Zealand Rail CEO, Francis Small. He was enthusiastic about the project, delighted at its outcome, and we became good friends, often working together both technically and in many other ways until his sad and untimely death. I dedicate this paper to his memory.
Disclosure statement
No potential conflict of interest was reported by the author.
References
- Dias, P. 2023. “System Perspectives: Clarity through Examples.” Civil Engineering and Environmental Systems 40 (3). https://doi.org/10.1080/10286608.2023.2293072
- Dunphy, M. F. 1994. Transport Accident Commission, Report No. 93-112. Train 901 Collision with Motor Vehicle, Rolleston, Canterbury, August 25, 1993. Wellington, NZ: New Zealand Transport Accident Commission.
- Elms, D. G. 1985. “The Principle of Consistent Crudeness.” In Proc. Workshop on Civil Engineering Applications of Fuzzy Sets, edited by J. Yao, and C. B. Brown, 35–44. West Lafayette, IN: Purdue University.
- Elms, D. G. 1992. “Consistent Crudeness in System Construction.” In Optimisation and Artificial Intelligence in Civil Engineering, edited by B. H. V. Topping, 71–85. New York: Kluwer Academic Publishers.
- Elms, D. G. 1998. “Indicator Approaches for Risk Management and Appraisal.” In Integrated Risk Assessment, edited by M. Stewart, and R. Melchers, 53–59. Rotterdam: Balkema.
- Elms, D. G. 2020. “The Systems Stance.” Civil Engineering and Environmental Systems 37 (4): 166–182. https://doi.org/10.1080/10286608.2020.1820722.
- Elms, D. G., and C. B. Brown. 2013. “Intuitive Decisions and Heuristics: An Alternative Rationality.” Civil Engineering and Environmental Systems 30 (3-4): 274–284. https://doi.org/10.1080/10286608.2013.853753.
- Hidden, A. 1989. Investigation Into the Clapham Junction Railway Accident. London: HMSO.
- Jeffries, W. P. 1998. Transport Accident Commission Report 98-104. Train 235 derailment Ngaruawahia 14March 1998. Wellington, NZ: New Zealand Transport Accident Commission.
- Reason, J. T. 1990. Human Error. New York: Cambridge University Press.
- Rodriguez-Nikl, T., and C. B. Brown. 2012. “Systems Approach to Civil Engineering Decisions.” Journal of Professional Issues in Engineering Education and Practice 138 (4): 257–261. https://doi.org/10.1061/(ASCE)EI.1943-5541.0000116.
- Turner, B. A., and N. F. Pidgeon. 1997. Man-Made Disasters. 2nd ed. Boston: Butterworth–Heinemann.
- Wikipedia. 2023. Santiago de Compostela derailment. Accessed August 13, 2023.