
 ?Mathematical formulae have been encoded as MathML and are displayed in this HTML version using MathJax in order to improve their display. Uncheck the box to turn MathJax off. This feature requires Javascript. Click on a formula to zoom.
Abstract
The cultural industries have come to the forefront as the potential job creators of the future. However, building on the concentric circles model and production system view of the cultural industries, we pose that many young and small organizations in the industries lack the motivation, ability, and opportunity to become job creator. We reason that industry location crucially affects job creation expectations. Evidence from an international sample of early-stage entrepreneurs strongly supports this thesis. We identify a divide between entrepreneurs in the ‘core’ cultural industries vis-à-vis those in the ‘non-core’ cultural industries, where the latter group is indistinguishable from entrepreneurs in non-cultural industries in their job creation expectations. Simultaneously, those in the core cultural industries are distinct from others in their expectations to maintain the same number of jobs, rather than grow. These findings have important implications for cultural policy aimed at promoting employment growth in the cultural industries.
Introduction
Rapid growth of the cultural industries, even in times of economic downturn, has put these industries at the forefront of policy-makers’ attention (CBS Citation2013, EY Citation2014, DCMS Citation2015). The labor-intensive nature of cultural and creative work in particular has led to organizations in these industries being viewed as the potential job creators of the future (Bakhshi and Windsor Citation2015). Indeed, it has been suggested that (organizations in) these industries may ‘create a high number of jobs within a short time’ (Wiesand and Söndermann Citation2005, p. 7) and can ‘absorb labor from declining sectors of the economy’ (Throsby Citation2001, p. 134). At the same time, however, it is less proven ‘whether these activities can support a productive economy with an engine of sustainable jobs at its core’ (Ross Citation2008, p. 33). Frankly, we do not know much about the actual job creation potential and processes in the cultural industries, something that is very much in line with recent work identifying that adequate analyses of the organizational forms and working practices associated with the cultural industries are missing, especially with regard to their implications for cultural policy (Hesmondhalgh and Pratt Citation2005).
In this paper, we contribute to this important research agenda by focusing on cultural entrepreneurs’ expectations of becoming job creators. Such expectations, being a mixture of growth potential as well as growth willingness (Stam et al. Citation2012), are closely related to realized job creation in the future (Wiklund and Shepherd Citation2003) yet avoid survivorship and recall bias in measurement (Cassar Citation2007). Recent research has identified entrepreneurs in the cultural industries, or ‘cultural entrepreneurs’ (Leadbeater Citation1999, Ellmeier Citation2003, Wilson and Stokes Citation2005), as key players in the realization of the cultural industries’ growth potential.
The overwhelming majority of entrepreneurs in the cultural industries employ only very few people (Hesmondhalgh Citation2002), however. Thus, although total employment in the cultural industries is growing (Wiesand and Söndermann Citation2005, DCC Citation2014, DCMS Citation2014), this seems to be at least partially accomplished through new founding rather than continued growth of the incumbent ventures owned by cultural entrepreneurs. Coming to a further understanding of entrepreneurial growth trajectories within the cultural industries is of great importance for effective policy-making aimed at stimulating growth in the cultural industries, as start-ups typically ‘aren’t the source of our economic vitality or job creation’ (Shane Citation2009, p. 142), even having a net job destruction effect after their first year due to high mortality rates (Shane Citation2009). By focusing on cultural entrepreneurs, those individuals who are owner-managers of recently initiated business activities (cf. Davidsson Citation2005), and using a large-scale international database of entrepreneurial activity, we are able to theoretically and empirically investigate an oft-overlooked yet numerically dominant group within the cultural industries (Jeffcutt and Pratt Citation2002).
Recognizing the unique traits of the cultural industries, we build on the concentric circles model of the cultural industries (Throsby Citation2008a) and the production systems view of the cultural industries (Pratt Citation1997) to theorize that there exist systematic differences in job creation expectations between entrepreneurs in the various cultural industries as well as compared to entrepreneurs outside the cultural industries. In so doing, we build a micro/meso-scale (Jeffcutt and Pratt Citation2002) intersectoral model of motivation, ability, and opportunity for job creation by (cultural) entrepreneurs across the cultural industries to answer the question as to how and why cultural entrepreneurs’ expectations of becoming job creators differ based on the cultural industry in which their ventures operate.
Job creation and the cultural industries
Organizing the industries: concentric circles and the production system
The cultural industries, those industries in which cultural goods and services are produced and disseminated (Throsby Citation2008a), consist of a heterogeneous set of participants. The different cultural industries have at least one important feature in common, however: they produce both economic and cultural value (Throsby Citation2001). Simultaneously, the various cultural industries vary widely in their work practices, prospects for growth, economies of scale, and size (Townley et al. Citation2009, EY Citation2014), and different cultural goods and services have differing degrees of cultural value relative to their economic value (Throsby Citation2008a).
Building on this variation, the concentric circles model of the cultural industries delineates the cultural industries into four ‘circles’ based on the balance between cultural and economic value produced in different cultural industries: the core creative arts (containing, e.g. the visual arts), other core cultural industries (with, for instance, the film industry), the wider cultural industries (hosting, e.g. publishing industries and sound recording), and the related industries (including, among others, advertising). As one moves inwards from the related industries to the core creative arts, the proportion of cultural to economic value produced in a given industry is argued to increase (Throsby Citation2008a). Though this does not necessarily imply that entrepreneurs operating in the industries less core to the cultural industries per definition produce less cultural value than those in the core, nor that no economic value is created in the core industries, it does imply that, on average, a stronger emphasis on the production of economic value can be witnessed in the more peripheral industries of the cultural sector.
In addition to variation in cultural and economic value produced in different areas of the cultural sector, it is also well-established that the cultural industries as a whole can be seen as a coherent system of production, with different areas of the cultural sector playing different roles within this system (Pratt Citation1997, Scott Citation1999, Pratt Citation2005). Specifically, it has been argued that the cultural industries production system consists of industries where content origination is organized (such as film production or music composition), those where exchange takes place (such as theaters, museums, and libraries), those where mass reproduction is the key activity (such as in printing and broadcasting), those where inputs are manufactured (such as musical instrument or film equipment construction), those where education and critique occur (such as in cultural education), and industries where archiving is central (such as libraries and museums; Pratt Citation1997, Pratt Citation2005).
Figure graphically represents our proposed theoretical model, in which we combine the concentric circles of Throsby (Citation2001) with Pratt’s (Citation1997, Citation2005) cultural production systems view. Broadly, these two models fit well, as illustrated in Figure . For example, the industries more core to the cultural industries, such as the visual and performing arts, typically serve as the producers of cultural content and creative ideas that are then diffused outwards into the more peripheral industries such as publishing and printed media, which are more focused on mass reproduction and diffusion of work.
Figure 1. A synthesis of the concentric circles model and the production system view of the cultural industries

However, a tension also arises when comparing the two models as entrepreneurs operating in the peripheral ‘related industries’ such as advertising and design also often produce original cultural content of significant cultural value (see, e.g. Pratt Citation2006) yet are placed in the outermost circle of the concentric circles definition due to the commissioned or economic nature of work in these industries (Throsby Citation2008a). We touch upon this tension further into this paper. Finally, the concentric circles model does not include the industries that manufacture the inputs into the system, such as instrument manufacturing or paint suppliers. In the remainder of this paper, we build on the delineation stemming from Figure as a tool to organize the literature on cross-sectoral differences in the motivation, ability, and opportunity for job creation in the cultural industries, and discuss our findings with the above disclaimers in mind.
The motivation to create jobs in the cultural industries
Entrepreneurs operating in the industries most core to the cultural sector differ fundamentally from other entrepreneurs in the motivating factors driving their work. Perhaps the most extreme illustration of such motivation differences is the art for art’s sake property of cultural work, where artists care vitally (if not exclusively) about the originality and technical prowess underlying their work at the expense of more economic or market-oriented considerations (Caves Citation2000, Eikhof and Haunschild Citation2007). This property leads to great difficulties for artists in contracting others to work for them, as they are often unable to sufficiently express their internal vision in advance (Caves Citation2000), making it unlikely that such cultural entrepreneurs will become job creators.
Paige and Littrell (Citation2002), for example, find that the typical American craft retailer is first and foremost motivated by personal happiness, independence, control over operations, personal expression, and personal recognition, and only to a lesser extent by a desire to increase sales and profits, and that these motivations alter their typical strategies and organizing principles. In these content-producing industries the identity of the producer is overtly inscribed in the final product (Scott Citation1999) such that individuality is a core criterion of success (Wilson and Stokes Citation2005, Pratt Citation2006). In turn, this typically results in a desire of freedom from outside control (Banks et al. Citation2000) and a desire of personal recognition and admiration (Paige and Littrell Citation2002). Such needs are strongly and negatively related to growth willingness (Davidsson Citation1989, Stam et al. Citation2012). In general, it has been found that early-stage or nascent entrepreneurs with low-growth ambitions typically value independence the most (Cassar Citation2007). Overall, then, it seems that entrepreneurs in the core cultural industries, because of their variety of artistic, social, and cultural goals, may simply lack the focused ambition to grow their business (NESTA Citation2006).
As economic value creation becomes a more dominant factor, as we move towards industries more peripheral to the cultural sector, the typical driving factors underlying work do change dramatically. Indeed, though cultural value is realized largely in the social sphere, economic value materializes in the marketplace (Throsby Citation2001, Townley et al. Citation2009). Such a change in the locus of value realization brings about major changes in strategies and forms of organization, as an increasing market focus rationalizes and bureaucratizes the production process (Stinchcombe Citation1959, Hirsch Citation1972). Indeed, whereas for entrepreneurs in the core cultural industries creation is often a fundamental goal in and of itself, entrepreneurs in more market-oriented cultural industries instead apply creativity towards some commercial purpose through the reproduction and distribution of cultural goods (Pratt Citation1997, Hill and Johnson Citation2003, Abecassis-Moedas et al. Citation2012).
Rationalization typically leads to an internal organization aimed at exercising control over resource allocation and the development process (see Tschang Citation2007 for an illustration in the videogame sector). In line with this reasoning, Thornton (Citation2002) discusses how a shift from a professional to a market logic in higher education publishing led to increased divisionalization, as well as to increasing attention for improving competitive position in favor of prestige. Furthermore, legitimacy became increasingly based on the market position of the firm rather than on personal reputation (Thornton Citation2002). Summarizing, as cultural practices become more connected to and dependent on the market, economic motivation supplants the artistic logic underlying work (Eikhof and Haunschild Citation2007) and growth strategies become more predominant and important as one moves from the core cultural industries to those more peripheral (Townley et al. Citation2009).
The ability to create jobs in the cultural industries
Growth is a costly and complex process, and only a small fraction of those motivated to grow their ventures are able to do so (Stam et al. Citation2012). Cultural value is intangible, difficult to quantify, and subjectively determined (Kretschmer et al. Citation1999, Throsby Citation2001), and resources underlying cultural value ‘cannot be clearly defined, they emerge from unexpected sources, and they lose their value for reasons that are not entirely understood’ (Lampel et al. Citation2000, p. 265). As noted by Caves (Citation2000, p. 3), ‘nobody knows’ the determinants of success for cultural products and services. These issues lead to great complications in the acquisition of funds for cultural entrepreneurs, such that the financial support structure may be ‘not only ill equipped to deal with their needs, but may actually be hostile to them’ (Banks et al. Citation2000, p. 460), compounded by the fact that ‘there is no collateral for an idea’ (Townley et al. Citation2009, p. 946). This is problematic because, independent of their growth aspirations, small businesses with access to financial capital simply grow more (Wiklund and Shepherd Citation2003).
Further confounding the ability to become job creators is the fact that cultural value production requires highly skilled and specialized labor, whereas activities more concerned with economic value production or with mass reproduction and distribution can more easily make use of ‘humdrum’ or non-creative labor (Caves Citation2000). Indeed, the proportion of creative vs. non-creative labor utilized in production declines steadily as coreness decreases (Throsby Citation2008a). Whereas attracting and managing humdrum labor is relatively straightforward and often standardized (Caves Citation2000, Eikhof and Haunschild Citation2007), the organization of creative professionals is notoriously difficult (Mumford et al. Citation2002, Abfalter Citation2013). As a result, producers that require predominantly creative labor inputs, as in the industries more core to the cultural sector, are less able than others to draw on established organizational routines, as skilled professionals desire autonomy and tend to reject fixed structures (Lampel et al. Citation2000, Abfalter Citation2013). These tendencies make the hiring and organization of employees a highly complicated and costly procedure. Illustrative of this is a study by Eikhof and Haunschild (Citation2007), showing how German theater organizations had standardized human resource management practices for non-artistic staff yet costly, time-consuming, and complicated management practices for their artistic staff.
The opportunity to create jobs in the cultural industries
In addition to the motivation and ability of the cultural entrepreneur to create jobs, there also exists inter-sectoral variation in the opportunity to create jobs. Some types of cultural work simply provide the entrepreneur with an opportunity for growth, whereas other types of work do not provide such opportunities. For example, work in the core of the cultural industries is frequently done in a highly unique, personal, and/or piecewise manner (Caves Citation2000, Stam et al. Citation2008), such that the typical venture in the core simply cannot ‘scale up’ its number of employees, being fundamentally incompatible with its core value proposition. Furthermore, funding in the artistic core of the cultural industries in particular comes from government subsidies which, while perhaps allowing the entrepreneur’s activities to continue, likely limit growth opportunities due to the fact that they typically only cover costs of operation (Rutten et al. Citation2004).
Turning to activities concerned with the reproduction and mass distribution cultural work, activities become increasingly more capital-intensive (Pratt Citation1997). This increasingly capital-intensive nature of work introduces not only various complexities of production and management, but also offers new pathways of growth to the cultural entrepreneur that those in the core industries do not have. For example, economies of scale and scope become increasingly available to the cultural entrepreneur involved in mass reproduction (Coser et al. Citation1982), especially in light of continuing technological developments resulting in increasing levels of productivity (Preston and Sparviero Citation2009).
However, perhaps partly due to these economies of scale and scope, industries such as film production (involved in content origination in the other core cultural industries), as well as the various industries in the wider cultural sector such as publishing, are often characterized by an industry structure in which a small number of very dominant, large organizations control large aspects of the cultural ecosystem and that, consequently, set many aspects of the terms of engagement in their respective industries (Hesmondhalgh Citation2002, Scott Citation2002). These dominant organizations are often horizontally integrated and vertically disintegrated, outsourcing activities to the flexibly-specialized ventures of interest to the current study, resulting in a situation where new ventures are often highly dependent on these large multinational corporations for their sustenance and survival (Scott Citation2002, Hesmondhalgh and Pratt Citation2005). In turn, the presence of these dominant firms may constrain growth opportunities for new ventures because these ‘majors’ may have an interest in maintaining the existence of small, flexible firms rather than supporting continued growth of these ventures, given that larger firms tend to be less flexible and specialized.
Finally, entrepreneurs in the more dispersed related cultural industries, such as advertising and architecture, can be expected to have significant opportunities for job creation due to the applied nature of their cultural production (Abecassis-Moedas et al. Citation2012). In these industries, work is highly labor-intensive but much less intertwined with the identity of the individual producer, as work is inherently customer-driven (Hill and Johnson Citation2003, Stam et al. Citation2008). Indeed, whereas the dominant ideology in the core cultural industries has been posed to be individual authorship, work in these industries revolves much more around collective production (Stam et al. Citation2008). For instance, Sunley et al. (Citation2010, p. 881) found that many design organizations expressed an explicit expectation to grow their business up to a size of about 20 to 25 employees.
Prediction
Overall, the above arguments suggest that the motivation, the ability, and the opportunity to become a job creator are closely related to the cultural industry in which the entrepreneur operates. The tremendous challenges in actually achieving growth if it is so desired furthermore indicates that none of the three factors in isolation are sufficient to achieve job creation, although jointly they may be close to necessary (Stam et al. Citation2012). It seems that many cultural entrepreneurs face significant challenges, compared to entrepreneurs outside the cultural industries, to create jobs. In turn, cultural entrepreneurs may be especially likely not to have any expectations that they are going to create jobs in the near future.
Within the cultural sector, cultural entrepreneurs in the core, content producing industries have been argued to often lack the motivation, the ability, as well as the opportunity to create jobs, such that entrepreneurs in these industries are especially unlikely to expect to become job creators. At the same time, entrepreneurs in the wider cultural industries, where mass production and reproduction takes place, are expected to have greater expectations of becoming job creators than those in the core industries. In the most peripheral industries, home to, for example, advertising and architecture, we expect that entrepreneurs will also exhibit significant job creation expectations compared to entrepreneurs in the core cultural industries, given their market-dominated ideology combined with relatively abundant opportunities for job creation (Hill and Johnson Citation2003, Stam et al. Citation2008).
Methods
Data
We make use of data obtained from the Adult Population Survey of the Global Entrepreneurship Monitor (GEM) for the years 2003 up to and including 2011. Primary data are collected every year through representative and random sampling of the adult population by national teams, with data then aggregated, validated, and harmonized by the GEM Data Team. A major advantage of the GEM over other data sources is that sampling is not based on economic sectors in advance, such that entrepreneurial activity outside typical growth industries is also included, thus enabling us to access unique, micro-level data and to circumvent the typical problems regarding information collection in studies of the cultural industries. As every yearly cross-section is random and representative, we aggregate the available years into a single data-set.
Our sample consists of 30 countries classified as innovation-driven economies by the Global Competitiveness Report, as the dynamics underlying cultural industries may be fundamentally different in transitional or factor-driven countries (UNESCO/UNDP Citation2013).Footnote 1 The GEM team defines someone to be an early-stage entrepreneur when s/he is either actively involved in setting up a business s/he will own or co-own, or if s/he is currently owning and managing a business that has paid salaries, wages, or any other payments to the owners for more than three months, but not more than 42 months (Singer et al. Citation2015). Within the context of the cultural industries, this implies that a wide variety of activities are included among early-stage entrepreneurs. For example, street musicians would be classified as early-stage entrepreneurs if they have received some form of compensation for their performances but have not been active in this form for more than three years. Similarly, self-employed directors or actors selling their services to movie companies on a non-exclusive basis would be classified as entrepreneurs.
Dealing with outliersFootnote 2 and missing data through list-wise deletion results in 16,205 respondents, of which 1258 (7.76%) are allocated to the cultural industries (discussed below). Our sample appears to represent the overall population well: for example, 9.5% of our respondents from the United Kingdom operate in the cultural industries, while 7.3% of organizations in 2008 in the same country were estimated to belong to the cultural industries – a conservative estimate as the register used by the DCMS did not encompass all small enterprises (DCMS Citation2009, p. 2).
Variables
Dependent variable: expectations of becoming a job creator
Our data enable us to distinguish between three types of entrepreneurs based on the expected decrease or increase in the number of employees hired by the respondent’s venture in 5 years’ time, including exclusive subcontractors that only work for the venture. Our dependent variable therefore takes on three mutually exclusive values: −1 if the respondent expects to decrease the number of employees (i.e. expects to be a job destructor), 0 if the respondent expects no change in the number of employees (i.e. expects to be a job maintainer), and 1 if the respondent expects to increase the number of employees (i.e. expects to become a job creator). Although our focus is on expectations of becoming a job creator, we therefore also explore whether entrepreneurs differ in their expectations of destroying jobs.
Explanatory variables: the cultural industries
To compare entrepreneurs in the cultural industries with those elsewhere, we first include a measure of whether the entrepreneur indicated that s/he belonged to one of the cultural industries or not, delineating the cultural industries based on Throsby (Citation2008b) as well as other similar delineations of the cultural industries (e.g. DCMS Citation2001, CBS Citation2013). Allocation is based on the reported four-digit International Standard Industry Classification (ISIC) of the venture. For the years 2003–2008, the ISIC version 3.1 was used by the GEM Team; for the years 2009–2011, the ISIC version 4 was employed.
To compare the various sub-sectors of the cultural industries, we continue by decomposing this general measure and allocate each industry into one of five categories: the core creative arts, other core cultural industries, the wider cultural industries, the related industries, and the non-cultural industries. Although precise allocation into each circle is ‘essentially ad hoc’ (Throsby Citation2010, p. 92), we conform our allocation as closely as possible to the original delineation by Throsby (Citation2001, Citation2008a). In cases where there was doubt, we referred to other delineations of the cultural industries that utilize standard industry classifications. By including these five categorical dummies in our model, taking the non-cultural industries as our baseline category, we are able to fully flexibly compare expectations regarding job creation between each of the sub-areas of the cultural industries. Table contains a complete overview of the industries allotted to each of the circles.
Table 1. Overview of the cultural industries in the GEM.
Control variables
We control for a variety of (self-reported) entrepreneur- and venture-level variables that have been shown to systematically differ for participants in the cultural industries (see, e.g. Kretschmer et al. Citation1999, DCMS Citation2015) while simultaneously impacting job creation expectations (see, e.g. Kolvereid Citation1992, Stam et al. Citation2012). First, we control for the current number of employees of the venture, including exclusive subcontractors that work only for the venture. Because this variable is highly skewed and home to many zeroes, we transform the variable using a cube-root transformation (i.e. employees 1/3; cf. Cox Citation2011). Our findings are unchanged when using the mathematically similar log-transformation (available upon request).
We control for the owner-manager team size of the venture, including the respondent, and its square to account for possible non-linear effects of team size (e.g. Hackman Citation1990, Guzzo Citation1996). Furthermore, we add an indicator of whether the respondent is a freelancer (is the sole owner of a venture without employees) as such entrepreneurs may be unlikely to create any new jobs and, by definition, cannot destroy any jobs. We also control for export intensity with a measure that takes on the values 1 (‘no export’) to 7 (‘export > 90%’), because exporting is positively related to employment growth aspirations (Kolvereid Citation1992) and ventures in the cultural industries are often more export-intensive (DCMS Citation2015). Furthermore, we control for whether or not the respondent’s products or services utilize new technology, and imply offering a new product, because such innovations may drive venture growth (Thornhill Citation2006). We also introduce a categorical measure of perceived competition (none, some, or strong), as well as an indicator of whether the venture was opportunity-driven rather than necessity-driven. Moreover, we control for the age as well as the gender of the respondent (1 if the respondent is female; 0 if the respondent is male).
In addition to the above, we include indicators of whether or not: (a) the respondent knows an entrepreneur (someone who started a business in the last two years); (b) sees business opportunities; (c) is confident that s/he has the required skills for starting a new venture; and (d) has a fear of failure in starting a new business. We also control for the respondent’s attained education (ranging from zero for no education to four for graduate experience), as positive relationships between employment growth stemming from the cultural industries often disappear once human capital variables are introduced (Glaeser Citation2005, Polese Citation2012). Finally, we include year dummies, where 2003 functions as the baseline, and country dummies, with the United States as the baseline category, to account for systematic temporal and country-based variation.
Analyses
The ordinal and limited nature of our dependent variable implies that conventional ordinary least squares regression techniques are inappropriate. Basing our choice on a Brant test, we perform generalized ordinal logistic regression to estimate the probabilities that the entrepreneur reports expectations of being either a job destructor, job maintainer, or job creator (see, Williams Citation2006 for a more in-depth discussion of this method). Throughout our analyses, we report robust standard errors. To test and interpret our expectations, we follow recommendations by Wiersema and Bowen (Citation2009), and compute and compare probabilities of belonging to any of the three outcome categories while holding continuous variables at their means and all categorical variables at their medians to ensure relatively meaningful values and to explore and substantively interpret differences between the sub-sectors of the cultural industries (our results are entirely robust to the use of other values, such as averages only; available upon request).Footnote 3
Results
Table shows descriptive statistics for our sample. About 4% of our sample reports that they expect to decrease the number of employees hired in the next 5 years, such that they are classified as job destructors, whereas 49% indicate that they expect to maintain the same number of employees and about 46% of the total sample indicate that they expect to become job creators. The bottom two rows of Table illustrate differences for all our variables for the cultural industries and the non-cultural industries. Consistent with our expectations, we find that entrepreneurs in the cultural industries frequently differ from those outside the cultural industries in terms of our control variables (space constraints prevent a full discussion of these differences).
Table 2. Descriptive statistics.
Table shows the results of our generalized ordered logistic regression. Starting with Model 1, it is clear that operating in the cultural industries has no significant influence on the probability that the entrepreneur expects to destroy jobs, based on the coefficient in column a. However, based on the coefficients in columns a and b, we find a marginally significant difference (p = 0.070) between the cultural industries and the other industries, with cultural entrepreneurs having 6.5% greater expectations to be job maintainers (probabilities of 0.493 vs. 0.463). Furthermore, we find that entrepreneurs in the cultural industries have a 7.3% lower probability of having job creation expectations compared to entrepreneurs elsewhere (0.433 vs. 0.467, difference significant at p = 0.027). Thus, cultural entrepreneurs are less likely to expect to become a job creator and more likely to expect to be job maintainers than other entrepreneurs.
Table 3. Results of generalized ordered logistic regression.
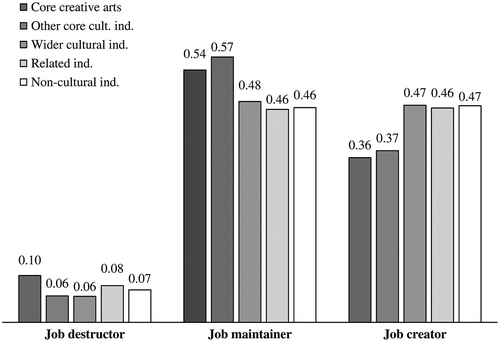
Our dummy variables for the various sub-sectors of the cultural industries are inserted into Model 2. Based on the coefficients of Models 2a and 2b, Figure contains predicted probabilities of belonging to the three outcome categories for the five categories. As before, we identify no significant differences in the probability that the respondent expects to become a job destructor. However, a clear divide arises when assessing predicted probabilities that the respondent indicates an expectation of becoming a job maintainer or a job creator. For instance, entrepreneurs in the core creative arts are 17.4% more likely than those in the related industries as well as in the non-cultural industries to expect to maintain the same number of jobs (p = 0.075 and p = 0.050, respectively), while those in the other core cultural industries are 23.9% more likely than those in the non-core cultural industries to have such expectations (p = 0.061) compared to those in the related and in the non-cultural industries (p = 0.021 and p = 0.010, respectively). At the same time, entrepreneurs in the core creative arts and the other core cultural industries do not significantly differ from one another (p = 0.626). We find a similar pattern when observing expectations to become a job creator, where entrepreneurs in the two most core cultural industries have distinctly lower expectations to create jobs than those the wider and related cultural industries as well as those in the non-cultural industries. At the same time, entrepreneurs in the two most peripheral circles never differ from entrepreneurs in the non-cultural industries.
Figure 2. Probabilities of expectations to become a job destructor, job maintainer, or job creator, based on Model 2
Building on this divide between the core and other core cultural industries, on the one hand, and the wider and the related cultural industries as well as the non-cultural industries, on the other hand, we continue by aggregating the five categories into three groups: the core cultural industries (containing the core creative arts and the other core industries), the non-core cultural industries (including the wider cultural industries and the related industries), and non-cultural industries. We introduce this new measure in Model 3, again taking the non-cultural industries as our baseline category. Figure illustrates predicted probabilities of expectations to become job destructors, job maintainers, and job creators for each of the three newly created categories based on the coefficients from Model 3.
Figure 3. Probabilities of expectations to become a job destructor, job maintainer, or job creator, based on Model 3
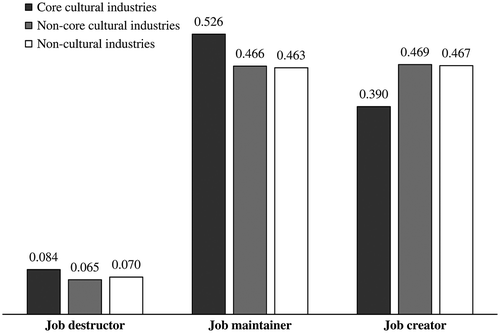
We again do not identify any differences between the three categories in their probabilities to expect job destruction, while we again observe differences in probabilities of expecting to maintain the same number of jobs: entrepreneurs in the core cultural industries are 12.9% more likely than those in the non-core cultural industries to have such expectations (p = 0.061), and 13.6% more likely than those in non-cultural industries to expect to maintain their number of employees (p = 0.010). Furthermore, we find that entrepreneurs in the core cultural industries are 16.8% less likely than entrepreneurs in the non-core cultural industries to expect to become job creators (p = 0.007) and 16.5% less likely than those in non-cultural industries (p = 0.001). Finally, we find that entrepreneurs in the non-core cultural industries are never different from entrepreneurs that do not operate within the cultural industries (all comparisons p > 0.70).
Conclusion and directions for future research
Recognizing the importance of cultural entrepreneurs as a possible locus of job creation in the cultural industries, the central research question underlying this paper is how and why cultural entrepreneurs’ expectations of becoming job creators differ based on the cultural industry in which their ventures operate. We theorize that entrepreneurs in the cultural industries in general have lower probabilities of expecting to become job creators in the future vis-à-vis their non-cultural counterparts, finding support for this expectation as cultural entrepreneurs are found to distinguish themselves in their expectations of maintaining the same number of employees in the years to come. This finding, therefore, is in contrast to the typical policy view of the cultural industries as a major source of job creation.
We further decompose this effect by combining the concentric circles model of the cultural industries (e.g. Throsby Citation2008a) with a production systems view (e.g. Pratt Citation1997), finding strong evidence that industry location is closely related to job creation expectations in the cultural industries. On the one hand, entrepreneurs in core cultural industries such as the visual and performing arts are found to be more likely to have job maintenance expectations and less likely to have job creation expectations than entrepreneurs in the non-core cultural industries, such as advertising and publishing, as well as than those in the non-cultural industries. On the other hand, entrepreneurs in the non-core cultural industries never differ from those in the non-cultural industries. Through this finding, we contribute to the recent discussion on the distinctiveness and definition of the cultural industries (Throsby Citation2008b, Banks and O’Connor Citation2009) as we find that the non-core cultural industries, at times seen as only tenuously belonging to the cultural industries, are identical in their job creation expectations from non-cultural industries. What is more, it seems that these non-core cultural industries may be most likely to take on the role of job creator within the cultural industries.
What may explain this dichotomy? At the heart of this issue seems to be the distinction between self-driven creativity in the core cultural industries and applied creativity in the non-core industries.Footnote 4 Recently, Preston and Sparviero (Citation2009) have demonstrated that content-creating industries in the media sector are stagnant in nature, such that labor productivity only sporadically increases, whereas content-distribution and -exhibition industries are progressive, such that technological developments and innovations frequently increase labor productivity. These differences are driven by the amount of creative labor used in these industries which is high in content-creating industries and low in content-distribution and -exhibition industries (Preston and Sparviero Citation2009). Given that the proportion of creative labor is greater in the core cultural industries than in the non-core cultural industries (Throsby Citation2008a), perhaps the core cultural industries as a whole may be classified as stagnant, whereas the non-core cultural industries may be classified as progressive. Additional work is required to explore and explain this dichotomy within the cultural industries, perhaps by building on the rich literature on the cost disease and its societal implications (Baumol and Bowen Citation1965, Baumol Citation1993, Preston and Sparviero Citation2009).
Our findings have important implications for policy-makers who aim to stimulate sustainable growth in employment in the cultural industries, and suggest that policy aimed at employment growth in the cultural industries should perhaps focus on identifying and stimulating the subset of entrepreneurs with growth potential. There appear to be surprisingly many candidates for such support: our models indicate that even in the core cultural industries, 39% of entrepreneurs in the industries indicate an expectation to grow – a sizeable number, especially in light of the various dampening factors suggested in this paper. What characteristics do these cultural entrepreneurs have such that they overcome these factors? Post-hoc analyses on only cultural entrepreneurs suggest they have specific features when compared to their peers: they tend to already have hired several individuals during their young existence, have an owner-manager team of about five individuals, are opportunity-driven while also seeing business opportunities in the future, are younger, and feel that they have the required skills to be an entrepreneur. Taken together, these findings paint a picture of a self-confident cultural entrepreneur, seemingly able to overcome the various hindering factors to job creation through the identification and exploitation of promising business opportunities.
In light of these findings, what can policy interested in stimulating job creation through growth in the cultural industries do? We see three clear suggestions for policy arising from our findings. First, policy-makers can focus on identifying and stimulating those cultural entrepreneurs that seem to be both willing and able to grow. As discussed above, one strong indicator for such willingness and ability is whether the entrepreneur has already hired other employees. This suggestion is very much in line with a recent call for policy makers to focus on the subset of businesses with growth potential, rather than stimulating the formation of start-ups in general, as the typical start-up will not generate new jobs in its lifetime (Shane Citation2009). While increasing government support in the cultural industries may seem at odds with the recent trend towards reduced government investment in these industries in terms of subsidies and work grants, it certainly seems worthwhile for future research to address how cultural entrepreneurs with growth potential may be more precisely identified and stimulated. A recent stream of literature on the ‘ambitious entrepreneur’ (Stam et al. Citation2012, Hermans et al. Citation2015; van Witteloostuijn et al. Citation2015) provides some further guidelines in this regard.
A second possibility is to provide support and training to increase cultural entrepreneurs’ self-confidence and capabilities to achieve growth through, for example, training and seminars.Footnote 5 Indeed, recent work studying cultural entrepreneurs indicates that ‘most do not have management as either a core task or core competency’ (Jeffcutt and Pratt Citation2002, p. 229), and that cultural entrepreneurs used bank loans and overdrafts at much lower rates than small businesses in general even though refusal rates were similar (Wilson and Stokes Citation2005). Providing training and seminars to cultural entrepreneurs who indicate an interest in growing their ventures may offer policy-makers a tool to support and further develop new job creators that may at present not have the ability or opportunity to do so. A challenge for future work lies in developing a training program for cultural entrepreneurs that not only improves entrepreneurs’ abilities in various economic areas, but in so doing also fosters and perhaps even liberates rather than constrains the cultural entrepreneur in producing cultural value.
Third, in line with research on the role of agglomeration and clustering in the creative field (e.g. Scott Citation1999, Citation2006, Storper and Scott Citation2009), it can be fruitful to stimulate opportunities for cultural entrepreneurs to co-locate their ventures without necessarily hiring employees. Much cultural work occurs in a decentralized, highly networked manner, and such agglomeration may very well foster growth in self-employed cultural workers. In turn, such growth may result in a self-reinforcing growth trajectory for these agglomerations that could result in growth in total employment, though not necessarily in growth in average venture size. Furthermore, it is possible that such an increase in the number of cultural ventures could foster job creation through its indirect effects on other cultural and non-cultural activities (though the causal mechanisms underlying such a relationship are still up for debate; see e.g. Glaeser Citation2005).
There lies an inherent challenge for cultural-policy makers not to lose sight of the cultural side of the cultural policy (Throsby and Zednik Citation2011). Certainly, though our recommendations and general focus may be argued to be rather economic in focus, we feel that such a focus is a necessary first step in coming to a better understanding of the cultural industries and what their exact nature in this area is (see also Hesmondhalgh and Pratt Citation2005). Certainly, an interest in stimulating job creation within the cultural industries is only one of many aspects of cultural policy-making that need to be taken into account. We hope that our broad theoretical approach and empirical findings may act as an initial step towards more precise and sophisticated cultural policy that is able to balance the unique cultural aspects of the cultural industries with informed economic policy. Indeed, recent work has posed that cultural policy will need to not only increasingly acknowledge the existence of the market, but also become actively involved in the shaping of this market (Pratt Citation2005).
Though motivation, ability, and opportunity are jointly required to create jobs, it is important for future research to identify what exactly drives the differences in growth expectations within the cultural industries, as they have widely differing implications for policy aimed at promoting growth. For instance, if cultural entrepreneurs are not motivated to create jobs, especially with the ability to do so, then the cultural industries may be home to unrealized potential and unproductive or even destructive entrepreneurship (Baumol Citation1996). Then, policy-makers should focus on stimulating those entrepreneurs who are actually willing to create jobs if the opportunity presents itself. On the other hand, if it is fundamentally an issue of inability or lack of opportunities – for example, because cultural entrepreneurs are constrained in financing (Banks et al. Citation2000, Wiesand and Söndermann Citation2005) – then policy needs to first and foremost focus on reducing these constraints to growth for cultural entrepreneurs.
As any study, ours has a number of limitations that offer opportunities for future research. First, our theoretical focus has been exclusively on the group of small, young entrepreneurial ventures within the cultural industries. Although numerically dominant, these ventures typically do not set the rules of engagement within the cultural industries. Rather, they are often strongly dependent on a group that has remained outside the scope of our present research: the so-called ‘majors’ (Scott Citation1999), few in numbers but strong in power. It is unlikely that our theoretical model extends to this group of large corporations, as they differ fundamentally in their operations and strategies. Future work therefore stands to gain by a consideration of the job creation potential of these important players in the cultural industries, the channels through which cultural policy may influence these majors, as well as a further consideration of the manners through which these corporations affect the job creation potential of the smaller cultural entrepreneurs.
Moreover, we cannot observe what type of jobs those cultural entrepreneurs who do expect to become job creators expect to create. Further research is needed to assess whether these cultural entrepreneurs expect to hire creative labor or whether they intend to employ ‘humdrum’ workers (Caves Citation2000), as the cultural industries have been posed to potentially absorb labor released form declining sectors of the economy (Throsby Citation2001). Though non-artistic skills and occupations play a crucial role in the sustenance of the cultural industries (Pratt Citation1997), if jobs created by entrepreneurs in the cultural industries are largely of a creative nature, however, then it is unlikely that labor released in non-cultural sectors of the economy will actually be absorbed by job creators in the cultural industries.
Finally, we focus on a single outcome: expectations of becoming job creators. Our recommendations need to be evaluated taking this focus into consideration, and one may suggest that these expectations are only marginally related to realized job creation. The fact that cultural entrepreneurs are particularly distinct in their expectations of not becoming job creators, however, suggests that these expectations will likely become a reality. Future research may explore to what extent the observed patterns are exhibited when focusing on other outcomes, such as export intensity and innovativeness – outcomes in which the cultural industries may excel (UNESCO/UNDP Citation2013, DCMS Citation2015), and whether the concentric circles model may be of use in exploring these patterns. Certainly, the fact that we still do not fully understand many of the economic dimensions underlying the cultural industries (Lampel et al. Citation2000, Hesmondhalgh and Pratt Citation2005, Klamer Citation2011) suggests that a further understanding of the drivers behind their growth are still desired.
Disclosure statement
No potential conflict of interest was reported by the authors.
Notes
1. The countries are: Australia; Austria; Belgium; Canada; Czech Republic; Denmark; Finland; France; Germany; Greece; Hong Kong; Iceland; Ireland; Israel; Italy; Japan; the Netherlands; New Zealand; Norway; Portugal; Singapore; Slovenia; South-Korea; Spain; Sweden; Switzerland; Taiwan; Trinidad & Tobago; United Kingdom; United States. In robustness checks, we assessed to what extent our findings may be region-specific (based on region delineations by the United Nations). These checks consistently indicate that our findings are not region-specific. These checks are available upon request.
2. We calculate the expected percentage growth (job creation expectations divided by the current number of employees and owners) and remove those in the top 1% of the distribution. Similarly, we exclude ventures in the top 1% of the size distribution. All results are robust to the inclusion of these outliers (available upon request).
3. Probabilities that the outcome will take on either the value −1, 0, or 1 are computed as: ;
; and
, respectively. That is, in computing the probability that the respondent expects to become a job destructor, only the coefficients denoted as α
a and β
a above are used; for the probability that the respondent expects to become a job creator only the coefficients denoted as α
b and β
b are used. Both sets of coefficients are used for the probability that the respondent expects to become a job maintainer.
4. We take applied creativity to be both the application of others’ creativity, as in the publishing industry, and the application of one’s own creativity to the demand of others, as in the advertising industry.
5. We thank an anonymous reviewer for this suggestion.
Related Research Data
References
- Abecassis-Moedas, C. , et al. , 2012. Key resources and internationalization modes of creative knowledge-intensive business services: the case of design consultancies. Creativity and innovation management , 21 (3), 315–331. doi:10.1111/j.1467-8691.2012.00646.x.
- Abfalter, D. , 2013. Authenticity and respect: leading creative teams in the performing arts. Creativity and innovation management , 22 (3), 295–306. doi:10.1111/caim.12004.
- Bakhshi, H. and Windsor, G. , 2015. The creative economy and the future of employment . London: Nesta.
- Banks, M. and O’Connor, J. , 2009. After the creative industries. International journal of cultural policy , 15 (4), 365–373. doi:10.1080/10286630902989027.
- Banks, M. , et al. , 2000. Risk and trust in the cultural industries. Geoforum , 31 (4), 453–464. doi:10.1016/S0016-7185(00)00008-7.
- Baumol, W.J. , 1993. Health care, education and the cost disease: a looming crisis for public choice. Public choice , 77 (1), 17–28. doi:10.1007/BF01049216.
- Baumol, W.J. , 1996. Entrepreneurship: productive, unproductive, and destructive. Journal of Business Venturing , 11 (1), 3–22. doi:10.1016/0883-9026(94)00014-X.
- Baumol, W.J. and Bowen, W.G. , 1965. On the performing arts: the anatomy of their economic problems. The American economic review , 55 (1/2), 495–502.
- Cassar, G. , 2007. Money, money, money? A longitudinal investigation of entrepreneur career reasons, growth preferences and achieved growth. Entrepreneurship & regional development , 19 (1), 89–107.
- Caves, R.E. , 2000. Creative industries: contracts between art and commerce . Cambridge, MA: Harvard University Press.
- CBS , 2013. Monitor Topsectoren – Uitkomsten Eerste Meting [Monitor topsectors – results first measurement]. Heerlen: CBS.
- Coser, L.A. , Kadushin, C. , and Powell, W.W. , 1982. Books: the culture and commerce of publishing . Chicago, IL : University Chicago Press.
- Cox, N.J. , 2011. STATA tip 96: cube roots. The stata journal , 11 (1), 149–154.
- Davidsson, P. , 1989. Entrepreneurship – and after? A study of growth willingness in small firms. Journal of business venturing , 4 (3), 211–226. doi:10.1016/0883-9026(89)90022-0.
- Davidsson, P. , 2005. Researching entrepreneurship . Boston, MA : Springer.
- DCC , 2014. Topsector Creatieve Industrie, Een Tussenbalans [Topsector creative industry, an interim review]. Eindhoven: Dutch Creative Council.
- DCMS , 2001. Creative industries mapping document 2001 . 2nd ed. London: Department for Culture, Media and Sport.
- DCMS , 2009. Creative industries economic estimates (2009) . London: Department for Culture, Media and Sport.
- DCMS , 2014. Creative industries: focus on employment . London: Department for Culture, Media & Sport.
- DCMS , 2015. Creative industries economic estimates – January 2015 . London: Department for Culture, Media & Sport.
- Eikhof, D.R. and Haunschild, A. , 2007. For art’s sake! Artistic and economic logics in creative production. Journal of organizational behavior , 28 (5), 523–538. doi:10.1002/job.462.
- Ellmeier, A. , 2003. Cultural entrepreneurialism: on the changing relationship between the arts, culture and employment. International journal of cultural policy , 9 (1), 3–16. doi:10.1080/1028663032000069158a.
- EY , 2014. Creating growth: measuring cultural and creative markets in the EU . Paris : EY.
- Glaeser, E. , 2005. Review of Richard Florida’s the rise of the creative class. Regional science and urban economics , 35 (5), 593–596.
- Guzzo, R.A. , 1996. Fundamental considerations about work groups. In: M.A. West , ed. Handbook of work group psychology . Chichester: John Wiley, 3–24.
- Hackman, J.R. , 1990. Groups that work (and those that don’t): creating conditions for effective teamwork . San Francisco, CA: Jossey-Bass.
- Hermans, J. , et al. , 2015. Ambitious entrepreneurship: a review of aspirations, intentions, expectations, and growth. In: A.C. Corbett , J. Katz , and A. McKelvie eds, Firm emergence and growth: advances in entrepreneurship. Vol. 17. Bingley: Emerald, 127–160.
- Hesmondhalgh, D. , 2002. The cultural industries . London: Sage.
- Hesmondhalgh, D. and Pratt, A.C. , 2005. Cultural industries and cultural policy. International journal of cultural policy , 11 (1), 1–13. doi:10.1080/10286630500067598.
- Hill, R. and Johnson, L.W. , 2003. When creativity is a must: professional ‘applied creative’ services. Creativity and innovation management , 12 (4), 221–229. doi:10.1111/j.0963-1690.2003.00285.x.
- Hirsch, P.M. , 1972. Processing fads and fashions: an organization-set analysis of cultural industry systems. American journal of sociology , 77 (4), 639–659.10.1086/ajs.1972.77.issue-4
- Jeffcutt, P. and Pratt, A.C. , 2002. Managing creativity in the cultural industries. Creativity and innovation management , 11 (4), 225–233. doi:10.1111/1467-8691.00254.
- Klamer, A. , 2011. Cultural entrepreneurship. The review of Austrian economics , 24 (2), 141–156. doi:10.1007/s11138-011-0144-6.
- Kolvereid, L. , 1992. Growth aspirations among Norwegian entrepreneurs. Journal of business venturing , 7 (3), 209–222. doi:10.1016/0883-9026(92)90027-O.
- Kretschmer, M. , Klimis, G.M. , and Choi, C.J. , 1999. Increasing returns and social contagion in cultural industries. British journal of management , 10 (s1), 61–72. doi:10.1111/1467-8551.10.s1.6.
- Lampel, J. , Lant, T. , and Shamsie, J. , 2000. Balancing act: learning from organizing practices in cultural industries. Organization science , 11 (3), 263–269. doi:10.1287/orsc.11.3.263.12503.
- Leadbeater, C. , 1999. Living on thin air . London: Penguin Group.
- Mumford, M.D. , et al. , 2002. Leading creative people: orchestrating expertise and relationships. The leadership quarterly , 13 (6), 705–750. doi:10.1016/S1048-9843(02)00158-3.
- NESTA , 2006. Creating growth: how the UK can develop world class creative businesses . London: Nesta.
- Paige, R.C. and Littrell, M.A. , 2002. Craft retailers’ criteria for success and associated business strategies. Journal of small business management , 40 (4), 314–331. doi:10.1111/1540-627X.00060.
- Polese, M. , 2012. The arts and local economic development: can a strong arts presence uplift local economies? A study of 135 Canadian cities. Urban studies , 49 (8), 1811–1835. doi:10.1177/0042098011422574.
- Pratt, A.C. , 1997. The cultural industries production system: a case study of employment change in Britain, 1984–91. Environment and planning A , 29 (11), 1953–1974. doi:10.1068/a291953.
- Pratt, A.C. , 2005. Cultural industries and public policy. International journal of cultural policy , 11 (1), 31–44. doi:10.1080/10286630500067739.
- Pratt, A.C. , 2006. Advertising and creativity, a governance approach: a case study of creative agencies in London. Environment and planning A , 38 (10), 1883–1899. doi:10.1068/a38261.
- Preston, P. and Sparviero, S. , 2009. Creative inputs as the cause of baumol’s cost disease: the example of media services. Journal of media economics , 22 (4), 239–252. Taylor & FrancisGroup. doi:10.1080/08997760903375910.
- Ross, A. , 2008. The new geography of work: power to the precarious? Theory, culture & society , 25 (7–8), 31–49. doi:10.1177/0263276408097795.
- Rutten, P. , et al. , 2004. De Creatieve Industrie in Amsterdam En de Regio [The creative industry in Amsterdam and the region]. Leiden/Delft: TNO.
- Scott, A.J. , 1999. The cultural economy: geography and the creative field. Media, culture & society , 21 (6), 807–817. doi:10.1177/016344399021006006.
- Scott, A.J. , 2002. A new map of hollywood: the production and distribution of American motion pictures. Regional studies , 36 (9), 957–975. doi:10.1080/0034340022000022215.
- Scott, A.J. , 2006. Entrepreneurship, innovation and industrial development: geography and the creative field revisited. Small business economics , 26 (1), 1–24. doi:10.1007/s11187-004-6493-9.
- Shane, S. , 2009. Why encouraging more people to become entrepreneurs is bad public policy. Small business economics , 33 (2), 141–149. doi:10.1007/s11187-009-9215-5.
- Singer, S. , Amorós, J.E. , and Arreola, D.M. , 2015. Global entrepreneurship monitor: 2014 global report . London: Global Entrepreneurship Research Association (GERA).
- Stam, E. , et al. , 2012. Ambitious entrepreneurship: a review of the academic literature and new directions for public policy . The Hague: Advisory Council for Science and Technology Policy (AWT).
- Stam, E. , De Jong, J.P.J. , and Marlet, G. , 2008. Creative industries in the Netherlands: structure, development, innovativeness and effects on urban growth. Geografiska Annaler: series B, human geography , 90 (2), 119–132. doi:10.1111/j.1468-0467.2008.00282.x.
- Stinchcombe, A. , 1959. Bureaucratic and craft administration of production: a comparative study. Administrative science quarterly , 4 (2), 168–187. doi:10.2307/2390676.
- Storper, M. and Scott, A.J. , 2009. Rethinking human capital, creativity and urban growth. Journal of economic geography , 9 (2), 147–167. doi:10.1093/jeg/lbn052.
- Sunley, P. , Pinch, S. , and Macmillen, J. , 2010. Growing design? Challenges and constraints facing design consultancies in three English city-regions. Regional studies , 44 (7), 873–887.10.1080/00343401003604671
- Thornhill, S. , 2006. Knowledge, innovation and firm performance in high- and low-technology regimes. Journal of business venturing , 21 (5), 687–703. doi:10.1016/j.jbusvent.2005.06.001.
- Thornton, P.H. , 2002. The rise of the corporation in a craft industry: conflict and conformity in institutional logics. Academy of management journal , 45 (1), 81–101.10.2307/3069286
- Throsby, D. , 2001. Economics and culture . Cambridge: Cambridge University Press.
- Throsby, D. , 2008a. The concentric circles model of the cultural industries. Cultural trends , 17 (3), 147–164. doi:10.1080/09548960802361951.
- Throsby, D. , 2008b. Modelling the cultural industries. International journal of cultural policy , 14 (3), 217–232. doi:10.1080/10286630802281772.
- Throsby, D. , 2010. The economics of cultural policy . Cambridge: Cambridge University Press.10.1017/CBO9780511845253
- Throsby, D. and Zednik, A. , 2011. Multiple job-holding and artistic careers: some empirical evidence. Cultural trends , 20 (1), 9–24. doi:10.1080/09548963.2011.540809.
- Townley, B. , Beech, N. , and McKinlay, A. , 2009. Managing in the creative industries: managing the motley crew. Human relations , 62 (7), 939–962. doi:10.1177/0018726709335542.
- Tschang, F.T. , 2007. Balancing the tensions between rationalization and creativity in the video games industry. Organization science , 18 (6), 989–1005. doi:10.1287/orsc.1070.0299.
- UNESCO/UNDP , 2013. Creative economy report 2013: widening local development pathways . New York : United Nations.
- Wiersema, M.F. and Bowen, H.P. , 2009. The use of limited dependent variable techniques in strategy reseach: issues and methods. Strategic management journal , 30, 679–692. doi:10.1002/smj.758.
- Wiesand, A. and Söndermann, M. , 2005. The “creative sector” – an engine for diversity, growth and jobs in Europe. An overview of research findings and debates prepared for the European cultural foundation . Amsterdam: European Cultural Foundation.
- Wiklund, J. and Shepherd, D. , 2003. Aspiring for, and achieving growth: the moderating role of resources and opportunities. Journal of management studies , 40 (8), 1919–1941. doi:10.1046/j.1467-6486.2003.00406.x.
- Williams, R. , 2006. Generalized ordered logit/partial proportional odds models for ordinal dependent variables. Stata journal , 6 (1), 58–82. StataCorp LP
- Wilson, N.C. and Stokes, D. , 2005. Managing creativity and innovation: the challenge for cultural entrepreneurs. Journal of small business and enterprise development , 12 (3), 366–378. doi:10.1108/14626000510612286.
- Van Witteloostuijn, A. , et al. , 2015. Fitting entrepreneurial, firm-level and environmental contingencies for better performance: a study into the complex world of entrepreneurship within Belgium . Brussels: Provo.