
 ?Mathematical formulae have been encoded as MathML and are displayed in this HTML version using MathJax in order to improve their display. Uncheck the box to turn MathJax off. This feature requires Javascript. Click on a formula to zoom.
Abstract
The use of corporate websites as communication medium may contribute to good governance and specifically transparency as one of the basic principles of governance, mitigating the effect of the agency problem. The primary objective of this study was to ascertain the link between voluntary corporate website disclosure and information asymmetry for the smallest JSE-listed companies. Rule 26, as issued by the LSE for its AIM-listed companies, was used as proxy for disclosure while the bid-ask spread stood as a proxy for information asymmetry. The results of a content analysis showed that the majority of smaller listed JSE companies are not on par with their UK counterparts. Using agency theory, it was argued that if information voluntarily disclosed by companies on their corporate websites is useful to investors, it should theoretically decrease information asymmetry. Although empirical evidence of a negative relationship between disclosure and the bid-ask spread was found, the relationship changed to not significant once controlled for market capitalisation. Besides the bid-ask spread, the association between disclosure and both share price volatility and share turnover (both as alternative proxies for information asymmetry) was tested, and both were found non-significantly related to disclosure. The results reported do suggest that the Rule 26 minimum corporate website disclosures may not be sufficient in persuading investors to change their trading behaviour. Although there has been no research on the voluntary compliance and effect of Rule 26 website disclosure on information asymmetry using JSE small-cap data, a major limitation of this study is that generalisation of results is limited to small listed companies.
1. Introduction
While annual report content is regulated by various standards, Acts and codes, companies’ decision to use corporate websites as alternative and/or supplementary information source is entirely unregulated in South Africa (i.e. Johannesburg Stock Exchange (JSE)-listed companies). This is also the case in most other countries and stock exchanges. One exception is Rule 26, as issued by the London Stock Exchange (LSE), prescribing the publication of specific information items on the corporate websites of companies listed on the LSE Alternative Investment Market (AIM).
The central argument around the Technology Acceptance ModelFootnote1 (Davis, Citation1989) is that two beliefs underlie companies’ and investors’ use of corporate websites, namely perceived usefulness and perceived ease of use. The aim of this study was twofold: to explore whether JSE-listed companies comply with Rule 26 requirements, and whether such disclosure is linked to information asymmetry (i.e. perceived usefulness). This study relied on the bid-ask spread as proxy for information asymmetry (Ajina, Sougne, & Lakhal, Citation2015; Chang, D’Anna, Watson, & Wee, Citation2008; Gajewski & Li, Citation2015).
Some of the popular theories used in the extant literature to explain companies’ rationale for engaging in any voluntary disclosures (e.g. corporate website disclosure) are agency theory (Esterhuyse & Wingard, Citation2016), signalling theory (Hetze & Winistörfer, Citation2016), legitimacy theory (Patten & Crampton, Citation2003) and isomorphism (Bananuka, Citation2019). While we accept these theories, we argue that agency theory is the most appropriate theory for our context as this study was based on the premise that voluntary corporate website disclosures may reduce information asymmetry, where information asymmetry is one possible negative consequence of the conflicting incentives caused by the separation of ownership and control.
King IV encourages the board of directors of a JSE-listed company to oversee that the company encourages proactive engagement with stakeholders (Institute of Directors, Citation2016). In the aftermath of recent corporate collapses and scandals, maintaining and building trust has never been more important for companies than today. Transparent communication of information plays an important role in building trust among stakeholders (Reading, 2015). According to Jones (Citation2009), the rapid increase in the availability of information channels since the advent of the internet has driven users closer to sources directly controlled by the company, such as corporate websites. It is therefore evident that the use of corporate websites as communication medium may contribute to good governance and specifically transparency as one of the basic principles of governance; mitigating the effect of the agency problem.
Although no consensus exists, a substantial body of research suggests measurable advantages associated with voluntary corporate website disclosures (e.g. Da Silva Rodrigues & Galdi, Citation2017; Nel, Smit, & Brümmer, Citation2018; Orens, Aerts, & Cormier, Citation2010). Almost all previous studies used data from developed countries or excluded the smallest listed companies. Notwithstanding the perceived benefits of Rule 26 in the United Kingdom (UK), research by Gray, Radebaugh and Roberts (Citation1990) shows variation between countries in their perceived usefulness of voluntary disclosures. It is further unknown whether companies in one country will base their behaviour on peers in other countries as postulated by mimetic isomorphism (DiMaggio & Powell, Citation1983).
Larger companies do not only disclose more information using a wider variety of communication channels, but also receive better coverage from analysts and the media, compared to their smaller counterparts (Nel, Citation2016). As a result, it is often argued (e.g. Agarwal, Taffler, Bellotti, & Nash, Citation2016; Lodhia, Allam, & Lymer, Citation2004; Merton, Citation1987) that smaller companies should potentially benefit more compared to larger companies from increased disclosure levels. It is also expected that the recent introduction of the Markets in Financial Instruments Directive (MiFID) will intensify the importance of the company as a direct information source for smaller companies (Murphy, Citation2018). Research by Lang and Lundholm (Citation2000) also showed that small companies are more likely to use disclosure as a mechanism to sway investor perceptions. Admitting the research risks associated with using small companies (such as the availability of information, and limited generalisation of the results to the larger listed companies), given the lack of research using small company data and the theoretical advantages of voluntary disclosure for smaller companies, this study examined only the smallest JSE-listed companies.
Keeping in mind that corporate website disclosures have been researched both in South Africa (see e.g. Barac, Citation2004; Esterhuyse, Citation2017; Nel & Baard, Citation2006) and internationally (see e.g. Chang et al., Citation2008; Gajewski & Li, Citation2015; Pirchegger & Wagenhofer, Citation1999; Trabelsi, Labelle, & Dumontier, Citation2008), this study specifically contributes by using small company data and a measurement of attributes based on Rule 26.
The remainder of this paper is organised into the following four sections: first, there is a literature review to position the study theoretically. The next section deals with the methodology, including the development of the measurement instrument used, measurement of the dependent and independent variables, defining the population studied and the research design; this is followed by the research findings and finally the conclusion, including limitations and suggestions for future research, is presented.
2. Theory
Relying on Rule 26 (as issued by the LSE) to measure the use of the corporate website as communication medium, the current study is not concerned with normative theories to explain how the medium should be used, but rather seeks to explain why some companies elect to voluntarily adhere to Rule 26, while others do not (i.e. positive accounting theory).
According to Gray et al. (Citation1990), the amount and type of voluntary disclosure will depend upon the outcome of a cost-benefit assessment. Similarly, Lybaert (Citation2002) argued that companies consider the costs and benefits of using their corporate websites as communication channel in developing an online disclosure strategy. Admitting the practical benefits of using corporate websites as communication medium (Cormier, Ledoux, & Magnan, Citation2009; Smith & Piece, Citation2005), disadvantages may include disorientation (Dillion, Richardson, & McKnight, Citation1990; Debreceny, Gray, & Mock, Citation2001), fusion of audited and unaudited information (Hodge, Citation2001) and information overload (Lybaert, Citation2002).
The investor recognition hypothesis (Merton, Citation1987) postulates that more complete information will increase the visibility of a company, which will result in an increase of the investor base; which may decrease the companies’ cost of equity and increase the market value. As arguably all the attributes mandated by Rule 26 are also available from alternative information sources, it is important to note that according to conventional finance theory there is no justification for expenses that increases company visibility without providing new information relevant to investors in valuing the company in the perfect market setting assumption (Agarwal et al., Citation2016). The current study finds its theoretical base in agency theory and information asymmetry. Agency theory proposes that the modern-day separation of ownership and control results in agency costs as the principals (owners or shareholders) have conflicting incentives with the agents (those who control the company or directors) (Jensen & Meckling, Citation1976). Craven and Marston (Citation1999) suggested that agency theory predicts that voluntary disclosures levels are likely to be influenced by managers’ expectations of the share price effect thereof. Besides conflicting incentives, agency costs are incurred by owners as a result of asymmetric information, i.e. information asymmetry (Deegan, Citation2017).
Agency costs are often categorised as bonding costs, monitoring costs and residual costs. Bonding costs refers to the implementation of systems and structures to ensure that agents act in the best interest of the principal (Jensen & Meckling, Citation1976). In the context of this study, the costs to comply with Rule 26 will constitutes bonding costs. In support thereof, Healy and Palepu (Citation2001), proposed, amongst others, voluntary disclosure as a solution to mitigate agency costs and information asymmetry. Monitoring costs, on the other hand, refer to the costs incurred in monitoring the compliance of companies with Rule 26, while residual costs refer to agency costs not mitigated (Deegan, Citation2017).
Information asymmetry, first described by Akerlof (Citation1970), is the withholding of information by management (who per definition have all information, i.e. private information) from the shareholders (who per definition have no information). According to Xiao, Yang, and Chow (Citation2004), an assumption of agency theory is that shareholders would price-protect themselves against expected expropriations by management; resulting in a widening bid-ask spread.
Brown and Hillegeist (Citation2007) argue that private information (which result in information asymmetry) will lose its value once the information is published,Footnote2 decreasing both the available set of private information as well as the incentives for investors to gather private information or to buy the information from information intermediaries. This study operationalises private information as information that is most probably available in the public domain, but due to cost and/or time constraints, is not easily available to all investors.
Given the argument that voluntary disclosure would increase information asymmetry if dominated by unreliable information communicated to uninformed investors (Ashbaugh, Johnstone, & Warfield, Citation1999) stressing the importance of reliable and useful disclosure, this study seeks to examine whether compliance with Rule 26 will decrease information asymmetry.
Another benefit associated with increased levels of voluntary disclosure in the literature is a decreased cost of equity (e.g. Merton, Citation1987). Using JSE data and a measurement of voluntary disclosure via corporate websites, Nel, Smit and Brümmer (Citation2019) found a significant negative association between corporate website disclosure and the cost of equity.
Economic theory suggests two distinct routes in support of this hypothesis: the liquidity route and the estimation risk route. Both the reduced estimation risk route and the increased market liquidity route are based on a reduction of information asymmetry and therefore agency costs (Botosan & Plumlee, Citation2002).
3. Methodology
3.1 Population
In line with the purpose of the study, the population was defined as the smallest 30% of companies listed on the JSE (and not suspended), on either the main board or AltX as on 31 August 2017. Before selecting the smallest 30%, companies that were either listed less than 18 months on 31 August 2017 or traded for less than 40 days in the preceding six-month cycle,Footnote3 were excluded. The result was 275 companies from which the smallest (based on market capitalisation) 30% were defined as the population. The result was a defined population of 83 companies of which 20 were listed on the AltX and 63 on the main board,Footnote4 as summarised in .
Table 1. Defined population.
Although a sample was not selected and all members of the defined population were examined (i.e. census research method), noteworthy is studies by Cheng, Courtenay, and Krishnamurti (Citation2006) and Nel et al. (Citation2019) that used sample sizes of 23% and 25% respectively.
Without winsorizing, trimming or any form of variable transformation (e.g. log) the median bid-ask spread for the defined population (83 companies) was calculated as 0.053. In a previous study using JSE-listed data, Nel (Citation2016) reported a median bid-ask spread of 0.0065. A comparison of the median market capitalisation (ZAR million) of this study’s defined population (R441) with the Nel study (R6 248), shows some evidence of a negative association between size and the bid-ask spread. Dividing the defined population of 83 into two sub-groups using the median market capitalisation, both the parametric t-test and non-parametric Mann-Whitney report a significant difference at the 1% level between the bid-ask spread (log transformed) for a small company sub-group compared to a large company sub-group. These results provide support for the notion (as discussed in the introduction) that smaller companies may potentially benefit more from voluntary disclosure compared to larger companies, underlining the contribution of this study.
3.2 Measurement of corporate website disclosure levels
Given that Rule 26 (LSE, 2018) was specifically enacted with the ‘smaller’ company in mind, coupled with the current study’s focus on the smallest (in terms of market capitalisation) companies, 30 attributes were identified based on Rule 26 (see Appendix A for a list of these attributes).Footnote5 A further five attributes that could increase the accessibility of available information were measured (variables 31 to 35 in Appendix A).
All attributes were scored as either 0 (not available) or 1 (available). The maximum score that could therefore be obtained by a company was 35. The assignment of either 0 or 1 per attribute did not depend on the importance or the quality of the underlying information, but was merely a measure of availability. The following reasons are offered by studies for not assigning weights to individual attributes in a measurement instrument: to avoid the arbitrariness thereof (Bónson & Escobar, Citation2002), information will be used by various types of users with different needs (Bónson & Escobar, Citation2006), to avoid subjectivity (Froidevaux, Citation2004) and because previous research results have shown that weightings do no significantly alter the results (Bollen, Hassink, & Bozic, Citation2006; Ntim, Citation2013).
Constructing indexes to consolidate a large number of indicators using dummy variables, i.e. 0 or 1, is in line with previous studies that measured disclosure scores (Abdo & Fisher, Citation2007; Ntim, 2009).
3.3 Reliability and validity
Hassan and Marston (Citation2010) define reliability as the ability of a measurement instrument to reproduce consistent results on repeated measurements, and validity as the extent to which the instrument measures what it is intended to measure. This study relied on Cronbach’s alpha, a measure of inter-item correlation, to assess the internal consistency and therefore reliability. Literature suggest a minimum alpha between 0.7 (Nunnally, Citation1978) and 0.8 (Hassan & Marston, Citation2010) as acceptable level.
Regarding validity, construct validity (the extent to which a measure performs in accordance with theoretical expectations) and content or face validity (assessment through third-party judgement) (Hasson & Marston, Citation2010) were used to validate the instrument used. Regarding content or face validity, it was assumed in this study that the LSE is knowledgeable in setting minimum disclosure requirements. As the Cronbach’s alpha and assessment of construct validity are based on the measurement results, both are discussed in section 4.3 only.
3.4 Measurement of information asymmetry – bid-ask spread
As it is not possible to observe information asymmetry directly (Leuz & Verrechia, Citation2000), an appropriate proxy should therefore be used. Information asymmetry lures investors to adjust their bid and ask price to avoid transacting with a more knowledgeable investor (Akerlof, Citation1970; Chang et al., Citation2008). The most prevalent proxy used in the literature to estimate information asymmetry is therefore the bid-ask spread. Of all the variations of the bid-ask spread used in the literature (e.g. quoted or relative, time-weighted relative, effective and depth-adjusted effective spreads), the quoted bid-ask spread is the most popular.
Nel (Citation2016) calculates the bid-ask spread as follows:
, where bid is the highest purchase price and ask the lowest selling price.
For the purpose of this study, the bid-ask spread was calculated as the median daily of the spread over all trading days from 1 September 2017 to 28 February 2018 (this specific period was used as all measurements of corporate website disclosure levels were conducted during this period).
3.5 Use and measurement of control variables
In addition to the corporate website disclosure level, we expect several other variables (i.e. control variables) to be associated with the information asymmetry variable (bid-ask spread) based on a review of the prior literature, namely share price, leverage, directors’ shareholding and block ownership. lists these control variables, their measurement, as well as their expected associations with information asymmetry. All variables were obtained from the IRESS database.
Table 2. Control variables – description and expected associations with information asymmetry.
3.5.1 Share price (
Ajina et al. (Citation2015) argue that share prices will explain liquidity levels based on the microstructure of financial markets. Higher-priced shares generally tend to be less risky than lower-price shares (Hearn & Piesse, Citation2015). Based on results in Chang et al. (Citation2008) and Heflin, Shaw, and Wild (Citation2005), we expect a negative association between share price and the dependent variable, the bid-ask spread.
3.5.2 Leverage (
Higher levels of leverage imply less equity shareholding and more risk, which in turn justifies private information production, resulting in increased information asymmetry levels (Boot & Thakor, Citation1993). Based on results in Orens et al. (Citation2010), we expect a positive association between leverage and the dependent variable, the bid-ask spread.
3.5.3 Director shareholding (
Directors have access to information not freely available to shareholders. Increased levels of directors’ shareholding are therefore associated with increased information asymmetry (Orens et al., Citation2010). Based on results in Orens et al. (Citation2010), we expect a positive association between director shareholding and the dependent variable, the bid-ask spread.
3.5.4 Block ownership (
Information asymmetry is interrelated with the extent to which privately informed trading takes place and private information search activities (Brown & Hillegeist, Citation2007). Large institutional investors do not only have the resources to generate private information, but also benefit from economies of scale – which will further decrease their information acquisition cost relative to smaller retail investors. Based on results in Orens et al. (Citation2010), we expect a positive association between block ownership and the dependent variable, the bid-ask spread. Following Orens et al. (Citation2010) and Aerts, Cormier, & Magnan (Citation2007), we assigned a dummy variable of one for any single shareholding exceeding 20%.Footnote6
3.6 Methods
Using the dependent variable, independent variable and control variables as discussed above, the following regression model (ordinary lease squares) hypothesise the association between the independent variable (corporate website disclosure ), the control variables (
2 to
5) and the dependent variable (the bid-ask spread).
4. Results
All measurements were performed in the six-month period from September 2017 to February 2018Footnote7. Appendix A shows the average availability for each of the 35 attributes measured. On average, only 51.91% of the attributes were disclosed. Almost all companies disclosed their latest and archived annual reports, an interim report (although not always the latest), a basic business description with reference to the country of operation and access to notifications that the company had made in the past 12 months. On the other hand, almost none provided any information relating to the identity of their largest shareholders (if provided, not always dated), the number of shares issued and shareholder rights or any possible restriction on the transfer of securities.
depicts a cross-sectional variation in the total disclosure score over the defined population. This cross-sectional variation can probably be ascribed to the unregulated environment in South Africa.
Figure 1. Distribution of disclosure scores of companies.
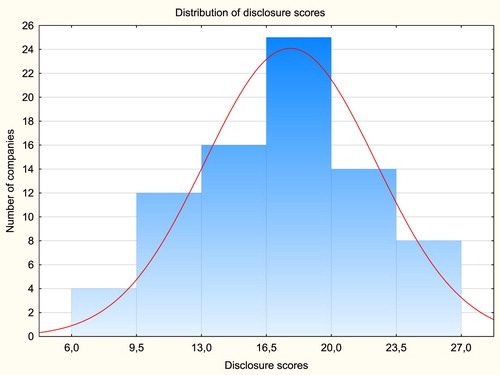
The low average disclosure score was not surprising for a number of possible reasons. First among these is the voluntary nature of disclosure on corporate websites; second, each company’s unique view of the expected costs and benefits of optimising an online disclosure strategy must be taken into account (Pirchegger & Wagenhofer, 2009). Third, given the focus on small companies, it should also be considered that many companies in this cohort may outsource this function, and as a result choose not to provide additional disclosure as the costs may outweigh the perceived benefits. Finally, companies may opt not to disclose some of the attributes arguing that they are already available via an alternative source (e.g. integrated annual report).
Three of the 83 companies included in the defined population were also listed on the AIM of the LSE. Given the mandatory nature of Rule 26 for these companies, they were removed from the initial defined population (on average these companies disclosed 93% of the Rule 26 requirements as expected). As a result of extremely thin trading, a reliable bid-ask spread was not available for one company. The population was therefore reduced to 79 companies. All descriptive statistics and analyses reported in the remainder of this paper are based on this reduced population of 79.
4.1. Selected descriptive statistics
The descriptive statistics are presented in . Descriptive statistics for the bid-ask spread, share price and market capitalisation are presented prior to the natural logarithmic transformations (to decrease the skewness in their distributions), which were used in all further regression analysis; all statistics are further presented before any variables were winsorized.
Table 3. Descriptive statistics.
Based on and the descriptive statistics above (e.g. average of 17.72 compared to median of 18.00), the disclosure score closely resemble a normal distribution. The smallest company had an average share price of only R0.04 compared to the largest company which had an average share price of R58.22. A comparison of the average and median of both the bid-ask spread and the share price point toward positive skew distributions.
The average leverage was 0.487. As this ratio was smaller than 0.5, it shows that on average the assets of the companies studied were primarily financed through equity. On average, 24.80% of shares were held by directors. As showed by the first (Q1) and third (Q3) quartiles, directors’ shareholding varied significantly, with 25% of companies where directors had almost no shares (less than 5.50% of issued shares) as opposed to 25% of companies where directors held 39.80% of issued shares. Of the 79 companies, 52 had a single shareholder who owned more than 20% of the issued shares. Sixty-two companies had a listing on the main board of the JSE with 17 a listing on the AltX. Based on an inspection of the histograms, only one variable, leverage, was winsorized to mitigate the influence of one influential outlier (see for the maximum leverage of 2.189).
4.2 Correlation analyses
shows the correlation coefficients between the control and independent variables as listed in , as well as market capitalisation. Except for the correlation between market capitalisation and share price, no correlation reported in are higher than 0.5 – suggesting the absence of multicollinearity.
Table 4. Correlations.
4.3 Reliability and validity
This study calculated the Cronbach alpha as 0.90, indicating the reliability of the measurement process. A Pearson correlation coefficient of 0.31 (significant at the 1% level) (see ) between the disclosure score and market capitalisation is in accordance with theoretical expectations, i.e. construct validity (as discussed in section 3.3). This correlation is consistent with previous studies that used market capitalisation to confirm the validity of their instruments (e.g. Froidevaux, Citation2004; Orens et al., Citation2010; Trabelsi et al., Citation2008) (all measuring corporate website disclosures).
4.4 Regression estimation results
presents the results of regressions that were performed to ascertain whether the disclosure score is linked to the bid-ask spread as information asymmetry proxy.
Table 5. Regression results (dependent variable = bid-ask spread).
Using the model described in Section 3.6, the ordinary least squares (OLS) regression shows a significant negative association (−0.039) between the disclosure score, and the bid-ask spread at the 5% level. At a 95% confidence level, the lower limit is −0.078 and the upper limit −0.001; rejecting the H0 hypotheses that the coefficient of disclosure is zero (i.e. have no effect on the bid-ask spread).
Gajewski and Li (Citation2015) and Nel (Citation2016) reported similar results for their measures of corporate website disclosure, while Chang et al. (Citation2008) and Orens et al. (Citation2010), on the other hand, found no similar association. The directions of all coefficients were as expected. All coefficients were highly significant, with the exception of director shareholding that was found not significant and block ownership only at the 10% level. The F-value for this model (6.028) was significant at the 1% level, indicating the overall significance of the model.
The coefficient of disclosure (−0.039) implies that a 1-point increase in the disclosure score is associated with a 3.9% decrease in the bid-ask spread. Given the link between the bid-ask spread, cost of capital and market capitalisation, these results therefore also suggest an economic significant relationship (further to the statistically significant relationship) between disclosure and the bid-ask spread. Amihud & Mendelson (Citation1986) report results that implies that a 1% increase in spread is associated with a 0.211% increase in the monthly risk-adjusted excess return. More specifically they conclude that if bid-ask spread is reduced from 3.2% (a high-spread group) to 0.486% (a low-spread group), the value of the asset will increase from $50 to $75.80.
Residual plots of predicted versus residuals were examined, and no evidence of heteroscedasticity was found. The Breusch-Pagan test confirmed the absence of heteroscedasticity (BP = 6.58, df = 5; p = 0.25). A minimum tolerance value of 0.89, which equates to a variance inflation factor of 1.12, confirmed the absence of multicollinearity. Finally, histograms of the raw residuals, as well as normality plots of residuals showed that residuals were approximately normally distributed with no influential outliers. In summary, these tests all indicate no serious violation of the necessary OLS assumptions.
Following the OLS, a hierarchical regression was performed in four stages: to ascertain (1) whether the disclosure score explains the dependent variable above and beyond the control variables, (2) whether disclosure remains significant once controlled for market capitalisation, and (3) whether company size has a moderating effect on the association between disclosure and information asymmetry. Market capitalisation, log transformed, was used as proxy for company size.
The first model (see – hierarchical regression (1)) explained 25.16% (R²) of the variation in the bid-ask spread, with all coefficients as expected significant at the 10% or better level, except for director shareholding. The second model explained 29.22% (R²) of the variation. The increased R² of 4.06% is statistically significant at the 5% level (p = 0.04). The results therefore show that disclosure does contribute in explaining variations in the bid-ask spread above and beyond the control variables.
Given the association between market capitalisation and the bid-ask spread as discussed in Section 3.1, coupled with studies that used market capitalisation to explain variations in the bid-ask spread, the third model (see – hierarchical regression (3)) added market capitalisation as control variable. As with share price, market capitalisation was log transformed to decrease the skewness in its distribution. The result thereof, as depicted in , was that market capitalisation is highly significant in explaining the bid-ask spread, with both share price and disclosure not significant. Although not significant (p = 0.41), the coefficient remains negative, indicating the expected negative association. Although showed a 0.59 correlation between share price and market capitalisation, the minimum tolerance value in this model of 0.52 (for market capitalisation) confirmed the absence of multicollinearity.Footnote8
Finally, based on the notion that smaller companies may potentially benefit more from increased disclosure levels compared to larger companies, the moderation effect of company size on the association between disclosure and information asymmetry was tested in a fourth model. The result thereof, as depicted in – hierarchical regression (4), showed the absence of any moderation.
4.5 Additional tests
Finally, two alternative information asymmetry proxies were tested, share price volatility and share turnover. Leuz and Verrechia (Citation2000) argued that gradual changes in share prices (i.e. low levels of volatility) indicate lower levels of information asymmetry. Share turnover, on the other hand, captures the willingness of investors to trade. In theory, share price volatility is positively correlated to information asymmetry, and share turnover negatively. A negative association between disclosure and share price volatility is therefore expected, and a positive association between disclosure and share turnover.
Share price volatility was captured from the IRESS database as on 28 February 2018. IRESS calculates share price volatility as the daily standardised deviation of share prices for the historic one-year period, multiplied by the square root of the number of trading days to annualise.
Following prior studies (Agarwal et al., Citation2016; Cheng et al., Citation2006; Orens et al., Citation2010), share turnover is calculated by means of the following formula:The share turnover ratio for each trading day between 1 September 2017 and 28 February 2018 was calculated using the above formula. The average share turnover per company was then calculated over the trading days.
Both regressions (i.e. share price volatility and share turnover as dependent variable with disclosure and the control variables listed in as independent variables) showed no significant associations with disclosure. All the disclosure coefficients were not significant in explaining both share price volatility (p = 0.17) and share turnover (0.99). Noteworthy is the negative coefficient with share price volatility and the positive coefficient with share turnover (both as expected).Footnote9
5. Conclusion, limitations and future research
The first objective set for the study reported in this paper was to explore whether JSE-listed companies comply with Rule 26 requirements as mandated by the LSE for companies listed on its AIM. As expected (given the voluntary nature thereof), the average total disclosure score for the population studied was measured as 17.72 out of a possible 35. Overall, the results showed that the majority of smaller listed JSE companies are not on par with their counterparts listed on the UK AIM of the LSE.
Relying on agency theory, the second objective was to examine whether the disclosure score was linked to information asymmetry. Besides the disclosure score, additional independent variables used in the literature to explain variations in information asymmetry were employed as control variables. Although the OLS regression showed the expected negative relationship (significant at the 5% level) between disclosure and the bid-ask spread, this negative relationship did not remain significant once controlled for market capitalisation. As additional robustness, two alternative (although not used as often as the bid-ask spread in literature) proxies for information asymmetry, namely share price volatility and share turnover, were tested. All the coefficients for disclosure were negative, as expected, with share price volatility and positive, as expected, with share turnover. Both coefficients were not significant.
Assuming a negative association between voluntary disclosure and information asymmetry, the results reported in this paper do suggest that the minimum corporate website disclosures required by Rule 26 may not be sufficient for investors in persuading them to change their trading behaviour. Another possible reason for the conflicting results reported in this paper is the relatively small population studied.
Although the results appear somewhat conflicting, overall they do provide some support for the notion that the optimal use of the corporate website as communication medium has the potential to reduce private information search activities and ultimately increase company visibility, all of which will mitigate the agency problem – reducing agency cost and information asymmetry.
This study contributes in various ways. Firstly, the results contribute to the body of voluntary disclosure studies by using data from a developing country and examining corporate websites as communication medium. As corporate websites, as disclosure medium, are unregulated in almost all stock exchanges, the results of this study contribute to the international audience, notwithstanding the use of JSE data only. Secondly, empirical support is provided for the importance to control for both market capitalisation and share price in examining the association between disclosure and the bid-ask spread. Finally, the results emphasise the importance to companies and regulators of understanding the drivers and benefits of staying abreast of technological developments.
The limitations of this study, which all warrant future research, are as follows. Firstly, the study measured only the availability of content on corporate websites, ignoring the quality (e.g. completeness and timeliness) and the specificity (e.g. good news or bad news) thereof. Whilst the current study used an unweighted index, future studies may consider constructing a weighted index to acknowledge that some attributes may be more important than others. Secondly, besides corporate websites, an array of alternative communication channels are available to companies (e.g. Twitter). This study further relied on only one measurement. Future research could benefit from the use of longitudinal and lagged data. A survey to measure investors’ use and perceptions of alternative communication channels such as corporate websites may provide further insight into the advantages thereof for companies. Although the population was defined to include only the smallest listed companies to answer the research questions, it is admitted that this limits generalisation to small listed companies (the median market capitalisation of the defined population is R453 million, compared to the median market capitalisation of the population of 275 companies (see ) of R4 563 million). Given the positive skewed distribution in market capitalisation of JSE-listed companies, a random sample from the JSE-listed companies, excluding the largest 40, would improve generalisation of the results in general.
Finally, this study examined only the link between corporate website disclosure and information asymmetry. As disclosure is theoretically linked to the cost of equity via information asymmetry (as discussed in the theory section), future research should examine the direct link between corporate website disclosure and the cost of equity utilising small listed companies.
Notes
1 The Technology Acceptance Model is an information systems theory developed by Davis in the 1980s to predict and explain the use of technology. The model suggests that when users are presented with a new technology, two important factors will influence their decision about the use thereof, namely: perceived usefulness and perceived ease-of-use (Davis, Citation1989).
2 In the context of this study, ‘published’ refers to being available on the corporate website of a company.
3 The 18-month listing criterion was set to ensure the availability of financial statement information and the 40 days trading requirement to improve the reliability of the bid-ask spread calculation.
4 Although it was initially considered to include only companies listed on the AltX, the set criteria to satisfy the study information needs would have resulted in a population of only 21 AltX listed companies. Using a guideline of 5–10 companies per variable in a multiple regression analysis, a study size of 83 companies should be sufficient.
5 Two attributes required by Rule 26 were only applicable to dual-listed companies and were therefore not included for comparison and robustness purposes (seven of the 83 companies were dual listed).
6 Admitting that some studies (e.g. Abdelsalam, Bryant, & Street, Citation2007) used a 5% threshold to define block shareholding, it should be noted that as only one company in the defined population didn’t have a single shareholding exceeding 5%, and therefore the 5% threshold was deemed impractical.
7 Although 10 companies were initially measured (as a pilot study) by both authors to finalise the measurement conventions (as described in Appendix A), all companies in the defined population were subsequently measured by only one of the authors.
8 The strong correlation between share price and market capitalisation is however not unexpected, given the calculation of market capitalisation, and may be offered as a possible explanation for share price being insignificant once controlled for market capitalisation.
9 In the share price volatility model, the disclosure coefficient of −0.014 implies that a 1-point increase in the disclosure score is associated with a 1.40% decrease in share price volatility (although not statistically significant with p = 0.17). In the share turnover model, however, the disclosure coefficient was found as 0.000, implying the absence of any economic or statistical significance (p = 0.99).
References
- Abdelsalam, O. H., Bryant, S. M., & Street, D. L. (2007). An examination of the comprehensiveness of corporate internet reporting provided by London-listed companies. Journal of International Accounting Research, 6(2), 1–33. https://doi.org/10.2308/jiar.2007.6.2.1
- Abdo, A., & Fisher, G. (2007). The impact of reported corporate governance disclosure on the financial performance of companies listed on the JSE. Investment Analysts Journal, 36(66), 43–56. https://doi.org/10.1080/10293523.2007.11082492
- Aerts, W., Cormier, D., & Magnan, M. (2007). The association between web-based corporate performance disclosure and financial analyst behaviour under different governance regimes. Corporate Governance, 15(6), 1301–1329. https://doi.org/10.1111/j.1467-8683.2007.00648.x
- Agarwal, V., Taffler, R. J., Bellotti, X., & Nash, E. A. (2016). Investor relations, information asymmetry and market value. Accounting and Business Research, 46(1), 31–50. https://doi.org/10.1080/00014788.2015.1025254
- Ajina, A., Sougne, D., & Lakhal, F. (2015). Corporate disclosures, information asymmetry and stock-market liquidity in France. Journal of Applied Business Research, 31(4), 1223–1237. https://doi.org/10.19030/jabr.v31i4.9297
- Akerlof, G. A. (1970). The market for “lemons”: Quality uncertainty and the market mechanism. The Quarterly Journal of Economics, 84(3), 488–500. https://doi.org/10.2307/1879431
- Amihud, Y., & Mendelson, H. (1986). Asset pricing and the bid-ask spread. Journal of Financial Economics, 17(2), 223–249. https://doi.org/10.1016/0304-405X(86)90065-6
- Ashbaugh, H., Johnstone, K. M., & Warfield, T. D. (1999). Corporate reporting on the internet. Accounting Horizons, 13(3), 241–257. https://doi.org/10.2308/acch.1999.13.3.241
- Barac, K. (2004). Financial reporting on the internet in South Africa. Meditari Accountancy Research, 12(1), 1–20. https://doi.org/10.1108/10222529200400001
- Bananuka, J. (2019). Intellectual capital, isomorphic forces and internet financial reporting. Journal of Economic and Administrative Sciences. Advance online publication. doi: 10.1108/JEAS-03-2018-0042
- Bollen, L., Hassink, H., & Bozic, G. (2006). Measuring and explaining the quality of Internet investor relations activities: A multinational empirical analysis. International Journal of Accounting Information Systems, 7(4), 273–298. https://doi.org/10.1016/j.accinf.2006.04.005
- Bonsón, E., & Escobar, T. (2002). A survey on voluntary disclosure on the Internet. Empirical evidence from 300 European Union companies. The International Journal of Digital Accounting Research, 2(1), 27–51. https://doi.org/10.4192/1577-8517-v2_2
- Bonsón, E., & Escobar, T. (2006). Digital reporting in Eastern Europe: An empirical study. International Journal of Accounting Information Systems, 7(4), 299–318. https://doi.org/10.1016/j.accinf.2006.09.001
- Boot, A. W. A., & Thakor, A. V. (1993). Security design. The Journal of Finance, 48(4), 1349–1378. https://doi.org/10.1111/j.1540-6261.1993.tb04757.x
- Botosan, C. A., & Plumlee, M. A. (2002). A re-examination of disclosure levels and the expected cost of equity capital. Journal of Accounting Research, 40(1), 21–40. https://doi.org/10.1111/1475-679X.00037
- Brown, S., & Hillegeist, S. A. (2007). How disclosure quality effects the level of information asymmetry. Review of Accounting Studies, 12(2-3), 443–477. https://doi.org/10.1007/s11142-007-9032-5
- Chang, M., D’Anna, G., Watson, I., & Wee, M. (2008). Does disclosure quality via investor relations affect information asymmetry? Australian Journal of Management, 33(2), 375–390. https://doi.org/10.1177/031289620803300208
- Cheng, E. C. M., Courtenay, S. M., & Krishnamurti, C. (2006). The impact of increased voluntary disclosure on market information asymmetry, informed and uninformed trading. Journal of Contemporary Accounting & Economics, 2(1), 33–72. https://doi.org/10.1016/S1815-5669(10)70016-3
- Cormier, D., Ledoux, M., & Magnan, M. (2009). The use of web sites as a disclosure platform for corporate performance. International Journal of Accounting Information Systems, 10(1), 1–24. https://doi.org/10.1016/j.accinf.2008.04.002
- Craven, B. M., & Marston, C. L. (1999). Financial reporting on the Internet by leading UK companies. European Accounting Review, 8(2), 321–333. https://doi.org/10.1080/096381899336069
- Da Silva Rodrigues, S., & Galdi, F.C. (2017). Investor relations and information asymmetry. Proceedings of the Brazilian National Association of Graduate Studies and Research in Administration. Belo Horizonte, Brazil. September 2016.
- Davis, F. D. (1989). Perceived usefulness, perceived ease of use, and user acceptance of information technology. Management Information Systems Quarterly, 13(3), 319–340. https://doi.org/10.2307/249008
- Deegan, C. (2017). Financial Accounting Theory. Australia: McGraw-Hill Education.
- Debreceny, R., Gray, G. L., & Mock, X. (2001). Financial reporting web sites: What users want in terms of form and content. The International Journal of Digital Accounting Research, 1(1), 1–23.
- Debreceny, R., Gray, G. L., & Rahman, A. (2002). The determinants of internet financial reporting. Journal of Accounting and Public Policy, 21(4-5), 371–394. https://doi.org/10.1016/S0278-4254(02)00067-4
- DiMaggio, P. J., & Powell, W. W. (1983). The iron cage revisited: Institutional isomorphism and collective rationality in organizational fields. American Sociological Review, 48(2), 147–160. https://doi.org/10.2307/2095101
- Dillon, A., Richardson, J., & McKnight, C. (1990). Navigation in hypertext: A critical review of concept. In D. Diaper, D. Gillmore, G. Cockton, & B. Shackel (Eds.), Proceedings of iFIP Interact ‘90: Human-computer interaction (pp. 587−592). Cambridge: North Holland.
- Esterhuyse, L. (2017). Voluntary disclosure, long-horizon investors and shareholder familiarity – An online investor relations perspective (Doctoral dissertation, UNISA, Pretoria, South Africa). Retrieved from http://uir.unisa.ac.za/bitstream/handle/10500/23727/thesis_esterhuyse_l.pdf?sequence=3&isAllowed=y
- Esterhuyse, L., & Wingard, C. (2016). An exploration of the online investor relations (IR) practices of companies listed on the Johannesburg Stock Exchange (JSE). South African Journal of Economic and Management Sciences, 19(2), 215–231. https://doi.org/10.4102/sajems.v19i2.1261
- Froidevaux, E.A. (2004). Investor relations internet disclosure and the cost of equity capital (Doctoral dissertation, University of Fribourg, Fribourg, Switzerland). Retrieved from http://ethesis.unifr.ch/theses/downloads.php?file=FroidevauxE.pdf
- Gajewski, J., & Li, L. (2015). Can Internet-based disclosure reduce information asymmetry? Advances in Accounting, incorporating. Advances in International Accounting, 31(1), 115–124. https://doi.org/10.1016/j.adiac.2015.03.013
- Gray, S. J., Radebaugh, L. H., & Roberts, C. L. (1990). International perceptions of cost constraints on voluntary information disclosures: A comparative study of UK and US multinationals. Journal of International Business Studies, 21(4), 597–622. https://doi.org/10.1057/palgrave.jibs.8490343
- Hassan, O., & Marston, C. (2010). Disclosure measurement in the empirical accounting literature: A review article (Working paper series 10-18). Brussel University. Retrieved from http://ssrn.com/abstract=1640598 https://doi.org/10.2139/ssrn.1640598
- Healy, P. M., & Palepu, K. G. (2001). Information asymmetry, corporate disclosure, and the capital markets: A review of the empirical disclosure literature. Journal of Accounting and Economics, 31(1-3), 405–440. https://doi.org/10.1016/S0165-4101(01)00018-0
- Hearn, B., & Piesse, J. (2015). The impact of firm size and liquidity on the cost of external finance in Africa. The South African Journal of Economics, 83(1), 1–22. https://doi.org/10.1111/saje.12062
- Heflin, F. L., Shaw, K. W., & Wild, J. J. (2005). Disclosure policy and market liquidity: Impact of depth quotes and order sizes. Contemporary Accounting Research, 22(4), 829–865. https://doi.org/10.1506/EETM-FALM-4KDD-9DT9
- Hetze, H., & Winistörfer, H. (2016). CSR communication on corporate websites compared across continents. International Journal of Bank Marketing, 34(4), 501–528. https://doi.org/10.1108/IJBM-02-2015-0022
- Hodge, F. (2001). Hyperlinking unaudited information to audited financial statements: Effects on investor judgements. The Accounting Review, 76(4), 675–691. https://doi.org/10.2308/accr.2001.76.4.675
- Institute of Directors Southern Africa. (2016). King IV: report on corporate governance for South Africa. Retrieved from https://c.ymcdn.com/sites/www.iodsa.co.za/resource/resmgr/king_iv/King_IV_Report/IoDSA_King_IV_Report_-_WebVe.pdf
- Jensen, M. C., & Meckling, W. H. (1976). Theory of the firm: Managerial behavior, agency costs and ownership structure. Journal of Financial Economics, 3(4), 305–360. https://doi.org/10.1016/0304-405X(76)90026-X
- Jones, A. (2009). Corporate websites. Investis. Retrieved from http://www1.investis.com/~/media/Files/I/Investis-V2/pdf/publications/corporate-websites-july-2009-v2.pdf
- Lang, M. H., & Lundholm, R. J. (2000). Voluntary disclosure and equity offerings: Reducing information asymmetry or hyping the stock? Contemporary Accounting Research, 17(4), 623–662. https://doi.org/10.1506/9N45-F0JX-AXVW-LBWJ
- Leuz, C., & Verrecchia, R. E. (2000). The economic consequences of increased disclosure. Journal of Accounting Research, 38(Suppl.), S91–S124. https://doi.org/10.2307/2672910
- Lodhia, S. K., Allam, A., & Lymer, A. (2004). Corporate reporting on the internet in Australia: An exploratory study. Australian Accounting Review, 14(34), 64–71. https://doi.org/10.1111/j.1835-2561.2004.tb00242.x
- LSE (London Stock Exchange). (2017). AIM Rules for Companies. Retrieved from https://www.londonstockexchange.com/companies-and-advisors/aim/advisers/aim-notices/aimrulesforcompaniesjan16.pdf
- Lybaert, N. (2002). Online financial reporting: An analysis of the Dutch listed firms. The International Journal of Digital Accounting Research, 2(4), 195–234.
- Marston, C., & Polei, A. (2004). Corporate reporting on the Internet by German companies. International Journal of Accounting Information Systems, 5(3), 285–311. https://doi.org/10.1016/j.accinf.2004.02.009
- Merton, R. C. (1987). A simple model of capital market equilibrium with incomplete information. The Journal of Finance, 42(3), 483–510. https://doi.org/10.1111/j.1540-6261.1987.tb04565.x
- Murphy, H. (2018, January 29). Mifid II pushes exchanges to lend helping hand to small companies. Financial Times. Retrieved from https://www.ft.com/content/d5df18b2-fba9-11e7-9b32-d7d59aace167
- Nel, G. F. (2016). Internet investor relations, information asymmetry and the cost of capital: Evidence from JSE listed companies (Doctoral dissertation, University of Stellenbosch, Stellenbosch, South Africa). Retrieved from file:///C:/Users/gfn/AppData/Local/Packages/Microsoft.MicrosoftEdge_8wekyb3d8bbwe/TempState/Downloads/nel_internet_2016.pdf
- Nel, G. F., & Baard, R. (2006). Using corporate web sites in Africa to market to investors. South African Journal of Information Management, 8(3), 1–10. https://doi.org/10.4102/sajim.v8i3.228
- Nel, G. F., Smit, E., & Brümmer, L. M. (2018). The link between Internet investor relations and information asymmetry. South African Journal of Economic and Management Sciences, 21(1), 1–10. https://doi.org/10.4102/sajems.v21i1.1966
- Nel, G. F., Smit, E., & Brümmer, L. M. (2019). The impact of Internet investor relations on the cost of capital: Evidence from companies listed on the Johannesburg Stock Exchange. Australian Accounting Review, 29(1), 36–48. https://doi.org/10.1111/auar.12216
- Ntim, C. G. (2013). An integrated corporate governance framework and financial performance in South African-listed corporations. The South African Journal of Economics, 81(3), 373–392. https://doi.org/10.1111/j.1813-6982.2011.01316.x
- Nunnaly, J. (1978). Psychometric theory (2nd ed.). New York: McGraw-Hill Book Company.
- Orens, R., Aerts, W., & Cormier, D. (2010). Web-based non-financial disclosure and cost of finance. Journal of Business Finance & Accounting, 37(9-10), 1057–1093. https://doi.org/10.1111/j.1468-5957.2010.02212.x
- Patten, D. M., & Crampton, W. (2003). Legitimacy and the internet: an examination of corporate web page environmental disclosures. In J. R. Martin (Ed.), Advances in Environmental Accounting & Management (Vol. 2, pp. 31–57). Bingley, UK: Emerald Group Publishing Limited. https://doi.org/10.1016/S1479-3598(03)02002-8
- Pirchegger, B., & Wagenhofer, A. (1999). Financial information on the Internet: A survey of the homepages of Austrian companies. European Accounting Review, 8(2), 383–395. https://doi.org/10.1080/096381899336113
- Reading, E. (2018). 5 Ways to build trust among stakeholders in conflict settings. Global Views. Retrieved from https://www.devex.com/news/5-ways-to-build-trust-among-stakeholders-in-conflict-settings-86762
- Smith, B., & Pierce, A. (2005). An investigation of the integrity of internet financial reporting. The International Journal of Digital Accounting Research, 5(9), 47–78. https://doi.org/10.4192/1577-8517-v5_2
- Trabelsi, S., Labelle, R., & Dumontier, P. (2008). Incremental voluntary disclosure on corporate websites: Determinants and consequences. Journal of Contemporary Accounting & Economics, 4(2), 120–155. https://doi.org/10.1016/S1815-5669(10)70032-1
- Welker, M. (1995). Disclosure policy, information asymmetry, and liquidity in equity markets. Contemporary Accounting Research, 11(2), 801–827. https://doi.org/10.1111/j.1911-3846.1995.tb00467.x
- Xiao, J. Z., Yang, H., & Chow, C. W. (2004). The determinants and characteristics of voluntary Internet-based disclosures by listed Chinese companies. Journal of Accounting and Public Policy, 23(3), 191–225. https://doi.org/10.1016/j.jaccpubpol.2004.04.002