
 ?Mathematical formulae have been encoded as MathML and are displayed in this HTML version using MathJax in order to improve their display. Uncheck the box to turn MathJax off. This feature requires Javascript. Click on a formula to zoom.
ABSTRACT
Despite the prominence of the BRICS bloc, little attention has been given to their stock market co-movement. This study investigates the time- and frequency-varying integration of the BRICS stock markets including new BRICS + members with active markets. We explore whether market integration is driven by common exposure to global factors using the DCC-GARCH model and wavelet coherence. Results show that removing global influences reduces variation, range and, for some country pairs, magnitude in correlations. The markets of India and Russia are most integrated with other markets in the bloc, while the markets of China and Brazil are most segmented from others in the bloc. New BRICS members, Saudi Arabia, Egypt and the United Arab Emirates, exhibit strong integration with some original bloc members. Crisis impacts are more systemic rather than specific to market linkages, with stable co-movements after filtering returns. Wavelet analysis shows that most integration between markets occurs over longer horizons. These findings have implications for portfolio construction and policymakers tasked with financial stability.
1. Introduction
The BRIC taxonomy was first coined by Goldman Sachs to refer to Brazil, Russia, India and China – a cluster of large emerging economies with significant growth potential. The group was formalised in 2006 and the first BRIC summit held in 2009. In December 2010, the group undertook its first expansion with South Africa joining, transforming the group into BRICS. Over the last decade, the BRICS group has become one of the most important economic blocs, with the countries representing close to 42% of the world’s population, approximately 26% of global GDP, 21% of exports and 19% of oil production (Lu, Citation2023). From the beginning of 2024, five new members joined this influential grouping namely, Egypt, Ethiopia, Iran, Saudi Arabia and the United Arab Emirates (UAE), with the expanded grouping known as BRICS + .
Despite the bloc being an informal arrangement without a charter, it has developed a more institutional character through high levels of political interaction and the creation of economic institutions such as the New Development Bank. This has contributed to a 56% rise in trade between members from 2017 to 2022 and a six-fold increase in foreign direct investment (although off a low base) from 2010 to 2020 (Arias, Citation2023; UNCTAD, Citation2023).
According to Wang and Moore (Citation2008), stock market integration refers to the degree of linkage between different stock markets, reflecting the extent to which movements in one stock market affect or are affected by movements in another market. Financial and economic ties, investor behaviour, sentiment and herding contribute to integration across stock markets (Didier et al., Citation2012). A vast body of literature investigates integration among stock markets around the world, with Bekaert and Harvey (Citation1995), Kim et al. (Citation2005) and Virk and Javed (Citation2017), among others, finding integration within regions, among developed economies and across emerging and developed markets. Patel (Citation2019), Maiti et al. (Citation2022), Mishra and Mishra (Citation2022) and Dsouza et al. (Citation2024) confirm integration among the BRICS markets although there is some evidence that China is more segmented. The existence of some co-movement between the BRICS markets is in line with the burgeoning political and economic relationships between the bloc’s members (Lehkonen & Heimonen, Citation2014; Dsouza et al., Citation2024).
Emerging markets, however, are increasingly affected by global influences such as developed country monetary policy, economic growth, inflation and risk perceptions (Pukthuanthong & Roll, Citation2009; Li et al., Citation2024). As a result, the integration of emerging markets may be driven by spillovers and the common response of emerging markets to global shocks rather than by intrinsic connections stemming from local or bloc influences. Wu (Citation2020) demonstrates that ignoring the impact of global market factors can substantially bias estimates of stock market integration among emerging markets. This follows Carrieri et al. (Citation2007) and Pukthuanthong and Roll (Citation2009) who highlight the inappropriateness of inferring the real level of financial market integration by market-wide index correlations. Notably, the role of global market factors is not examined in the existing studies on the integration between the BRICS members.
We investigate the time-varying integration among the BRICS stock markets over short- and long-run frequencies from January 2004 to May 2024. This period includes several crises – the Global Financial Crisis (GFC) (December 2007–March 2009), European Debt Crisis (EDC) (January 2010–December 2012), the COVID-19 crisis (March 2020) and Russia’s invasion of Ukraine (February–March 2022) – allowing us to compare co-movement during stable and crisis periods. We also include the new BRICS + members with active stock markets namely Saudi Arabia, Egypt and the UAE given the recent expansion of this important economic bloc. Notably, we filter out the effects of global factors to examine the co-movement of the BRICS markets attributable to domestic/ bloc influences. This enables us to obtain a ‘real’ measure of the integration among the BRICS member countries (Pukthuanthong & Roll, Citation2009).Footnote1 The multivariate dynamic conditional correlation (DCC)-GARCH model is used to estimate the extent of time-varying market integration with and without global influences between the original and new BRICS members. Wavelet coherence on the filtered returns is then used to gain further insights including how co-movement varies across the frequency domain.
Results show that removing global influences reduces the variation, range, and, in some cases, the magnitude of country correlations. The DCC and wavelet coherence results using filtered returns confirm India and Russia are most integrated with other markets in the bloc while China and Brazil are least integrated with other markets in the bloc. Among the new members with active markets, the UAE and to a lesser extent Egypt and Saudi Arabia are integrated with the original BRICS members. Heightened integration among markets during crisis periods is less evident once returns have been filtered, especially for the COVID-19 period. The wavelet coherence reveals that most co-movement among markets occurs at medium- and long-run horizons.
Our study makes several important contributions. First, we add to the existing research on the integration of markets within BRICS using a longer period than prior studies that includes the Russia-Ukraine war which is of particular importance given its disruptive effects on energy and food supply and Russia’s membership of BRICS, the growing political clout of the economic bloc and the expansion of BRICS members. Importantly, the integration of the new BRICS + members has yet to be explored in the literature. However, this analysis is limited to those markets with available data (the UAE, Saudi Arabia and Egypt). We follow Maiti et al. (Citation2022) and Dsouza et al. (Citation2024) by allowing for time-varying integration (in contrast to Patel, Citation2019 and Mishra & Mishra, Citation2022 who adopt a static approach) but use an alternative method (DCC-GARCH) which is widely employed in international literature as it accounts for volatility clustering, a common characteristic of financial time-series (Gupta & Guidi, 2012). Second, we use wavelet coherence to examine integration, which deconstructs co-movement into different frequencies that correspond to investment horizons (Rua & Nunes, Citation2009). This approach offers unique insights, with short-term investors focusing on the relationship between markets at high frequencies (short horizons) and long-term investors on low frequencies (long horizons). Wavelet analysis also allows us to observe the evolving relationship between stock markets, isolating specific events that increase co-movement, providing a more granular analysis than traditional regression or correlation. Other studies also use wavelet analysis to examine market co-movement (Rua & Nunes, Citation2009; Graham et al., Citation2012; Marfatia, Citation2017). Third, and crucially, we ascertain whether co-movement between markets is driven by a common response to global or bloc/local influences. Failing to account for this can result in a biased estimate of market co-movement (Wu, Citation2020). To the best of our knowledge, this has not been done on studies of BRICS’ market integration and there is only limited evidence thereof in other emerging market studies.
The findings of our study are useful for market participants and policymakers. The extent of integration among BRICS members and the new members with active stock markets has consequences for portfolio diversification. Highly integrated markets mean that investors will be able to achieve less diversification within this group (Gupta & Guidi, 2012). However, if market integration is primarily driven by global factors, then high integration may be of less concern because such global exposure is difficult to diversify. Given their size, liquidity and openness, the BRICS financial markets are key destinations for investors thus warranting insights on their exposure to local/ bloc influences, global factors and how co-movement varies across investment horizons. Financial regulators are also concerned about stock market integration as this may impact market stability and systemic risk if there is a crisis in another, closely linked, market due to contagion (Yu et al., Citation2010).
The remainder of this study is structured as follows. Section 2 provides an overview of the relevant literature pertaining to stock market integration. Section 3 discusses the dataset and outlines the methods used while the results are presented and discussed in Section 4. Finally, Section 5 contains the conclusions and implications of our findings.
2. Literature review
Financial markets may be integrated due to fundamental factors. For example, commodity exporters, economies with strong trade or financial ties or countries with similar market size, liquidity, openness, inflation and interest rates may move more closely together (Didier et al., Citation2012). Global conditions such as a crisis can also heighten integration (Wang & Guo, Citation2020). Goldstein (Citation1998) explains how a crisis often acts as a “wake-up call”, prompting market participants to become aware of vulnerabilities that could place other countries at risk. This causes investors to adjust their portfolios, contributing to higher correlation during crises. Non-fundamental factors such as sentiment, uncertainty and herd behaviour may also influence financial market co-movement (Didier et al., Citation2012). For instance, changes in risk aversion can trigger increased co-movement among assets, with investors frequently fleeing to safer assets during periods of crisis.
Financial market integration is inherently difficult to quantify resulting in a variety of empirical methods being used for this purpose (Kim et al., Citation2005). Static return correlations were used in early studies (such as Ripley, Citation1973) but with the development of cointegration methods, this approach dominated the study of market integration (such as Richards, Citation1995). However, these methods predominantly do not capture the dynamic nature of integration. As such, other research utilises methods that allow for time-varying relationships between markets including dynamic conditional correlation models (Mensi et al., Citation2016), wavelet coherence (Maiti et al., Citation2022), regime-switching models (Bekaert & Harvey, Citation1995) and connectedness models (Dsouza et al., Citation2024).
In one of the first empirical studies on market co-movement, Ripley (Citation1973) finds varying levels of integration between developed markets, greatest for the United States (US) and Canada, and lowest for Denmark and Finland. Using the cointegration approach, Richards (Citation1995) observes cointegration among the stock markets of the US, Canada, Japan, the United Kingdom (UK) and Germany. Kim et al. (Citation2005) and Virk and Javed (Citation2017) confirm time-varying integration among European markets, with correlations increasing after the 1987 stock market crash and the introduction of the European Monetary Union. Findings also show that integration varies according to country size and that Greece decoupled from other European markets during the country’s debt crisis. Using wavelet analysis, Rua and Nunes (Citation2009) observe that the co-movement between the US, UK, Japan and Germany varies over time and frequency. The US and UK markets are found to be most integrated while Japan is most segmented. Germany exhibits greater coherence over longer horizons, but short-run coherence rises post the 1990s.
Bekaert and Harvey (Citation1995) document evidence of time-varying market integration between several developed and emerging markets, with some developing markets (such as Malaysia and Korea) more integrated with developed markets than others (namely Colombia). Baumöhl and Lyócsa (Citation2014) observe substantial heterogeneity in the correlations of emerging and frontier markets with the MSCI World Index. Brazil and Mexico are most integrated whereas Côte d'Ivoire and the markets of Jordan, Oman and Kuwait are most segregated. They go on to show that correlations increase post the GFC and that correlations are highest during times of heightened volatility. Graham et al. (Citation2012) investigate the integration of 22 emerging markets with the US using wavelet coherence. They find stronger coherence over the long run suggesting opportunities for diversification over short investment horizons. However, market co-movement increases post 2006, especially at high frequencies. Marfatia (Citation2017) examines the integration of 22 leading stock markets from 1997 to 2015. He finds that European markets exhibit substantial co-movement with the US and, similarly to Graham et al. (Citation2012), this predominantly occurs in the long-run. At short horizons, coherence is stronger between markets in the same region. There is also evidence of increased co-movement during the GFC which persists thereafter.
Abbas et al. (Citation2013) find Pakistan, China and India are strongly integrated with the US, UK, Singapore and Japan whereas Sri Lanka is more segregated. Within the Asian region, China’s stock market is most segregated, and the Indian and Pakistan stock markets are integrated despite hostilities between the countries. Among the Gulf stock markets, Saeed et al. (Citation2023) observe that Oman and the UAE move closely over the medium-run investment horizon. The UAE and Oman are net return transmitters to Qatar, Bahrain, Saudi Arabia and Kuwait, with spillovers highest over long-run horizons. Using both DCC-GARCH and wavelet coherence, Matar et al. (Citation2021) document greater co-movement between Saudi Arabia and the UAE and the US than other Gulf markets, with the relationship predominantly occurring over long horizons.
With regards to the integration of the BRIC(S) markets, Bhar and Nikolova (Citation2009) observe that BRIC countries are integrated with their regions but less so with the world, with India the most integrated regionally and globally while China is the most segregated. Aloui et al. (Citation2011) and Mensi et al. (Citation2016) find significant correlation between the US and each of the BRICS countries, strongest for Brazil and weakest for China and Russia. Heightened co-movement is observed after the GFC, except for Russia’s stock market which decouples from the US. The results of Lehkonen and Heimonen (Citation2014) reveal disparate levels of stock market co-movement between each of the BRIC countries and the US suggesting that these markets should not be viewed as a homogenous grouping from a US perspective. Panda et al. (Citation2021) confirm strong connectedness between BRICS and developed markets. In the presence of economic policy uncertainty and geopolitical risk, Li et al. (Citation2024) find China to be a net recipient of volatility spillovers, with the remaining BRICS markets net volatility transmitters.
Examining integration between the BRICS markets, Patel (Citation2019) and Mishra and Mishra (Citation2022) identify a long-run relationship between the stock markets although Patel (Citation2019) observes that the relationship only exists after the GFC. Mishra and Mishra (Citation2022) find that integration weakened during the COVID-19 crisis, with the South African, Indian and Chinese markets decoupling from the long-run relationship. This finding differs from the results of Dsouza et al. (Citation2024) of heightened connectedness between the BRICS markets during the pandemic, in line with prior findings from Baumöhl and Lyócsa (Citation2014) and Mensi et al. (Citation2016) of increased integration between countries during crises. Maiti et al. (Citation2022) observe substantial co-movement in returns between the BRICS markets over the period from 1999 to 2019, except for China. Similarly to prior studies using wavelet coherence (such as Marfatia, Citation2017), they find relationships are strongest over long investment horizons. In an analysis of the time-varying correlation between South Africa and each member of BRICS, Gopane (Citation2023) confirms that co-movement spikes during crises.
Carrieri et al. (Citation2007), Pukthuanthong and Roll (Citation2009) and Wu (Citation2020) argue that real co-movement between markets can only be quantified by removing the effects of global influences to leave domestic/ regional factors. Wu (Citation2020) demonstrates that after adjusting for common global factors, the magnitude of connectedness among East and South-East Asian markets falls substantially. This suggests that stock market integration in the region is not as strong as initially appears and that connectedness attributable to non-global factors is small (further declining after the GFC). In contrast, the results of Carrieri et al. (Citation2007) show that market-wide correlations understate true correlations among a sample of emerging markets. Yu et al. (Citation2010) similarly find that Asian markets are more responsive to regional influences than global influences, however, emerging Asian markets exhibit limited integration.
Several key findings emerge from this literature. First, stock markets are integrated within regions, and between developed markets, and developed and emerging markets. Second, evidence shows some integration among BRICS stock markets. However, the more recent period which includes disruptive events such as the Russia-Ukraine war, the growing global influence of BRICS and increased political and economic ties within the BRICS bloc have not been considered. Additionally, no BRICS study has assessed whether the identified integration is attributable to common responses to global influences or true bloc influences. Ignoring global factors can bias results. Furthermore, co-movement between the original and new BRICS members with active stock markets has not been studied. We build on this framework by exploring the dynamic integration of the original and new BRICS members from January 2004 to May 2024, filtering returns to estimate ‘real’ BRICS market integration.
3. Data and methodology
We examine the flagship stock market indices of the founding BRICS members alongside their active new counterparts for the period January 2004 to May 2024. Weekly closing prices are sourced from Bloomberg for Brazil’s Ibovespa Brasil Sao Paulo Stock Exchange Index, Russia’s MOEX Index, India’s NSE Nifty 50 Index, China’s Shanghai Stock Exchange Composite Index, South Africa’s FTSE/JSE Africa All Share Index, Egypt’s Egyptian Exchange EGX 30 Price Index, Saudi Arabia’s Tadawul All Share Index and the United Arab Emirates’ Dubai Financial General Market Index. For simplicity, country names are used to report results instead of stock index names. To ensure consistency and comparability, and in line with Gupta and Guidi (2012), all indices are denominated in their respective domestic currencies, mitigating any potential bias arising from transformation due to exchange rate fluctuations.Footnote2 Thus, investors are assumed to be hedged against exchange rates.
Returns are calculated as logarithmic differences in weekly index levels, . Descriptive statistics for the returns of each of the stock indices are reported in , together with the MSCI World Index (World). The means are close to zero suggesting overall stability in the long-term trends of the indices and supports the use of a GARCH model. The standard deviations are quite similar for all the stock indices with Russia and Egypt tied for the highest. Leptokurtic distributions are present for all the return series given the large kurtosis values. Russia has the largest kurtosis values, highlighting the presence of heavier tails and an increased likelihood of extreme market movements. The skewness is negative suggesting a marginal tendency towards more extreme negative returns. The Jarque-Bera test further confirms deviations from normality in the return distributions. Augmented Dickey-Fuller (ADF) unit-root tests on the weekly returns data confirm that all the series are stationary at the 1% significance level.
Table 1. Descriptive statistics and unit root tests for country index returns.
To assess whether the original and new BRICS members are integrated in the absence of global factors, we filter out the influences of the world stock market using a simple international capital asset pricing model from Grauer et al. (Citation1976) as follows:
(1)
(1) where
and
are the returns on market i and the world stock market at time t respectively and
is the error term capturing that part of the ith market’s return not attributable to the influence of global factors (Wu, Citation2020). These filtered returns (
) are then used to examine the co-movements between the original and new BRICS stock markets free from the influence of global factors. The MSCI World Index is used to proxy for the world market factor.
presents heatmaps of Pearson correlation matrices for unfiltered returns shown on the left, and filtered returns on the right. The heatmaps are used to visualise the pairwise dependencies between markets, where a lighter (darker) colour indicates a lower (higher) level of correlation. Diagonal elements represent self-correlations, which are equal to one. Using the unfiltered returns, the highest pairwise correlations are observed between Brazil and South Africa (0.63), Russia and India (0.46), and Egypt and South Africa (0.34). Conversely, the least correlated markets are South Africa and India (−0.04), South Africa and Russia (−0.01), and Brazil and India (−0.01).
Figure 1. Heatmaps of Pearson correlation matrices for unfiltered (left) and filtered (right) returns.
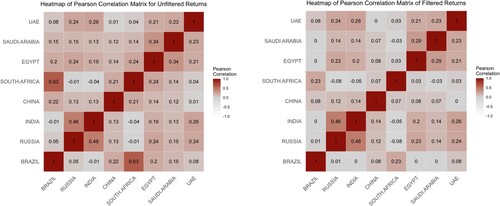
The filtering process changes some of these rankings and reduces the magnitudes of the pairwise correlations. With the filtered returns, the highest pairwise correlations are now between Russia and India (0.46), India and the UAE (0.26), and Russia and the UAE (0.24). The correlation between Brazil and South Africa declines by more than 60% once the influences of the global stock market dynamics are removed, dropping from 0.63 to 0.23. Wu (Citation2020) argues that this is especially true when both markets are commonly susceptible to global factors. The least correlated markets using the filtered returns are South Africa and Russia (−0.08), South Africa and India (−0.05), and South Africa and Saudi Arabia, whose correlation declines from 0.14 to −0.03. Other notable drops in pairwise correlations with filtered returns include Saudi Arabia and Brazil (from 0.15 to 0), Egypt and Brazil (from 0.2 to 0), and South Africa and Egypt (from 0.24 to 0.03). From the filtered returns, it appears that the stock markets of Russia, India, and the UAE are the most integrated, while those of South Africa against Russia, India, and Saudi Arabia are the most segmented.
These correlations however are static. To examine how integration changes between each pair of stock markets over time, we use Engle’s (Citation2002) DCC-GARCH model and wavelet coherence of Torrence and Compo (Citation1998). The DCC-GARCH model allows us to capture time-varying correlations, providing insights into the dynamic relationships between markets. Wavelet coherence, on the other hand, helps us understand the localised correlation patterns in both time and frequency domains, offering a more nuanced view of how market integration evolves across different timescales. These two models are defined next.
While univariate GARCH models focus on analysing the volatility of individual assets, multivariate GARCH models address the needs of investors who are more concerned with the interrelationships among assets and markets. Previous studies employ multivariate GARCH models to investigate contagion and spillover effects within emerging markets, with positive conditional correlations indicative of stock market integration (Celık, Citation2012; Gopane, Citation2023). Furthermore, the DCC-GARCH model also captures changes in conditional correlations over time which allows us to examine whether relationships among stock market indices shift during crises like the COVID-19 pandemic.
According to Engle (Citation2002), the conditional correlation between two random variables and
that each have zero mean can be defined as:
(2)
(2) In Equationequation (2)
(2)
(2) the conditional correlation is based on information known in the previous period. Engle (Citation2002) asserts that the correlation of multi-period forecasts can be defined in a similar manner and that all correlations defined in this way will lie in the range of [-1,1] due to the laws of probability. The estimation of Engle’s (Citation2002) DCC-GARCH occurs in two stages. The univariate GARCH model is estimated first, followed by the estimation of the time-varying conditional correlations. According to Celık (Citation2012), the DCC-GARCH model is defined as:
(3)
(3) where
is a vector of past observations,
is the vector of conditional returns,
is the vector of standardised residuals and
is the multivariate conditional variance defined as:
(4)
(4) From Equationequation (4)
(4)
(4)
is a diagonal matrix of conditional standard deviations for return series and
is an
symmetric time-varying correlation matrix, where
is a GARCH(1,1) specification, defined as:
(5)
(5)
The DCC specification is given by:
(6)
(6) where
is an
dynamic covariance matrix of standardised residuals (
) and
and
are nonnegative scalar parameters.
is defined as the diagonal matrix of the square roots of the diagonal elements of
. The conditional correlation at time t for markets i and j can then be defined as:
(7)
(7) where
is the element on the ith row and jth column of covariance matrix
. The DCC parameters
1 and
2 are typically
and
respectively. These parameters are estimated using the quasi-maximum likelihood method. Assuming normally distributed errors, the log-likelihood is maximised to estimate the correlation parameters,
, defined as:
(8)
(8) Wavelet coherence analysis is also used to evaluate stock market integration. According to Bouri et al. (Citation2020) the wavelet technique decomposes a return series into time-scale components and represents the variability structure of a stochastic process on a scale-by-scale basis. The filtered return series, as per Equationequation 1
(1)
(1) , are used for this analysis. Torrence and Compo (Citation1998) define the cross wavelet transform of two time-series x(t) and y(t) as:
(9)
(9) where
is associated to the location and
to the scale (period). Similar to Goodell and Goutte (Citation2021) the wavelet coherence capturing the co-movement between two stock markets is defined as:
(10)
(10) where
represents the wavelet squared coherence and lies between 0 and 1, and
is a smoothing operator over both time and scale. Therefore, the higher the value of
the higher the co-movement between two stock markets. In order to distinguish between positive and negative co-movement, wavelet coherence phase difference is defined as:
(11)
(11) where in this context, Im and Re refer to the imaginary and real components of the smoothed cross-wavelet transform. Phases are represented by black arrows in the wavelet coherence plots. When the phase difference is zero, it indicates that the stock markets are moving together. Arrows pointing to the right indicate that the stock markets are in-phase and positively correlated and therefore integrated. In contrast, arrows pointing to the left signify that the markets are out of phase, negatively correlated and therefore segmented. Finally, an upward-pointing arrow indicates that the first market leads the second by π/2, while a downward-pointing arrow indicates that the second market leads the first by π/2.
As weekly data is employed, frequencies (periods) less than one month are defined as the short-run, one to four months are defined as the medium-run and frequencies greater than four months present the long-run. The results are presented next.
4. Results
4.1 DCC-GARCH(1,1) model results
presents the estimation results of the DCC model using both unfiltered and filtered returns. The coefficient serves as a metric for news or innovations, representing the conditional variance in the ARCH term and indicates short-term persistence effects. For the unfiltered returns, the
coefficients are positive and statistically significant at the 1% level across all stock markets save for China whose
coefficient (0.126) is not significant. The
coefficients signify conditional volatility in the GARCH term, denoting the decay or persistence parameter. These persistence parameters demonstrate large positive values, with China exhibiting the highest coefficient of 0.853, significant at the 1% level. This implies that the impact of past volatility endures over an extended period. The correlation parameters
and
are significant. Their sum falls below 1 (0.974) indicating that the interdependence among the stock market indices fluctuates dynamically over time. For the filtered returns the
coefficients are much smaller relative to the unfiltered returns, are slightly positive, and are significant only for Brazil, China, South Africa and Egypt, suggesting that removing global risk factors reduces the short-term persistence. The
coefficients are much larger relative to the unfiltered returns’ coefficients, with all significant except India, highlighting enduring volatility even after filtering. Finally, the correlation parameter
is insignificant while
is with their sum still falling below 1, indicating time-varying interdependence.
Table 2a. DCC(1,1) model estimation results: unfiltered.
Table 2b. DCC(1,1) model estimation results: filtered.
The dynamic interdependence among each unique pair of stock market indices is illustrated in the DCC plots in . The left-hand side shows the DCC plots using the unfiltered returns, while the right-hand side are those based on filtered returns which are free from common global influences. The average DCCs and range for each country pair using both unfiltered and filtered returns are also summarised in . The unfiltered DCCs can be seen to exhibit wider ranges and higher volatility. Filtering out common global factors therefore results in narrower ranges and more stable DCCs which provide a more accurate representation of ‘real’ stock market integration between the original and new BRICS members. The greater stability suggests that correlations between the BRICS member countries do not change substantially over time. The DCCs are, on average, lower for the filtered returns than the unfiltered returns, consistent with the findings of Wu (Citation2020) that not removing global influences inflates stock market integration among emerging markets. Across the sample, the markets of China and Brazil appear most integrated across all other markets in the bloc before filtering but following filtering, the two markets become among the most segmented with all other markets in the bloc. Thus, co-movement of these two markets with other countries is heavily driven by their correlation with the world market. Mensi et al. (Citation2016) find Brazil is closely integrated with the US which is attributed to the US neighbourhood effect. Given the dominance of the US in the MSCI World Index, this may explain why Brazil’s integration falls markedly after filtering out global influences. Tripathy (Citation2022) confirms that Brazil is less integrated internationally in terms of global trade. While prior studies find China to be segmented (Bhar & Nikolova, Citation2009; Abbas et al., Citation2013; Matti et al., 2022), which is not the case when unfiltered returns are used, China’s role globally has increased dramatically in recent years thus possibly explaining the high correlation. The absence of a relationship with other markets after filtering is still in line with China’s differing economic and financial system, and strong government regulation.
Figure 2. DCC plots – unfiltered (left) versus filtered (right).
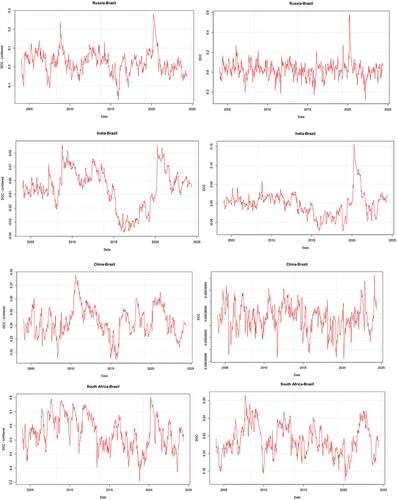
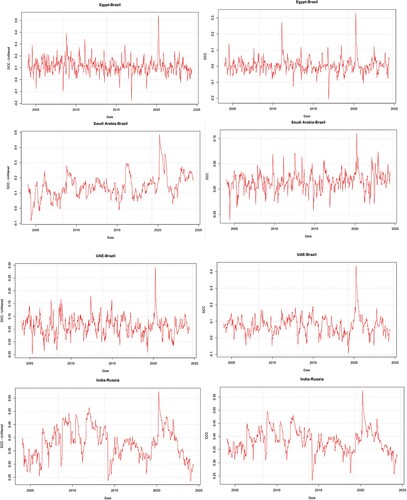
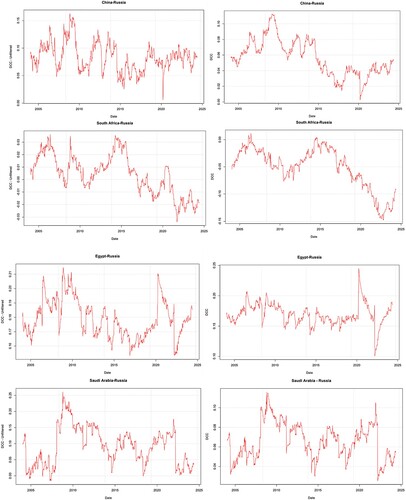
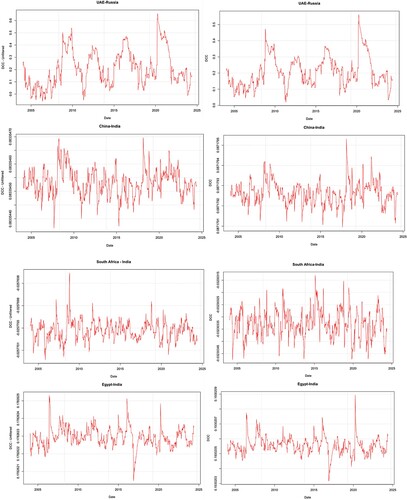
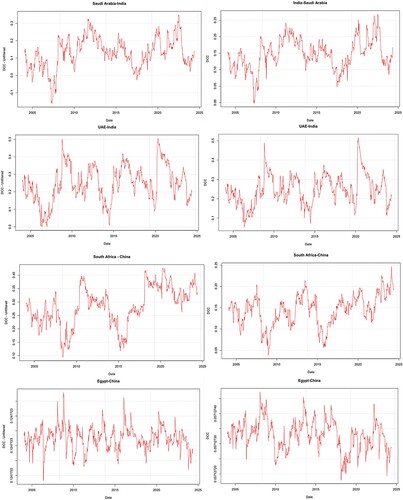
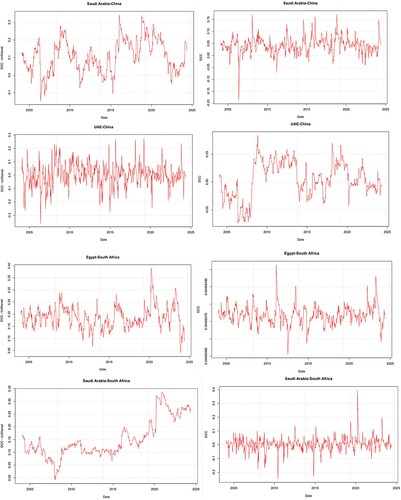
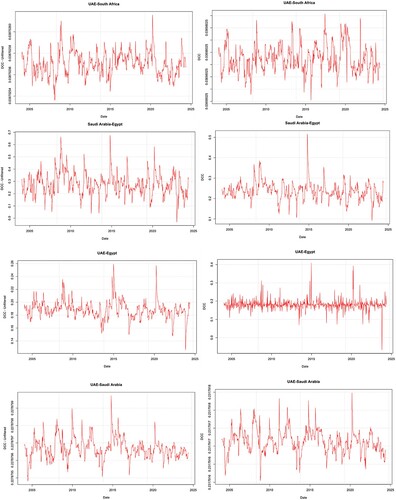
Table 3. Summary of DCC plots: unfiltered versus filtered.
India, Russia, the UAE and Egypt remain highly integrated before and after filtering. The integration of the Russian stock market is in line with the country’s global integration policy post the collapse of the Soviet Union, especially in forging strong relationships beyond Western markets while India has built robust international relations to support its growth trajectory (Tripathy, Citation2022). The high integration of Russia and India was also observed from the static correlations. The high integration of the UAE and Egypt may be linked to oil demand but also the rising trade and foreign policy of countries such as the UAE (Jacob, Citation2017).
The pairwise DCCs between China-Brazil, Egypt-South Africa, and the UAE-Egypt exhibit the most significant changes when comparing the range of DCCs for unfiltered and filtered returns. Initially, China and Brazil appear integrated, with DCCs ranging from 0.22 to 0.28. However, after removing global factors, these markets show a static DCC of 0.098, indicating a high degree of segmentation throughout the sample period, including all crisis periods. Similarly, the DCC for Egypt-South Africa ranges from 0.05 to 0.4 in the unfiltered data but a static DCC of 0.045 when filtered, demonstrating consistent segmentation across the full sample and during crises. This is the same for UAE-China with unfiltered DCCs ranging from −0.3 to 0.3 to filtered DCCs from −0.05 to 0.05. In contrast, certain country pairs exhibit consistent integration with time-varying conditional correlations, even in the absence of common global factors. These pairs include India-Russia, Egypt-Russia, UAE-Russia, Saudi Arabia-India, UAE-India, and Saudi Arabia-Egypt. Additionally, the pairs Egypt-India, and UAE-Saudi Arabia, show positive conditional correlations that do not vary over time for both unfiltered and filtered data This indicates consistent integrated markets both in the presence and absence of global risk factors.
Conversely, the pairs China-India, South Africa-India, and the UAE-South Africa are segmented, with static conditional correlations both before and after filtering. Further, India- Brazil, as well as China-Russia, exhibit DCCs that remain negative to low-positive, suggesting segmented markets. The finding of relatively low co-movement between India and China is consistent with geographical tensions and rivalry between the two countries which has limited increased trade and investment between the two countries.
also shows the average DCC of each country pair divided into sub-samples corresponding with the following crisis periods: the GFC (December 2007–March 2009), the EDC (January 2010–December 2012), the onset of the COVID-19 pandemic (March 2020) and Russia’s invasion of Ukraine (February–March 2022). These results illustrate the dynamic nature of integration between emerging equity markets, particularly during crisis periods. They also assess whether the stock markets of BRICS countries are becoming more integrated or if observed changes are linked to unaccounted factors, like common influences from the global stock market. According to Wu (Citation2020), existing empirical evidence of increasing stock market co-movement may simply reflect the growing impact of global systemic risks on individual markets. Some market pairs demonstrate reduced integration after filtering, such as South Africa-Brazil whose average DCCs for the full sample and each of the crisis periods decline substantially, like the average DCC for the COVID-19 crisis which drops from 0.74 to 0.19 after filtering. Other pairs with reduced integration post filtering during crisis periods include China-Russia, Egypt-Brazil, South Africa-Russia, South Africa-China, Saudi Arabia -Russia, Saudi Arabia-China, Saudi Arabia-South Africa, Saudi Arabia-Brazil, and Egypt-China. For Russia and Brazil, although the average DCCs for the entire sample period appear similar between the unfiltered and filtered data, notable differences emerge during some of the crisis periods. For example, during the COVID-19 crisis, there is increased integration between these markets, with the conditional correlations rising from a peak of 0.3 to 0.6 after removing global factors as seen in .
Furthermore, filtered returns saw heightened integration during COVID-19 observed between Egypt-Brazil, UAE-Brazil, India-Russia, Egypt-Russia, UAE-Russia, Saudi Arabia-India, UAE-India, South Africa-China, Saudi Arabia-South Africa, and UAE-Egypt. These results are in line with Mensi et al. (Citation2016) and Dsouza et al. (Citation2024) who also found heightened integration in stock markets during crisis periods. For the balance of all market pairs during COVID-19, the GFC and EDC crisis periods, no substantial increases in co-movements are observed. Increased integration between stock markets during crisis periods is therefore diluted once global factors have been filtered from stock markets. The observed stability in filtered DCCs suggests that the underlying economic connections between these market pairs are robust, maintaining their linkages even during periods of global turbulence.
Previous studies on stock market integration have not considered the impact of Russia’s invasion of Ukraine which led to several sanctions against this BRICS member, a gap this study addresses. As shown in , there are substantial changes in the average DCCs during February to March 2022 compared to the full sample averages. For instance, Russia and Brazil (−0.175 compared to 0.023) and South Africa and Russia (−0.130 compared to −0.051), indicating further segmentation in these markets during this period. The DCCs for other pairings with Russia either increased slightly, as with India, or decreased slightly, as with China, Egypt, the UAE and Saudi Arabia. However, no significant changes in DCCs among other market pairs are observed during this period. This likely reflects how Russia’s market was impacted whereas other markets were more insulated from the effects of the war despite trade ties between the countries.
In summary, the filtered DCC results reveal that the most integrated market pairs, excluding global factors, are India-Russia, UAE-India, and Saudi Arabia-Egypt with integration observed among all these five markets. When examining South Africa's integration with the original BRICS members, it is found to be partially integrated with Brazil and China, with average filtered DCCs of 0.22 and 0.15 respectively over the full sample period. Conversely, South Africa is segmented from Russia (−0.05), India (−0.03), Egypt (0.05), the UAE (0.04) and Saudi Arabia (0.01). Furthermore, Brazil and China are found to be segmented with every market except South Africa. These results however do not consider the dynamic co-movements between stock markets across different time frequencies. The results for the wavelet coherence analysis are therefore presented next.
4.2 Wavelet coherence results
The spectrograms in indicate sporadic co-movement between the stock markets of the original and new BRICS members after accounting for global influences. This is indicated by isolated red/ orange areas which are significant as reflected by the black lines. The significant coherence predominantly occurs over long investment horizons (more than four months), which is similar to the findings of Marfatia (Citation2017) and Maiti et al. (Citation2022) for other markets. The limited significant coherence points to a weak relationship due to regional/ domestic factors between markets at short-run horizons and suggests diversification opportunities across markets for investors with these investment horizons (Graham et al., Citation2012). Among those country pairs where significant long-run coherence is observed (such as Brazil-Russia and Russia-China), there is some commonality in the timing thereof from 2007 to 2010. This may indicate markets moving more closely after the GFC even after the removal of global influences (Baumöhl & Lyócsa, Citation2014). A similar pattern, although narrower, occurs in 2020 around the COVID-19 pandemic.
Figure 3. Wavelet coherence spectrograms.
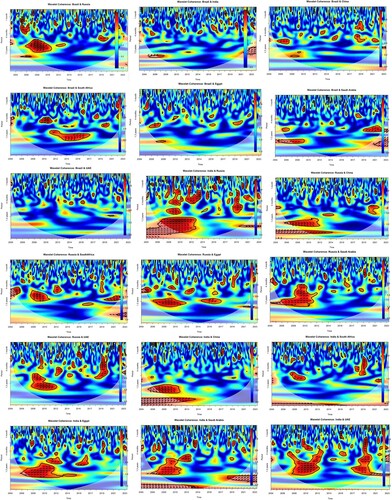
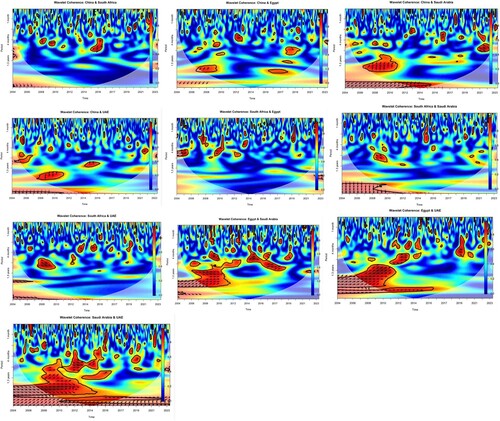
Brazil and China appear to be the most segmented markets across the BRICS bloc while India and Russia are most integrated after accounting for global influences. This is similar to that observed based on the DCC.
The Russia-South Africa, Egypt-UAE, India-South Africa and India-UAE pairs reveal increased coherence over time. However, apart from these stock market pairs, there is little evidence to support a general conclusion of increased co-movement between these emerging markets over time as suggested by Graham et al. (Citation2012) and Baumöhl and Lyócsa (Citation2014), among others. This suggests that the increased co-movement observed by others may be driven by global influences. Also noticeable is that the three new members of the BRICS bloc already exhibit some strong ties with the original members, notably with India and Russia as seen with the DCCs.
The coherence between the Russian and Indian filtered stock returns, which occurs at medium- and long-run horizons, is one of the strongest in the sample. The arrows are predominantly horizontal and rightward pointing demonstrating that neither market leads the other and that the correlation between the markets is positive. The relatively strong coherence over time is consistent with increased co-operation between the countries in terms of trade, investment and transport corridors. The notable coherence in 2018–2020 coincides with India signing an agreement with Russia to purchase surface-to-air missile defence systems which resulted in the US threatening India with sanctions over this (Roy, Citation2018). Likewise, the pervasive coherence from 2022 to 2023 concurs with soaring trade between the two countries since the onset of the Russia-Ukraine war, with India bypassing Western sanctions on the country. Saudi Arabia and UAE also show strong co-movement, the rightward pointing arrows confirming positive correlation between the markets after filtering out the global influences. This is in line with the regional and oil ties between the two countries, although there is a notable decline in long-run coherence from 2017 onwards which could be reflective of a growing rift and competition between the two economies.
5. Conclusion and implications
The BRICS countries represent over 25% of global GDP and more than 40% of the world’s population. The BRICS grouping remains attractive for investors and portfolio managers given their rapid growth, resource endowments and diversification opportunities. Recently, BRICS sought to increase economic cooperation and integration among themselves while expanding their membership to Egypt, Ethiopia, Iran, Saudi Arabia and the UAE. This study investigated stock market integration of the existing and new BRICS members with active stock markets (excluding Ethiopia and Iran) using DCCs among each pair of stock market indices as well as a wavelet coherence analysis for the period January 2004 to May 2024, using weekly data. A novel contribution of this study is the exploration of the DCCs among emerging markets, focusing on the BRICS + countries, by comparing unfiltered and filtered returns. The analysis is the first to distinguish between pure stock market integration and the influence of global risk factors in emerging stock markets, providing insights into the intrinsic economic connections between these markets.
Unfiltered DCC plots reveal dynamic interdependence among BRICS stock markets. Filtering out global risk factors results in more stable correlations, uncovering the true bilateral relationships between market pairs. Moreover, on average, the integration is lower when considering only non-global influences. After removing global factors, India and Russia are the most integrated markets with all other countries in the bloc while Brazil and China are the most segmented countries with all other members of the bloc. The wavelet analysis confirms this conclusion. Significant changes are observed in pairs like China-Brazil and Egypt-South Africa, where initially dynamic correlations decline drastically and become static post-filtering, indicating segmented markets which initially appear somewhat integrated. Conversely, some pairs, such as India-Russia, UAE-India, and South Africa-Brazil exhibit consistent integration even without global factors.
During the COVID-19 crisis, the conditional correlations for pairs like Russia-Brazil increase significantly after filtering, indicating heightened integration. However, during the Russia-Ukraine invasion, these correlations decrease, suggesting greater segmentation. For most market pairs, however, filtered DCCs during crisis periods are not substantially different from the full sample average, unlike their unfiltered counterparts, which show noteworthy changes. This highlights the homogenising effect of global risk factors during crisis periods.
The wavelet coherence analysis reveals the general absence of short- and medium-run coherence between markets suggesting diversification opportunities across markets for investors with these investment horizons (Graham et al., Citation2012). Less diversification opportunities exist for investors with a longer investment horizon, especially between the markets of India and Russia. However, diversification opportunities do exist in the markets of Brazil and China, which are less integrated. The wavelet analysis of the filtered returns confirms that the emerging markets of the BRICS bloc, and the new members, have experienced little sustained increased co-movement over time. However, rising trade and co-operation between Russia and India is reflected.
The overall findings underscore the importance of examining pure stock market integration, devoid of global risk factors, to understand the true economic relationships between markets. Filtering out global influences reveals more stable and robust connections, suggesting that intrinsic economic linkages, such as trade relations and financial interdependencies, play a crucial role in stock market integration. This approach provides a clearer picture of how emerging markets interact independently of global systemic risks, offering valuable insights for investors and policymakers aiming to navigate the complexities of global financial markets.
Future research should delve deeper into the unique geopolitical and economic factors influencing specific market pairs, especially those with significant variations in filtered DCCs during crisis periods. In addition, it would be of value to explore integration across sectors of the new and original BRICS members and the impact of trade policy uncertainty on the co-movement.
Disclosure statement
No potential conflict of interest was reported by the authors.
Notes
1 We do acknowledge that there may still be indirect influence of global factors, but the direct influences are filtered out (Wu, Citation2020).
2 All indices denominated in their respective local currencies were also converted to US dollars and their returns computed (hence the assumption that global investors are unhedged in exchange rates). However, the differences in returns using local currencies versus dollars were indistinguishable from zero.
References
- Abbas, Q., Khan, S., & Shah, S. Z. A. (2013). Volatility transmission in regional Asian stock markets. Emerging Markets Review, 16, 66–77. https://doi.org/10.1016/j.ememar.2013.04.004
- Aloui, R., Aïssa, M. S. B., & Nguyen, D. K. (2011). Global financial crisis, extreme interdependences, and contagion effects: The role of economic structure? Journal of Banking & Finance, 35(1), 130–141. https://doi.org/10.1016/j.jbankfin.2010.07.021
- Arias, S. (2023, November 4). Intra-BRICS trade increased by 56% in 2017–2022. Sputnik News. Retrieved from https://en.sputniknews.africa/20231104/intra-brics-trade-increased-by-56-in-2017-2022-reports-1063305496.html
- Baumöhl, E., & Lyócsa, Š. (2014). Volatility and dynamic conditional correlations of worldwide emerging and frontier markets. Economic Modelling, 38, 175–183. https://doi.org/10.1016/j.econmod.2013.12.022
- Bekaert, G., & Harvey, C. R. (1995). Time-varying world market integration. The Journal of Finance, 50(2), 403–444. https://doi.org/10.2307/2329414
- Bhar, R., & Nikolova, B. (2009). Return, volatility spillovers and dynamic correlation in the BRIC equity markets: An analysis using a bivariate EGARCH framework. Global Finance Journal, 19(3), 203–218. https://doi.org/10.1016/j.gfj.2008.09.005
- Bouri, E., Shahzad, S. J. H., Roubaud, D., Kristoufek, L., & Lucey, B. (2020). Bitcoin, gold, and commodities as safe havens for stocks: New insight through wavelet analysis. The Quarterly Review of Economics and Finance, 77, 156–164. https://doi.org/10.1016/j.qref.2020.03.004
- Carrieri, F., Errunza, V., & Hogan, K. (2007). Characterizing world market integration through time. Journal of Financial and Quantitative Analysis, 42(4), 915–940. https://doi.org/10.1017/S0022109000003446
- Celık, S. (2012). The more contagion effect on emerging markets: The evidence of DCC-GARCH model. Economic Modelling, 29(5), 1946–1959. https://doi.org/10.1016/j.econmod.2012.06.011
- Didier, T., Love, I., & Martínez Pería, M. S. (2012). What explains comovement in stock market returns during the 2007–2008 crisis? International Journal of Finance & Economics, 17(2), 182–202. https://doi.org/10.1002/ijfe.442
- Dsouza, S., Singh, N. P., & Oliyide, J. A. (2024). Dynamic connectedness among the BRICS markets and the recent pandemic: an application of TVP-VAR approach. International Journal of Emerging Markets. Advance online publication. https://doi.org/10.1108/IJOEM-11-2022-1673
- Engle, R. (2002). Dynamic conditional correlation: A simple class of multivariate generalized autoregressive conditional heteroskedasticity models. Journal of Business & Economic Statistics, 20(3), 339–350. https://doi.org/10.1198/073500102288618487
- Goldstein, M. (1998). The Asian financial crisis: Causes, cures, and systemic implications. Washington DC: Peterson Institute for International Economics.
- Goodell, J. W., & Goutte, S. (2021). Co-movement of COVID-19 and Bitcoin: Evidence from wavelet coherence analysis. Finance Research Letters, 38, 101625. https://doi.org/10.1016/j.frl.2020.101625
- Graham, M., Kiviaho, J., & Nikkinen, J. (2012). Integration of 22 emerging stock markets: A three-dimensional analysis. Global Finance Journal, 23(1), 34–47. https://doi.org/10.1016/j.gfj.2012.01.003
- Gopane, T. J. (2023). Economic integration and stock market linkages: Evidence from South Africa and BRIC. Journal of Economics, Finance and Administrative Science, 28(56), 237–256. https://doi.org/10.1108/JEFAS-11-2021-0232
- Grauer, F. L., Litzenberger, R. H., & Stehle, R. E. (1976). Sharing rules and equilibrium in an international capital market under uncertainty. Journal of Financial Economics, 3(3), 233–256. https://doi.org/10.1016/0304-405X(76)90005-2
- Jacob, J. (2017, January 25). India, UAE in a ‘comprehensive strategic partnership’, sign 13 security, trade pacts. Hindustan Times. Retrieved from https://www.hindustantimes.com/india-news/india-uae-in-a-comprehensive-strategic-partnership-sign-13-security-trade-pacts/story-IxpOFpcYtpDd9rfBQIuP6M.html
- Kim, S. J., Moshirian, F., & Wu, E. (2005). Dynamic stock market integration driven by the European Monetary Union: An empirical analysis. Journal of Banking & Finance, 29(10), 2475–2502. https://doi.org/10.1016/j.jbankfin.2004.09.002
- Lehkonen, H., & Heimonen, K. (2014). Timescale-dependent stock market comovement: BRICs vs. developed markets. Journal of Empirical Finance, 28, 90–103. https://doi.org/10.1016/j.jempfin.2014.06.002
- Li, R., Tang, G., Hong, C., Li, S., Li, B., & Xiang, S. (2024). A study on economic policy uncertainty, geopolitical risk and stock market spillovers in BRICS countries. The North American Journal of Economics and Finance, 73, 102189. https://doi.org/10.1016/j.najef.2024.102189
- Lu, M. (2023, August 24). Visualising the BRICS expansion in 4 charts. Visual Capitalist. Retrieved from https://www.visualcapitalist.com/visualizing-the-brics-expansion-in-4-charts/
- Maiti, M., Vukovic, D., Vyklyuk, Y., & Grubisic, Z. (2022). BRICS capital markets co-movement analysis and forecasting. Risks, 10(5), 88. https://doi.org/10.3390/risks10050088
- Marfatia, H. A. (2017). A fresh look at integration of risks in the international stock markets: A wavelet approach. Review of Financial Economics, 34, 33–49. https://doi.org/10.1016/j.rfe.2017.07.003
- Matar, A., Al-Rdaydeh, M., Ghazalat, A., & Eneizan, B. (2021). Co-movement between GCC stock markets and the US stock markets: A wavelet coherence analysis. Cogent Business & Management, 8(1), 1948658. https://doi.org/10.1080/23311975.2021.1948658
- Mensi, W., Hammoudeh, S., Nguyen, D. K., & Kang, S. H. (2016). Global financial crisis and spillover effects among the US and BRICS stock markets. International Review of Economics & Finance, 42, 257–276. https://doi.org/10.1016/j.iref.2015.11.005
- Mishra, P. K., & Mishra, S. K. (2022). Is the impact of COVID-19 significant in determining equity market integration? Insights from BRICS economies. Global Journal of Emerging Market Economies, 14(2), 137–162. https://doi.org/10.1177/09749101211070960
- Panda, P., Vasudevan, S., & Panda, B. (2021). Dynamic connectedness among BRICS and major countries stock markets. Journal of Public Affairs, 21(3), e2265. https://doi.org/10.1002/pa.2265
- Patel, R. J. (2019). BRICS emerging markets linkages. Journal of Private Equity, 22(4), 42–59. https://doi.org/10.3905/jpe.2019.1.089
- Pukthuanthong, K., & Roll, R. (2009). Global market integration: An alternative measure and its application. Journal of Financial Economics, 94(2), 214–232. https://doi.org/10.1016/j.jfineco.2008.12.004
- Richards, A. J. (1995). Comovements in national stock market returns: Evidence of predictability, but not cointegration. Journal of Monetary Economics, 36(3), 631–654. https://doi.org/10.1016/0304-3932(95)01225-7
- Ripley, D. M. (1973). Systematic elements in the linkage of national stock market indices. The Review of Economics and Statistics, 55, 356–361. https://doi.org/10.2307/1927959
- Roy, R. (2018, October 5). India goes ahead with Russia missile buy in face of U.S. sanctions threat. Wall Street Journal. Retrieved from https://www.wsj.com/articles/india-goes-ahead-with-russia-missile-buy-in-face-of-u-s-sanctions-threat-1538742672
- Rua, A., & Nunes, L. C. (2009). International comovement of stock market returns: A wavelet analysis. Journal of Empirical Finance, 16(4), 632–639. https://doi.org/10.1016/j.jempfin.2009.02.002
- Saeed, T., Nautiyal, N., Rehman, M. U., Alsulami, H. H., & Alhothuali, M. S. (2023). Do gulf stock markets share time varying connectedness? Applied Economics, 55(48), 5700–5718. https://doi.org/10.1080/00036846.2022.2140119
- Torrence, C., & Compo, G. P. (1998). A practical guide to wavelet analysis. Bulletin of the American Meteorological Society, 79(1), 61–78. https://doi.org/10.1175/1520-0477(1998)079<0061:APGTWA>2.0.CO;2
- Tripathy, N. (2022). Long memory and volatility persistence across BRICS stock markets. Research in International Business and Finance, 63, 101782. https://doi.org/10.1016/j.ribaf.2022.101782
- UNCTAD. (2023). BRICS Investment Report. (United Nations, UNCTAD/DIAE/2023/1). Retrieved from https://unctad.org/publication/brics-investment-report
- Virk, N., & Javed, F. (2017). European equity market integration and joint relationship of conditional volatility and correlations. Journal of International Money and Finance, 71, 53–77. https://doi.org/10.1016/j.jimonfin.2016.10.007
- Wang, P., & Moore, T. (2008). Stock market integration for the transition economies: Time-varying conditional correlation approach. Manchester School, 76, 116–133. https://doi.org/10.1111/j.1467-9957.2008.01083.x
- Wang, S., & Guo, Z. (2020). A study on the co-movement and influencing factors of stock markets between China and the other G20 members. International Journal of Finance & Economics, 25(1), 43–62. https://doi.org/10.1002/ijfe.1727
- Wu, F. (2020). Stock market integration in East and Southeast Asia: The role of global factors. International Review of Financial Analysis, 67, 101416. https://doi.org/10.1016/j.irfa.2019.101416
- Yu, I. W., Fung, K. P., & Tam, C. S. (2010). Assessing financial market integration in Asia – Equity markets. Journal of Banking & Finance, 34(12), 2874–2885. https://doi.org/10.1016/j.jbankfin.2010.02.010