
 ?Mathematical formulae have been encoded as MathML and are displayed in this HTML version using MathJax in order to improve their display. Uncheck the box to turn MathJax off. This feature requires Javascript. Click on a formula to zoom.
ABSTRACT
Permeable pavement is utilised in order to alleviate flooding in towns, cities and other urban areas, but it is prone to clogging, has relatively low strength and requires regular maintenance. We have developed a novel permeable pavement with low tortuosity pore structure that can be cast on-site that is not only resistant to clogging, but also has high permeability and strength. This high strength clogging resistant permeable pavement (CRP) was prepared by introducing straight pore channels of varying size and number into self-compacting mortar. Samples with porosity ranging from 2 to 32% were tested. In all cases, permeability and compressive strength were substantially higher than conventional permeable concrete. More significantly, CRP can be engineered with low porosity (5%), high strength (> 50 MPa) and high permeability (> 2 cm/s), but does not clog despite extensive cyclic exposure to flow containing sand and clay. A simple method to model the permeability of CRP from the pore structure is described. We report for the first time a high strength clogging resistant permeable pavement capable of retaining sufficient porosity and permeability for storm-water infiltration without requiring frequent maintenance. This innovative system will help alleviate urban flooding and contribute towards a more sustainable urbanisation.
1. Introduction
For the last century and a half societies have become increasingly urbanised. As our cities expand, they become more vulnerable to flooding as impermeable surfaces are wholly incapable of absorbing rainfall. Therefore flooding, whether mild or catastrophic in nature has become increasingly likely. Flooding impacts on lives, commerce and society as a whole, to say nothing of the cost of damage, which is measured in billions of pounds per year in the UK alone.
In recent years, permeable pavements have been increasingly promoted as an effective sustainable drainage system (SuDS) to mitigate surface flooding in urban areas. Permeable concrete (PC), also known as pervious concrete, is a popular type of permeable pavement as it has the ability to transport large volumes of water through the porous structure of the material. However, the pore structure of permeable concrete can become clogged by sediment particles and its ability to drain storm-water runoff gradually decreases (Deo et al. Citation2010, Tong Citation2011, Mata and Leming Citation2012, Coughlin et al. Citation2012, Yong et al. Citation2013). Kia et al. (Citation2017) presented a recent review of this topic.
The problem, which causes clogging in existing permeable concrete, is the high tortuosity of the pore network, with variable path cross-sections and random interconnectivity. Tortuosity is a measure of geometric complexity of a porous medium, in this case, permeable concrete (Bear Citation1988). Each flow path through permeable concrete has a different tortuosity and the probability of particulates retaining and accumulating within narrow pore constrictions increases with increase in tortuosity. As such, the potential for clogging becomes greater for porous materials with high tortuosity. Therefore, it is important to develop clogging resistant permeable concrete that retains sufficient high porosity and permeability for storm-water to infiltrate throughout its service life without requiring substantial maintenance. One approach is to engineer a pore structure that is uniform and low tortuosity. It is expected that surface runoff will be effectively transferred through such a material with a much reduced risk of retaining solid particulates.
Furthermore, it would be advantageous for the pervious pavement to have high compressive strength to enable use in heavily loaded applications. Conventional permeable concretes rely on high porosity to achieve sufficient permeability, and consequently are low strength systems restricted to light traffic or pedestrian pavements. Therefore, a major research challenge is to develop a new type of high strength clogging resistant permeable pavement (CRP) that is highly porous, but low tortuosity and deliverable on site without reducing the mechanical properties of the concrete. Achieving this will enhance the efficiency, durability and cost effectiveness of permeable pavement, thereby enabling its wider application.
The overall aim of this study is the development of a new permeable pavement system which is more durable, less prone to clogging and does not require frequent maintenance. In addition, we seek to deepen the overall understanding of clogging as a process and how this effects permeable concrete. The proposed CRP was tested and compared against a broad range of permeable concretes, both laboratory prepared and commercially available. Some of the key experimental variables were effective porosity (2–32%), cylindrical tube diameter (3–6 mm), particle size (1.25–14 mm) and clogging method. The combined ‘sand and clay’ and alternate ‘sand or clay’ clogging methods were used to recreate clogging as it would occur during flooding. Finally, several approaches for large-scale site delivery of CRP are proposed and discussed.
2. Experimental
2.1. Sample preparation
Three different sample types were tested: a) conventional permeable concrete prepared in the laboratory (PC-Lab), b) conventional permeable concrete available in the market (PC-Com) and c) a newly developed high strength clogging resistant permeable pavement (CRP).
The laboratory prepared conventional permeable concrete (PC-Lab) had 11–30% target porosity and these were made using CEM I 52.5N, water/cement (w/c) ratio of 0.35 and Thames Valley gravel. The gravel had particle size ranging from 1.24–14 mm, a 24-h absorption of 1.76% and a specific gravity of 2.51. Mix proportions are based on absolute volume. In order to calculate the required paste volume, the target porosity was deducted from the packed aggregate void content and a 5% compaction index was added. The required cement and water contents were then calculated from the paste volume and w/c ratio. Finally, coarse aggregate content was calculated from the paste volume and target porosity. Trial mixing and testing indicated that this approach resulted in samples with target porosity very close to the measured void content. The paste drain down effect was observed in two mixes and so a viscosity-modifying admixture (VMA) (MasterMatrix SDC) was added to the affected mixes. shows the mix proportions of laboratory prepared permeable concrete samples.
Table 1. Mix proportions of conventional permeable concrete (PC-Lab) prepared in the laboratory.
Samples were cast in steel moulds (100 × 100 × 100 mm cubes) and Perspex cylinders (100Ø × 150 mm), and compacted in three equal layers using a vibrating table of adjustable intensity. 36 PC-Lab samples were prepared in total. A widely recognised and accepted standard compaction method for permeable concrete has not yet been developed. Therefore, preliminary tests were carried out to study the effect of compaction time on void content of packed Thames Valley gravel. It was observed that 75 s was required to achieve a maximum compaction. As such, PC-Lab samples were compacted in three layers, each for 25s.
Clogging resistant permeable pavement (CRP) with target porosity ranging from 2–30% were prepared by introducing plastic tubes of varying diameter (3–6 mm) and number into self-compacting mortar (). Self-compacting mortar was prepared using CEM I 52.5N (711 kg/m3) and fine-grained river sand (< 2.5 mm, 1323 kg/m3) at a w/c ratio of 0.4. The specific gravity of sand was 2.76 and 24-h absorption was 0.7%. A polycarboxylic-ether type superplasticiser (MasterGlenium 315C) was utilised at 0.25% wt. of cement to achieve the desired workability. Mix compositions of CRP are shown in . The number and size of the plastic tubes were varied in order to achieve different porosities. The CRP samples were cast in steel moulds (100 × 100 × 100 mm cubes or 100 × 100 × 500 mm prisms) and Perspex tubes (100Ø × 150 mm), with the plastic tubes held in place using two steel meshes fixed at the top of the moulds. Overall 97 CRP samples were prepared using this method.
Figure 1. High strength clogging resistant permeable pavement (CRP) containing straight pore channels (plastic tubes) of varying size and number in self-compacting mortar to achieve porosity ranging from 4 to 30%. Samples tested include 100Ø × 150 mm cylinders (a–d), 100 mm cubes (e,f) and 100 × 100 × 500 mm prisms (g,h).
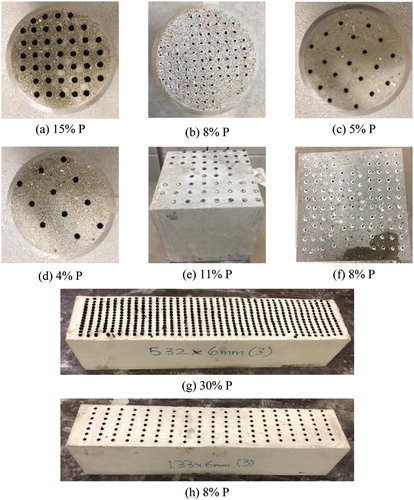
Table 2. Mix compositions of high strength clogging resistant permeable pavement (CRP).
All CRP and PC-Lab samples were covered with wet hessian and polyethylene sheet for the initial 24 h, before being de-moulded and placed in a fog room at a temperature of 20°C, 95% ± 5% RH for 28 days prior to testing for compressive strength, porosity and permeability. For CRP, the protruding part of the plastic tubes was trimmed using a hot wire in order to produce a flat surface for testing.
In addition, 24 permeable concretes available on a commercial basis (PC-Com) were acquired from a major supplier based in the United Kingdom and tested as a comparison against those samples which had been prepared in the laboratory. The PC-Com samples were 100Ø × 150 mm cylinders and their porosity ranged from 15–32%. These samples were made of CEM I cement, limestone coarse aggregate of 4–10 mm particle size, super-plasticizer, water, stabiliser and retarder. The actual mix compositions for these samples are protected and not accessible to the public as they constitute commercially valuable products in their own right.
2.2. Porosity
In order to obtain the porosity (φ) of permeable concrete (PC-Lab and PC-Com), the mass of the saturated-surface dry sample in air and in water was measured.(1)
(1) where W1 is the sample mass (kg) in water, W3 is the saturated surface dry sample mass in air (kg), V is the sample volume (m3) and ρw is the density of water (1000 kg/m3). Before W1 was measured, any trapped air was removed by keeping the sample submerged in water for a minimum of 30 min, inverting it and tapping it on a regular basis. Per mix, six replicates were recorded and averaged.
Porosity of CRP was calculated from the size and number of straight pores (plastic tubes) in the mix:(2)
(2) where Vp is the volume of each pore (plastic tube), n is the number of pores and Vc is the volume of the cylindrical sample (m3). Results were confirmed experimentally by filling the pores with water and dividing its volume by the volume of the sample. Porosity was recorded and averaged on 7 replicates per mix.
2.3. Compressive and flexural strength
Compressive strength of all samples was measured in accordance with BS EN 12390-3:Citation2009a on 100 mm cubes (for PC-Lab and CRP samples) and 100Ø × 150 mm cylinders (for PC-Com samples) at 28 days, using three replicates per mix for PC-lab and PC-Com and six replicates for CRP. Samples were placed between two 150 × 150 × 25 mm metal plates so as to guarantee constant loading at a rate of 0.3 MPa/s to ultimate failure. Flexural strength (fr) of CRP samples was measured using the four-point bending test setup in accordance to BS EN 12390-5:Citation2009b on 100 × 100 × 500 mm prims at 28 days, using three replicates per mix. Flexural strength was calculated using the equation , where fr is the flexural strength (MPa), F is the maximum load (N), L is the distance between supporting rollers (mm), and b and d are the width and depth of the sample (mm).
2.4. Permeability
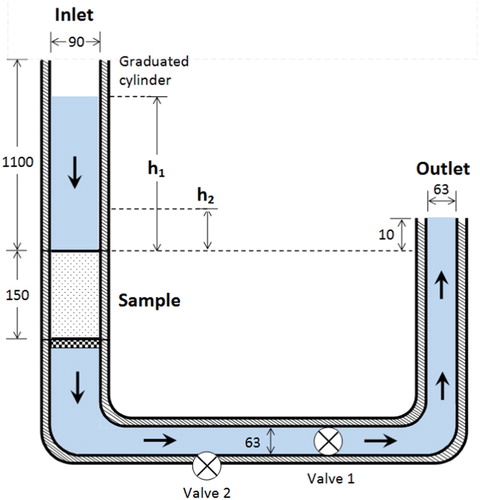
A falling head permeability setup was used to measure permeability, this is shown schematically in and described in Kia et al. (Citation2018). Each sample first had to be pre-conditioned, this was achieved by directing a flow of water through the setup until there was no remaining visible trapped air to ensure complete saturation. The test was initiated by closing valve 1 to fill the graduated cylinder with water. Valve 1 was then released and the time (t) required for the water level to fall from an initial head h1 (1000 mm) to a final head h2 (250 mm) was recorded. The permeability cell was drained and the rig was cleaned at the end of each clogging test through the use of valve 2. For each sample, this procedure was repeated three times and the average time t was used to determine hydraulic conductivity (k, m/s) as per Darcy’s law:(3)
(3) where A1 is the internal cross-sectional area of the inlet pipe (m2), A2 is the cross-sectional area of the sample (m2) and L is the sample length (m). Hydraulic conductivity (k, m/s) can be converted to intrinsic permeability (k’, m2) by accounting for the fluid density (ρ, kg/m3) and dynamic viscosity (μ, Ns/m2), and gravitational acceleration (g, m/s2). However, clogging changes fluid density and viscosity during the test, so results will be expressed as hydraulic conductivity. For each mix, hydraulic conductivity was measured on 3 replicates for PC-Lab, 6 replicates for PC-Com and 2–4 replicates for CRP, and averaged.
Figure 2. Modified falling head permeability cell used in this study. Schematic is not to scale and dimensions are in mm.
2.5. Clogging after cyclic exposure
In order to determine clogging, samples were exposed to aqueous solutions containing bentonite clay and/or fine-grained river sand (< 1.25 mm), this exposure was carried out over many cycles (Kia et al. Citation2018). The d50 value of the river sand was ∼ 108 μm. The bentonite clay comprised of agglomerated particles of < 150 μm. details the two exposure methods used: (a) combined ‘sand and clay (S & C)’ and (b) alternate ‘sand or clay (S/C)’ loading. During each clogging cycle permeability (k) was recorded, this was repeated until complete clogging occurred. Complete clogging is here defined as when no measurable flow (k → 0) or measurable change in permeability (Δk → 0) was observed. Several conventional permeable concretes were subjected to trials using varying amounts of clay and sand in order to find the appropriate loading rates. It was determined that applying 0.8 g/cm2 of sand or 33.3 g/L of clay per cycle led to a measurable reduction in hydraulic conductivity and complete clogging would occur within a span of ∼ ten cycles. This loading rate simulates a severe clogging scenario and represents a good compromise to achieve measureable change within a reasonable test duration. Further details are presented in Kia et al. (Citation2018).
Table 3. Clogging methods.
3. Results and discussion
3.1. Compressive strength
There are a range of factors which influence the compressive strength of permeable concrete. Porosity, cement content, w/c ratio, compaction during placement and the characteristics of the aggregate are all known to have an effect. presents compressive strength plotted against porosity for all samples. For conventional permeable concretes (PC-Lab and PC-Com), compressive strength ranged from 6 to 32 MPa for porosities of 12–32%. In contrast, the compressive strength for CRP from 19 to 59 MPa for porosities of 2–30%. As expected, strength was inversely proportional to porosity with R2 > 0.9. A 1% increase in porosity would lead to a decrease in strength of between 3% and 4% on average.
Figure 3. Relationship between compressive strength, flexural strength and porosity for conventional permeable concretes (PC-Lab and PC-Com) and high-strength clogging resistant permeable pavement (CRP) at 28-day.
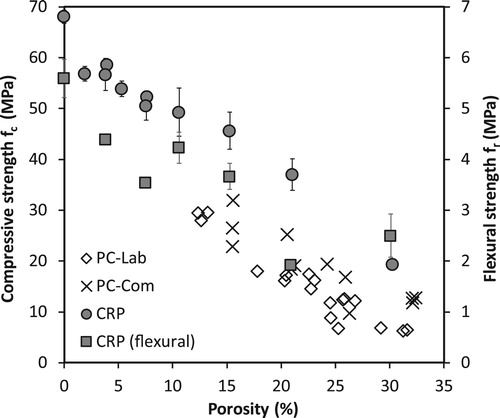
At comparable porosity, the compressive strength of PC-Lab was noted to be slightly lower than that of PC-Com. There are a number of reasons why this should be the case, these include variations in aggregate and binder type, the smaller pore sizes which arise from the smaller aggregates used in PC-Com, as well as the paste drain down present in most PC-Com samples which served to improve particle bonding. However, the compressive strength of CRP was substantially higher than the conventional permeable concretes. In fact, the compressive strength of CRP is about twice that of PC-Lab or PC-Com at similar porosity. This is attributed to higher cement paste content, the modified pore distribution and the lack of coarse aggregate in CRP.
According to the Design Manual for Roads and Bridges (Citation2015), the characteristic compressive strength for pavements used in highways should reach at least 25 MPa before opening to traffic. All of the CRP apart from the 30% porosity sample have achieved 28-day compressive strength values that are much greater than 25 MPa. In contrast, conventional permeable concretes typically have strengths lower than 25 MPa, as shown in , which is consistent with findings from other studies (Meininger Citation1988, Wang et al. Citation2006, NRMCA Citation2009, Kevern et al. Citation2010, Sumanasooriya et al. Citation2012, Sumanasooriya and Neithalath Citation2011, Ibrahim et al. Citation2014).
3.2. Flexural strength
As shown in , the flexural strength for CRP ranged from 1.9–4.4 MPa for porosities ranging from 4 to 30%. Flexural strength was inversely proportional to porosity as expected, and was substantially lower than compressive strength. Decreasing the diameter and number of vertical tubes led to improved interlocking and this meant that fracture has to propagate through a thicker mortar matrix, thus increasing strength. Nevertheless, the flexural strength of CRP was only 5–13% of its compressive strength. In contrast, the flexural strength of conventional concrete is about 10–15% of its compressive strength (Raphael Citation1984).
A number of studies have investigated the mechanical properties of conventional permeable concrete (PC) pavements. The flexural strength of PC generally ranges from 1.0–3.8 MPa (Tennis et al. Citation2004). Chandrappa and Biligiri (Citation2018) found flexural strengths of 1.5–3.2 MPa for PC with porosities of 23–30%. Ibrahim et al. (Citation2014) reported flexural strengths of 0.4–2.2 MPa for PC with 30–42% porosity. According to Mahalingam and Mahalingam (Citation2016), flexural strength ranged from 1.9–3.2 MPa for PC with 21–28% porosity depending on the aggregate gradation and a/c ratio. Nassiri and AlShareedah (Citation2017) reported 28-day flexural strength of 1.8–2.8 MPa for PC with 20–30% porosity. Therefore, the flexural strength of CRP is slightly higher than that of conventional PC of similar porosity. This may be due to the different pore structure and lack of coarse aggregate particles in CRP.
Flexural strength is an important design parameter for PC pavements, but the test is sensitive to sample preparation, curing procedure and damage during handling. As such, many highway agencies suggest the use of compressive strength testing for quality assurance of concrete pavements (NRMCA Citation2000). It is also common to use empirical relationships derived from conventional concrete, to estimate flexural strength from compressive strength for use in pavement design (Tennis et al. Citation2004). But it is unclear whether these equations are applicable to CRP. To address this, presents the correlation between flexural and compressive strength for CRP. Non-linear regression found that the best-fit power model is in the form of fr = 0.284 fc2/3 . This is compared against the relationships proposed by ACI 318 (Citation2002) (fr = 0.62 fc0.5 ), BS EN 1992 (Citation2014) (fr = 0.342 fc2/3 ) and BS 8110 (Citation1997) (fr = 0.6 fc0.5 ) for conventional concrete. It can be seen that these equations tend to over-estimate the flexural strength of CRP. Clearly, more data is needed for a thorough evaluation.
Figure 4. Correlation between 28-day flexural and compressive strength for CRP. The relationships proposed by ACI 318, BS 8110 and BS EN 1992 for conventional concrete are shown as reference.
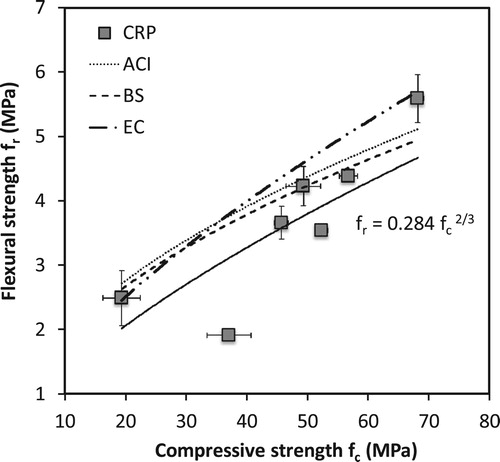
ACI 325 (Citation1991) states that the 28-day flexural strength for pavements should reach 3.9 MPa before opening to traffic. This is consistent with the recommendation by the Virginia Department of Transport (Citation1997) of 3.5 MPa. It is interesting to note that all of the CRP samples with porosity < 20% satisfy this criteria. In contrast, conventional permeable concretes typically have flexural strength lower than 3.5 MPa (Ibrahim et al. Citation2014, Chandrappa and Biligiri Citation2018, Mahalingam and Mahalingam Citation2016, Nassiri and AlShareedah Citation2017).
3.3. Permeability of unclogged PC
The correlation between original (unclogged) permeability and porosity of PC-Lab, PC-Com and CRP is demonstrated in . Permeability varied across an order of magnitude from 0.1–1.7 cm/s for conventional PC, and from 0.6–11.9 cm/s for CRP. As was expected, permeability increased with porosity. Furthermore, there is a strong linear relationship between permeability and porosity for CRP (R2 of 0.99). This suggests that the initial permeability of CRP can be estimated from the measured porosity. It should be noted that the error bars are small and not visible in . This shows that there is no significant variation between replicate permeability values and that the mean value can therefore be taken as representative.
Figure 5. Relationship between permeability and porosity for conventional permeable concrete (PC-Lab, PC-Com), and high-strength clogging resistant permeable pavement (CRP).
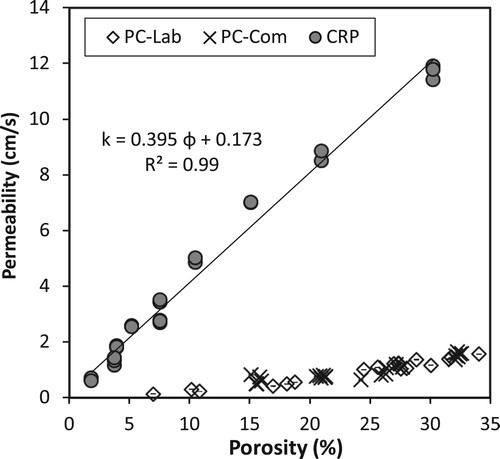
For similar porosities, the permeabilities of CRP were about an order of magnitude larger than that of PC samples. The permeability of the densest CRP (< 5% porosity) were as high as the permeability of the most porous PC tested (> 30% porosity). Therefore, CRP can be engineered with low porosity and very high strength (> 50 MPa), yet with equal flow performance to conventional PC. This striking behaviour can be explained by differences in the pore structure. The pores in conventional PC have a complex structure with variable cross-sections and random interconnectivity. The pores are highly tortuous and heterogeneous. Tortuosity is related to the inverse of connectivity, and usually defined as the ratio of actual flow path length to the straight distance between the ends of the flow path (Bear Citation1988). Pores in conventional PC produce large tortuosity (> 1), the exact value varies depending on flow path. Conversely, CRP has a homogenous pore structure of constant cross-section and tortuosity of 1. Therefore, flow occurs much faster through CRP compared to conventional PC, resulting in substantially higher permeability.
3.4. Estimating permeability from pore structure
Considering that the pore structure of CRP consists of simple straight cylindrical tubes of constant cross section, it would be interesting to explore if the permeability can be calculated from first principle thereby avoiding the need for testing. One approach is to combine Darcy’s law with Hagen–Poiseuille’s equation. Darcy’s law (Equation 4) relates permeability (k, m/s) to volumetric flow rate (Q, m3/s), hydraulic gradient (i) defined as the ratio of hydraulic head to sample thickness (), and cross-sectional area of the porous medium (A, m2).
(4)
(4)
Hagen–Poiseuille’s equation (Equation 5) describes the laminar flow of incompressible Newtonian fluid through a tube of constant circular cross section, with length substantially longer than the diameter, and with no acceleration of fluid in the tube:(5)
(5) where Q is volumetric flow rate (m3/s), R is radius of the cylindrical pipe (m), ρ is the fluid density (1000 kg/m3), g is the gravitational acceleration (m/s2), Δh is the change in hydraulic head (m), μ is dynamic viscosity of fluid, (0.001 Pa s for water) and L is the length of the tube. Combining Equations (4) and (5) for n number of tubes in a sample gives:
(6)
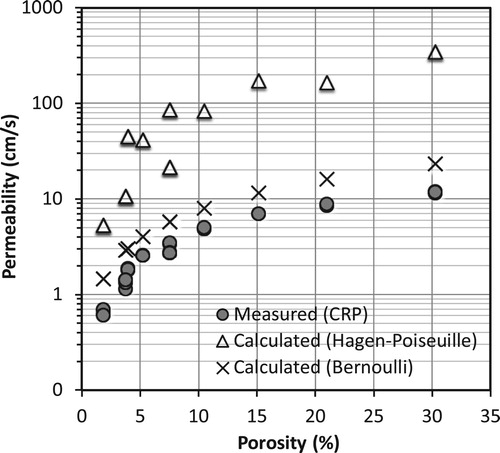
(6) where φ is the sample porosity (= n π R2/A). The results presented in show that Equation (6) over-estimates the measured permeability by a substantial margin ranging from 8x to 30x difference. The error increases with porosity. One possible explanation is that the Hagen–Poiseuille equation tends to fail for low viscosity fluids in wide and/or short tubes (Sutera and Skalak Citation1993, Kirby Citation2010). For short tubes, the Hagen–Poiseuille equation gives unrealistically high flow rates and therefore overestimates permeability. In such a case, the flow rate should be bounded by Bernoulli’s principle instead:
(7)
(7)
Figure 6. Comparison between falling head permeability for CRP and calculated permeability using Hagen–Poiseuille and Bernoulli’s equations.
Combining Equations (4) and (7) gives:(8)
(8)
shows that Equation (8) also over-estimates measured permeability, but with a much improved agreement compared to Equation (6). The error is about a factor of 2 at most. At large porosities (≥ 15%), the error increased slightly, which could be attributed to the flow regime being close to or within the transitional region (discussed in Section 3.5). Nevertheless, Equation (8) will serve as a basic guide for designers to estimate the permeability of CRP from known porosity (φ). It should be noted that the permeability of conventional permeable concrete (PC-Lab and PC-Com) can be estimated from pore structure using a Kozeny-Carman type equation as discussed in an earlier publication (Kia et al. Citation2018).
3.5. Flow regime
Darcy’s law, Hagen–Poiseuille and Bernoulli’s equations for determining permeability assumes laminar flow and all are invalid in the event that the flow becomes turbulent. However, high flow rates occur when testing hydraulic conductivity of CRP and this might induce turbulent flow. In order to check this assumption, the Darcy-Weisbach equation (Cengel and Cimbala Citation2006) was applied to determine the flow regime inside CRP as follows:(9)
(9) where fD is the friction factor and Re is the Reynolds number (Cengel and Cimbala Citation2006) defined as:
(10)
(10) where ρ is the fluid density (1000 kg/m3), v is the mean flow velocity (m/s) obtained by multiplying the measured permeability (k, m/s) by hydraulic gradient (i), D is the diameter of the cylindrical tube (m) and μ is fluid dynamic viscosity (0.001 Pa s for water).
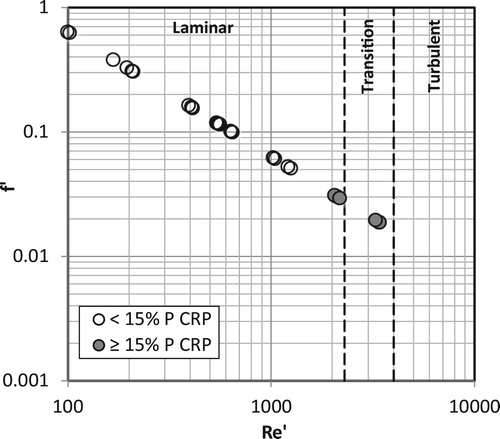
It should be noted that flow in CRP occurs through small tubes at a very fast rate, unlike seepage flow in conventional permeable pavements. Therefore, the flow in CRP is best modelled as flow through pipes. The flow through a circular pipe is typically laminar when Re ≤ 2300, turbulent when Re ≥ 4000 and transitional in between (Cengel and Cimbala Citation2006). The results presented in show that the flow regime in all CRP, except the 30% P samples, were within the laminar region. The 15% P and 21% P samples were close to the transitional regime, and this could have contributed to the high calculated permeability (). The flow regime through PC-Lab and PC-Com samples was discussed extensively in Kia et al. (Citation2018).
Figure 7. Determining the flow regime for CRP from the Darcy friction factor fD and Reynold’s number Re calculated from falling head permeability.
3.6. Effect of clogging on permeability
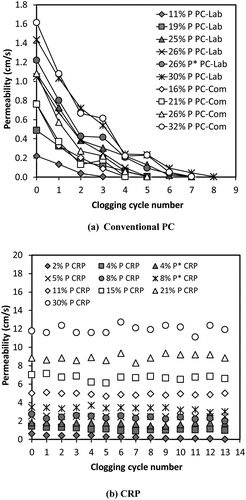
(a) and (a) show the effect of clogging on permeability for all conventional permeable concretes (PC-Lab and PC-Com) subjected to the combined S and C loading or alternate S/C loading. For all samples, the highest permeability occurred initially, but permeability decreases at an exponential rate with increasing number of clogging cycle. This is caused by blockage of pores by sediments that consequently decreases porosity and increases tortuosity. This occurred even for the most porous PC samples (32% P). Complete clogging occurred after a number of cycles, the exact number was dependant on the porosity of a particular sample and the clogging method used. A more rapid loss of permeability was observed in the combined S and C clogging method as there was a simultaneous application of both sand and clay in each cycle. In the combined S and C loading, complete clogging occurred after 3–7 cycles, as opposed to 3–8 cycles for alternate S/C loading.
Figure 8. The permeability of (a) conventional permeable concrete and (b) clogging resistant permeable pavement exposed to combined ‘sand & clay’ loading.
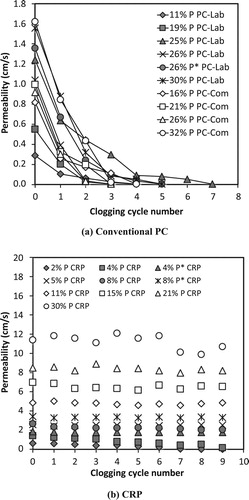
Figure 9. The permeability of (a) conventional permeable concrete and (b) clogging resistant permeable pavement exposed to alternate ‘sand/clay’ loading.
Low porosity (11% and 19%) PC samples clogged rapidly as a result of smaller pore volume and size as well as higher tortuosity. This encourages trapping of solid particles within the pore structure leading to accumulation. Samples that were affected by paste drain down also clogged rapidly due to blockage of the pore structure leading to poor infiltration capacity. In cases where VMA was added to the same mix in order to mitigate paste drain down, the resulting samples both demonstrated higher initial permeability and were able to withstand a higher number of loading cycles before becoming fully clogged. The clogging behaviour of PC-Lab and PC-Com samples of equivalent porosity was similar and they withstood about the same number of cycles before becoming fully clogged.
(b) and (b) show that the effect of cyclic clogging on CRP is very different compared to conventional PC. The majority of CRP showed no reduction in permeability despite extensive exposure to sediments over many clogging cycles. The samples showed similar behaviour when subjected to combined S and C loading or alternate S/C loading. This highlights the effectiveness of CRP in resisting clogging, which is attributed to the engineered pore structure that consists of vertical channels with tortuosity of 1 and no constrictions. This enabled particulates to flow through without being trapped within the pore structure. It is also interesting to note that some CRP with porosity as low as 4% did not clog, despite the fact that they had similar initial permeability to conventional PC at 32% porosity. This suggests that low tortuosity and lack of constrictions (constant pore cross-section) are the governing factors that influence clogging.
As expected, the permeability of CRP with extremely low porosity (2%) decreased with cyclic loading. Combined S and C loading produced full clogging after 8 cycles. In contrast, the alternate S/C loading caused complete clogging after 13 cycles. Similarly, the 4% P CRP sample clogged after 9 cycles of the combined S and C loading only. This was attributed to the small diameter of the pores (3 mm) combined with the presence of only a small number of pore channels in these samples. When the number of pores increased at constant 3 mm diameter, such as the 8% P sample (84 × 3 mm tubes), full clogging was not observed. In addition, clogging was avoided in low porosity samples by incorporating larger tubes. For example, the 4% P* CRP prepared using 11 × 6 mm tubes () did not clog in either combined S & C or alternate S/C loading. It is also worth noting that samples with similar porosity but larger pore size gave higher permeability. For example, the permeability of 8% P* (21 × 6 mm) was 50–60% higher than that of 8% P (84 × 3 mm) at the end of the cyclic clogging experiments.
3.7. Visual assessment of clogging
Visual inspection during combined S and C loading for conventional PC and low porosity (≤ 4%) CRP found that initially sand particles retain on the top surface (PC and CRP) or within the first quarter of the sample (PC), while the majority of the clay passes through. The amount of retention increases with each subsequent cycle up to the point at which full clogging is achieved. The clay is well mixed into the slurry before this is applied, but even so, flocculated clay tends to attach onto the surface of sand particles, which will then bond and form a thick layer on the sample (e.g. (a)). This layer increases in thickness the greater the number of clogging cycles the sample has been subjected to. For CRP with porosity ≥ 8%, most of the sand and clay passed through with very little sand accumulating on the top surface ((b)). The degree of retention is dependent on sample porosity as well as sediment size relative to pore size, so that samples with large pores or greater number of tubes have far less sand accumulation.
Figure 10. Deposition of sediments on CRP: (a) low porosity samples (≤ 4%) show flocculated clay adhering on to surface of sand particles; (b) high porosity samples (≥ 8%) show little accumulation of sand or clay; (c) no blockage in samples with large pore diameters (5 or 6 mm); (d) sediment accumulation on samples with small pores (3 mm).
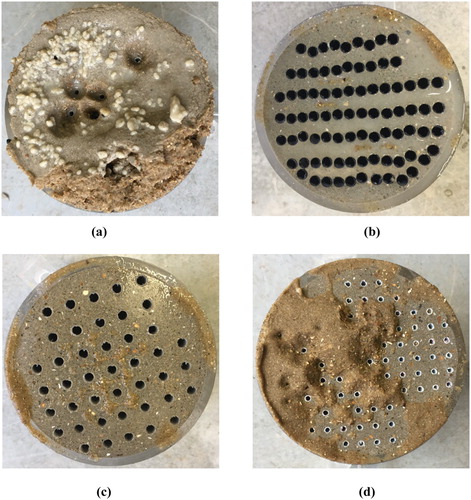
For S/C loading, the nature of the top layer was related to the cycle in which full clogging took place. A layer of sand was seen to form on the top surface of the sample in cases where clogging occurred during an odd cycle number. However, a layer of both clay and sand was observed on the top surface of the sample in those cases where clogging occurred during an even cycle number. CRP with large pores (5 and 6 mm) did not show any pore blockage ((c)), and accumulation of sediments was only observed on the surface of a small number CRP with 3 mm pores ((d)). Dismantling the samples after the tests showed that there was very little clay particles present in the sample. This suggests that in cases where clay is well-dispersed in water, it will simply pass through the sample, doing very little to bring about clogging unless it becomes flocculated and accumulates either inside the sample or on its top surface. Therefore, the actual deposition pattern is largely dependent on the exposure and particle size relative to the pore size (Kia et al. Citation2018).
4. Delivering CRP on site
So far this paper has presented the development, preparation and performance evaluation of CRP through small-scale laboratory samples. In order for this novel concept to be a truly successful innovation, it is also necessary to examine the means by which CRP can be scalable and delivered on site. The use of highly flowable self-compacting mortar will facilitate this, but formation of the vertical pore channels of low tortuosity remains a challenge. Here, we briefly discuss several possible methods that are currently being investigated for further development.
One approach relies on the use of a grid of solid channels that is filled with self-compacting mortar. Subsequently, the grid is dissolved leaving vertical pore channels in the hardened mortar. The challenge is to engineer the grid such that it has sufficient initial strength and rigidity, yet can be easily and fully dissolved. There is also a need to ensure that the process does not cause groundwater contamination or clogging of the aggregate sub-base layer.
Another approach, which is a variation of the method described above, involves placing a grid of vertical hollow tubes ((a)) directly on the aggregate sub-base layer. Self-compacting mortar is then poured over the grid to the required pavement thickness and the grid is buried permanently in the hardened mortar ((b,c)). The advantage of this method is its simplicity and scalability. The flexible membrane supporting the tubes prevents clogging of the sub-base layer with self-compacting mortar. Once the mortar has set, any protruding tubes can be cut down flush to the mortar surface using a hot wire device. This process will be very quick, and easy to perform whilst resulting in a smooth surface finish ((c)).
Figure 11. Possible site delivery methods for clogging resistant permeable pavement: (a–c) grid supporting vertical hollow tubes cast in self-compacting mortar; (d–f) grid of protruding rigid pins fitted with plastic tubes and cast in self-compacting mortar. The pins are subsequently lifted and reused.
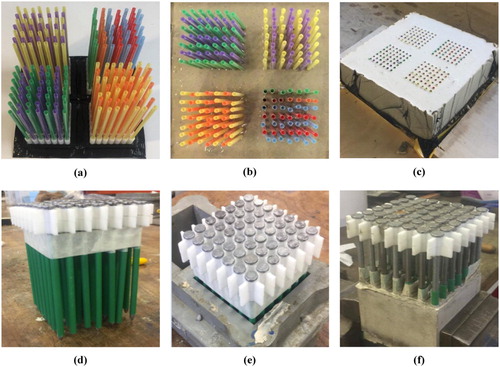
The third approach consists of a grid of protruding rigid pins, where each pin is fitted with a plastic tube that is cast into self-compacting mortar ((d–f)). The pins should be pushed into the aggregate sub-base to avoid blockage of the tubes with self-compacting mortar. The grid is then lifted and reused, leaving behind the embedded tubes to form vertical channels. This method can be scaled up to lift large grids. It is also proposed that these grids would interlock and stack vertically enabling a large number to be transported and positioned on site.
Clearly, more work is needed to evaluate the feasibility of these approaches and to carry out a detailed cost-benefit analysis. The material cost for CRP can be optimised by decreasing pavement thickness to exploit its higher compressive and flexural strengths. The deployment and installation costs are largely unknown now and these will be highly dependent on the chosen delivery method and economies of scale. However, the long-term operational cost of CRP is expected to be lower than conventional permeable pavements as it requires less maintenance over time. Furthermore, CRP is expected to be more durable and have longer service lives, hence lowering lifetime costs and promoting sustainability. Research on these issues is ongoing and we endeavour to report the findings in future publications.
5. Conclusions
A new type of permeable pavement that is resistant to clogging, yet achieves high permeability and compressive strength that can be poured on site has been developed. This high-strength clogging resistant permeable pavement (CRP) was tested against a wide variety of conventional laboratory prepared and commercially available permeable concrete (PC) samples. Some of the key test variables were aggregate particle size (1.25–14 mm), pore diameter (3–6 mm), effective porosity (2–32%) and clogging method (combined sand and clay, or alternate sand/clay). The main findings are:
CRP can be cast on-site to achieve uniform pore structure at low tortuosity ( = 1). It retains high porosity and permeability for storm-water to infiltrate throughout, while having high compressive strength suitable for use in heavily loaded pavements.
Compressive strength of CRP varied from a low of 19 to a high of 59 MPa compared to 6–32 MPa for conventional PC. At equivalent porosity, the compressive strength of CRP is about twice that of conventional PC. This is due to the higher cement paste content, the porosity distribution and the lack of coarse aggregate in CRP. Flexural strength of CRP ranged from 1.9–4.4 MPa.
Initial permeability of CRP ranged from 0.6–11.9 cm/s compared to 0.1–1.7 cm/s for conventional PC. At equivalent porosity, the permeability of CRP is about an order of magnitude greater than conventional PC. This is attributed to the homogenous and low tortuosity pore structure of CRP.
All conventional PC experienced reduction in permeability and complete clogging after 3–8 cycles of exposure to sediments, this was dependent on the porosity of individual samples and the exposure method used. The combined sand and clay method resulted in a more rapid degradation of permeability. However, CRP with porosity of 5% and above showed no reduction in permeability despite exposure to sediments over many cycles. This is attributed to the pore structure that consists of vertical channels with tortuosity of 1, with no constrictions.
CRP can be engineered with low porosity (5%) to achieve high compressive strength (> 50 MPa) and high permeability (> 2 cm/s), but does not clog despite extensive cyclic exposure to flow containing sand and clay. The deployment of a high-strength clogging resistant permeable pavement will reduce the need for time consuming and expensive maintenance, a significant advantage over conventional permeable pavements, which will reduce the long-term operational cost of the system.
Permeability of CRP has a strong linear relationship with porosity (R2 of 0.99). Furthermore, a simple method that combines Darcy’s law and Bernoulli’s equation is able to estimate the permeability of CRP to within a factor of two. This suggests that the permeability of CRP can be modelled from the pore structure.
Several potential methods for large-scale on-site delivery of CRP were trialled in a laboratory setting, each of these will require a degree of further evaluation and testing prior to commercial use. It is anticipated that the innovations from this research will enable the wider deployment of CRP in a range of different projects and settings for which it would not previously have been considered suitable. This will greatly enhance the ability of engineers and urban planners to mitigate against urban flooding and in the long term will allow the design and deployment of a new generation of flood resistant infrastructure.
Acknowledgements
We acknowledge Mr. Lewis Hornby’s contribution in the development of site delivery options for CRP. We thank Mr. Andrew Morris and Ms. Varvara Pozoukidou for their assistance with the laboratory work.
Disclosure statement
No potential conflict of interest was reported by the authors.
Additional information
Funding
Related Research Data
References
- ACI Committee 318, 2002. Building code requirements for reinforced concrete and commentary. American Concrete Institute.
- ACI Committee 325, 1991. Guide for construction of concrete pavements and concrete bases. American Concrete Institute, Report number: ACI 325.9R-91.
- Bear, J., 1988. Dynamics of fluids in porous media. New York: American Elsevier.
- British Standards Institution, 1997. BS 8110-1:1997. Structural use of concrete. Code of practice for design and construction.
- British Standards Institution, 2009a. BS EN 12390-3:2009. Testing hardened concrete, part 3: compressive strength of test samples.
- British Standards Institution, 2009b. BS EN 12390-5:2009. Testing hardened concrete, part 5: flexural strength of test specimens.
- British Standards Institution, 2014. BS EN 1992-1-1:2004+A1:2014. Design of concrete structures, part 1-1: general rules and rules for buildings.
- Cengel, Y. A. and Cimbala, J. M., 2006. Fluid mechanics: fundamentals and applications. New York: McGraw-Hill.
- Chandrappa, A.K. and Biligiri, K.P., 2018. Investigation on flexural strength and Stiffness of pervious concrete for pavement applications. Advances in Civil Engineering Materials, 7 (2), 223–242. doi: 10.1520/ACEM20170015
- Coughlin, J.P., Campbell, C.D., and Mays, D.C., 2012. Infiltration and clogging by sand and clay in a pervious concrete pavement system. Journal of Hydrologic Engineering, 17 (1), 68–73. doi: 10.1061/(ASCE)HE.1943-5584.0000424
- Deo, O., Sumanasooriya, M., and Neithalath, N., 2010. Permeability reduction in pervious concretes due to clogging: experiments and modeling. Journal of Materials in Civil Engineering, 22 (7), 741–751. doi: 10.1061/(ASCE)MT.1943-5533.0000079
- Design Manual for Roads and Bridges, 2015. Pavement design and construction: pavement construction methods. Report Number: HD 27/15.
- Ibrahim, A., et al., 2014. Experimental study on Portland cement pervious concrete mechanical and hydrological properties. Construction and Building Materials, 50, 524–529. doi: 10.1016/j.conbuildmat.2013.09.022
- Kevern, J.T., Wang, K., and Schaefer, V.R., 2010. Effect of coarse aggregate on the freeze-thaw durability of pervious concrete. Journal of Materials in Civil Engineering, 22 (5), 469–475. doi: 10.1061/(ASCE)MT.1943-5533.0000049
- Kia, A., Wong, H. S., and Cheeseman, C. R., 2017. Clogging in permeable concrete: a review. Journal of Environmental Management, 193, 221–233. doi: 10.1016/j.jenvman.2017.02.018
- Kia, A., Wong, H. S., and Cheeseman, C. R., 2018. Defining clogging potential for permeable concrete. Journal of Environmental Management, 193, 221–233. doi: 10.1016/j.jenvman.2017.02.018
- Kirby, B.J., 2010. Micro- and nanoscale fluid mechanics: transport in microfluidic devices. Cambridge, UK: Cambridge University Press.
- Mahalingam, R. and Mahalingam, S.V., 2016. Analysis of pervious concrete properties. Gradevinar, 68 (6), 493–501.
- Mata, L.A. and Leming, M.L., 2012. Vertical distribution of sediments in pervious concrete pavement systems. ACI Materials Journal, 109 (2), 149–155.
- Meininger, R.C., 1988. No-fines pervious concrete for paving. Concrete International, 10 (8), 20–27.
- Nassiri, S. and AlShareedah, O., 2017. Preliminary procedure for structural design of pervious concrete pavements. Washington State Department of Transportation, Report number: T1462, Task 18 WA-RD 868.2.
- National Ready Mixed Concrete Association (NRMCA), 2000. Flexural strength concrete. Report Number: CIP16.
- National Ready Mixed Concrete Association (NRMCA), 2009. Pervious concrete: experimental validation of mixture proportioning methodology. National Ready Mixed Concrete Association (NRMCA), Report Number: 2PE001.
- Raphael, J.M., 1984. Tensile strength of concrete. ACI Journal, 81 (2), 158–165.
- Sumanasooriya, M.S., Deo, O., and Neithalath, N., 2012. Particle packing-based material design methodology for pervious concretes. ACI Materials Journal, 109 (2), 205–213.
- Sumanasooriya, M.S. and Neithalath, N., 2011. Pore structure features of pervious concretes proportioned for desired porosities and their performance prediction. Cement and Concrete Composites, 33 (8), 778–787. doi: 10.1016/j.cemconcomp.2011.06.002
- Sutera, S.P. and Skalak, R., 1993. The history of Poiseuille’s law. Annual Review of Fluid Mechanics, 25, 1–19. doi: 10.1146/annurev.fl.25.010193.000245
- Tennis, P.D., Leming, M.L., and Akers, D.J., 2004. Pervious concrete pavements. Portland Cement Association, Report Number: EB302.02.
- Tong, B., 2011. Clogging effects of Portland cement pervious concrete. MSc thesis. Iowa State University.
- Virginia Department of Transportation, 1997. Road and bridge specifications. Richmond, VI: Richmond Publishers.
- Wang, K., et al., 2006. Development of mix proportion for functional and durable pervious concrete. In: Proceedings of the 2006 NRMCA concrete technology forum – focus on pervious concrete, 23–24 May. Nashville, TN. National Ready Mixed Concrete Association.
- Yong, C.F., McCarthy, D.T., and Deletic, A., 2013. Predicting physical clogging of porous and permeable pavements. Journal of Hydrology, 481, 48–55. doi: 10.1016/j.jhydrol.2012.12.009