
ABSTRACT
Road agencies employ different criteria and methods to compare treatment alternatives and develop maintenance and rehabilitation (M&R) programmes for their networks. The maximisation of benefits has been integrated in several leading pavement management systems and used for network-level programming since the 1980s. The approach defines benefit as the area between the performance curves with and without M&R actions based on an aggregated index, representing the overall pavement condition. Further simplifications like the screening of solutions using an efficiency frontier and the incremental benefit–cost technique have made it possible to apply the method with the available computing power at the time. Based on a case study of 1000 road sections, this paper analyses the effect of benefit maximisation on annual budget, network condition, treatment selection, trigger values and remaining life. M&R programmes minimising costs and maximising benefits are compared at the project and network level for various budget scenarios. The results show that the maximisation of benefits based on an aggregated condition index leads to substantially higher agency costs and favours the selection of expensive treatments with earlier timing, irrespective of actual failure causes. The conclusions of this work may be useful to road agencies in developing more efficient budget-allocation polices.
1. Introduction
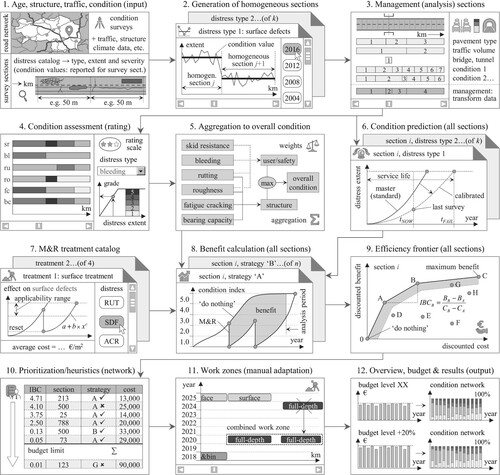
Network-level pavement management systems (PMSs) have been in operation since early 1980s in the USA and around 2000 in German-speaking countries, assisting road agencies with the development of maintenance and rehabilitation (M&R) programmes, cost estimations and budgeting. An overview of typical modules and workflow in a widely used PMS together with the different stages of data processing and analysis are illustrated in . The entire process is based on aggregating data from periodic condition surveys with treatment impact and costs into a comprehensive decision-making criterion on the foundation of cost-effectiveness analysis. The results of the surveys are reported for short survey sections (50 m) which are then aggregated to condition-homogeneous sections and management sections to facilitate the processing and analysis of the data (Weninger-Vycudil et al. Citation2009, Lea et al. Citation2014, Haas et al. Citation2015).
Figure 1. Overview of data-processing flow and sequence of computations from input to output in a common PMS.
For these management sections, different M&R strategies are evaluated and compared in terms of costs and benefits. Benefit (or effectiveness) is defined as the area enclosed between the do-nothing performance curve and the post-treatment curve. Sometimes this area is multiplied by traffic volume and section length. To obtain a one-dimensional measure of benefits, the different distress types have to be aggregated into a composite condition index like, e.g. the overall condition index (OCI) or the present serviceability index (PSI). At the network level, heuristic methods such as the incremental benefit–cost (IBC) technique, ranking approaches (worst first) or mathematical programming are usually employed for the final selection of M&R strategies (Haas et al. Citation2015).
This paper examines the effect of setting different network-level objectives (minimise life cycle costs vs. maximise benefits) on the resulting budget needs, condition distribution, remaining life and asset value for various budget scenarios. It is also investigated, if the different objectives favour specific M&R treatment types or trigger values (early vs. late timing). The comparison is based on numerical examples under ceteris paribus conditions, allowing to separate and quantify the impact of distinct computational steps in PMSs on the results. The paper focuses on the benefit-maximisation approach due to its wide application in existing PMSs used by road agencies and the lack of comprehensive discussion in the literature. A comparison to other (more advanced) optimisation methods mainly from the literature is beyond the scope of this paper.
The following section (Section 2) provides an overview of selected literature on benefit maximisation with description of the method. The parametric case study, performance and cost models in Section 3 define the basis for application and comparison of the investigated optimisation approaches. Section 4 presents network-level M&R programmes developed for different optimisation goals and various budget scenarios, together with the resulting condition distributions and annual budget needs. The last section contains the conclusions.
2. Literature and methods
The pavement management optimisation problem can be formulated for single sections (project level) and at the network level. At the project level, the goal is to determine the temporal sequence of M&R treatments (timing and type) that minimises agency costs or maximises benefits for a given time period. At the network level, however, it may not always be possible to implement the optimal strategy for each section due to budget restrictions. A sophisticated network-level approach should also consider interdependencies between different road sections and other assets in terms of economies-of-scale costs, capacity utilisation and work-zone effects. Hence, the network level problem is a very complex one, with three categories of approaches being available: ranking, heuristic techniques (e.g. IBC) and optimisation.
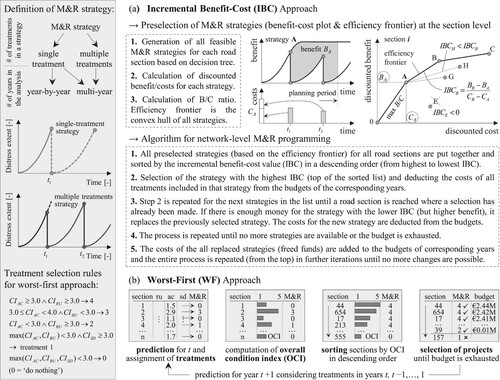
Ranking is very simple and intuitive but also the most rudimentary approach for development of M&R programmes at the network level which can be applied to a small road network even without a computer. Apart from their historical significance for pavement management, ranking methods are still being used by some agencies at regional level and in developing countries. Ranking of road sections by current condition, also known as worst-first (WF) approach, is the most common ranking method. The decision which road sections should be repaired in any given year is made according to the current condition, assigning treatments first to the worst-performing section and subsequently moving down in the sorted list until the budget is exhausted (FHWA Citation1998, Javed Citation2011, Menendez et al. Citation2013). To include other decision criteria, several authors have developed composite priority indices, considering multiple factors like condition, traffic volume, functional class, drainage, etc. (e.g. Shah et al. Citation2014). The WF approach does not require condition prediction and does not consider treatment effects. Moreover, the method is suited to compare different projects (sections) but not different treatment alternatives for the same project (only ‘where’, not ‘what/when’). Therefore, the M&R type is usually determined based on trigger rules or decision trees. In this work, the WF approach is used to develop a multi-year M&R programme on a year-by-year basis, providing a basis for comparison with other methods (see (b)). Using the predicted individual distress types in a given year, an M&R strategy, including the do-nothing alternative, is determined for each section. The sections are then sorted according to OCI and the highest-ranked projects that would still fit the budget are selected. The procedure is repeated sequentially for each year in the planning period, whereby the planning period is the time period in which M&R treatments can be planned.
Figure 2. Common methods for network-level project prioritisation and budget allocation in PMS: incremental benefit-cost approach (a) and worst-first approach (b).
More advanced incremental benefit–cost (IBC) or marginal cost-effectiveness (MCE) methods have been implemented in a few commercial off-the-shelf software products and used by many road agencies for decades. The history of the IBC approach goes back to the early years of pavement management (Juster and Pecknold Citation1976, Haas et al. Citation1985, Shahin et al. Citation1985). The method is integrated in pavement management systems like dTIMS – Deighton total infrastructure management system (Keleman et al. Citation2008, Zavitski et al. Citation2008), the Austrian VIAPMS (Weninger-Vycudil Citation2001, Weninger-Vycudil et al. Citation2009) and the PMS software in Germany (Maerschalk and Socina Citation2008), with the latter two being based on dTIMS. The highway development and management model (HDM-IV) uses the IBC concept too, but relies on monetary benefits and user costs (Kerali and Mannisto Citation1999, Odoki and Kerali Citation2000). According to MDOT (Citation2019), the highway pavement management application (HPMA) also employs the MCE approach for selection of treatments. Furthermore, the IBC method is used in bridge management as well (e.g. Farid et al. Citation1994, Thomson et al. Citation1998).
The general idea of the IBC method is to consider a predefined set of M&R strategies for each road section and select the ones that maximise the sum of individual benefits over the planning period (typically 10 years), subject to annual budget constraints (Haas et al. Citation1994, AASHTO Citation2012). Thus, the method is superior to simple ranking, since it considers multiple treatment alternatives for the same section and future benefits in the network-level analysis. Multi-year M&R programmes can be developed using either year-by-year or multi-year analysis. If a strategy consists of multiple treatments, however, only multi-year analysis can be conducted, as such strategies have impact on multiple budget constraints.
(a) presents a rather verbal description of the methodology of the IBC approach. For each section different treatment strategies are generated using trigger rules. Although the effect of a treatment on each distress type is usually modelled and predicted separately, the individual distress types are ultimately combined into one composite condition index (like OCI), allowing for a single-objective formulation of the optimisation problem. The number of generated M&R strategies varies between sections and may become considerably large depending on the number of different treatments, trigger rules and the length of the planning period. Hence, before conducting the network-level evaluation, the number of possible strategies for each section has to be limited with the intention to reduce computing effort. This is done by using the efficiency frontier, that is, the convex envelope of all points (strategies) in the benefit–cost plot. IBC value is computed for each strategy as the ratio of difference in benefits to difference in costs between the strategy in question and a reference strategy. Only strategies on the efficiency frontier or within a tolerance margin are ranked as cost-effective and kept for further analysis.
At the network level, all strategies for all road sections are pooled together and ranked according to their IBC value. In contrast to ranking methods, however, the final programme usually does not consist of the sections on top of the list. In fact, the strategies at the bottom of the list provide the highest benefits, but their selection depends on the available budget(s). Due to the presence of an optimisation objective (maximisation of benefits), the IBC method may be classified as a heuristic technique for solving an optimisation problem. The algorithm for network-level prioritisation given in (a) can be found with some minor variations in the literature (Haas et al. Citation1994, FHWA Citation1998, Weninger-Vycudil Citation2001, Peng and Ouyang Citation2010, AASHTO Citation2012).
The IBC formulation can be solved exactly using binary integer mathematical programming (BIP). Integer formulations of the M&R optimisation problem are common in pavement management (Haas et al. Citation1994, Li et al. Citation1998, Ferreira et al. Citation2002, Wang et al. Citation2003, Scheinberg and Anastasopoulos Citation2010). A multi-year binary integer programme, minimising life cycle costs or maximising benefits is presented in (a). Each strategy is represented by a decision variable, taking the value of ‘1’ if selected and ‘0’ otherwise. The sum of the decision variables for all strategies on a given section must equal ‘1’, which guarantees that only one strategy can be selected per section. The resulting total costs in each year are limited by the budget constraint. In contrast to heuristic methods, BIP considers all possible combinations of strategies. If the cost and benefits of the optimal and suboptimal M&R strategies for each section are determined prior to the network level optimisation, then the optimisation problem is linear. Linear BIP can be solved efficiently for a relatively large number of decision variables (e.g. hundreds of thousands), using, for example, branch-and-cut algorithms (Hillier and Lieberman Citation2015).
Figure 3. Formulation of the network-level pavement management optimisation problem as a binary integer programme, simultaneously considering multiple budget years (a) or only a single year (b).
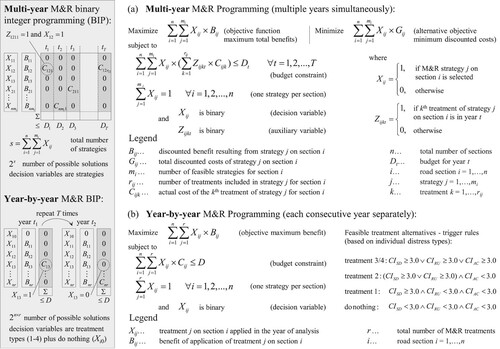
Multi-year programmes can also be developed on a year-by-year basis, using a single-year BIP formulation, as shown in (b). This approach is based on single-treatment strategies (see ), with the different treatment types, including ‘do nothing’, serving as decision variables. Prior to each consecutive optimisation run, feasible M&R treatments and benefits (condition prediction) for each alternative must be calculated based on the current condition. The single-year problem will be, in general, easier to solve, but the procedure must be repeated for each year in the planning period. Moreover, the solution of a single-year programme will be inferior to the solution of multi-year programming, since it does not simultaneously consider all possible combinations of treatments and potential trade-offs in the life cycle.
In this paper, the analysis focuses on the maximisation of only non-monetary benefits defined as the area between the curves based on an OCI. The reason for this is that common PMSs usually do not account for economic benefits in terms of user and environmental costs savings (Wu and Flintsch Citation2009). However, instead of maximising the area between the curves (condition), standard approaches can be extended to maximise economic benefits (cost savings). A possible formulation is to maximise user costs savings due to improved condition in comparison to a do-nothing or a do-minimum (base) strategy minus work-zone related user costs (Brozek et al. Citation2009). In addition, also the increased agency cost in comparison to base alternative can be considered in the objective function (Odoki and Kerali Citation2000). Both formulations are only possible as alternative to the benefit maximisation based on aggregated condition indices. It is possible, however to conduct a multi-objective optimisation with two or more objectives, one including user costs and one being the maximisation of benefits based on area between the curves and select a solution based on Pareto frontier (e.g. Yu et al. Citation2015).
In general, there is a gap in the literature regarding the systematic comparison and discussion of the approaches for condition rating, condition prediction and M&R optimisation employed in PMSs. Kuhn (Citation2012) compared optimal M&R policies developed using individual distress types versus a composite condition index and criticised any other use of aggregated indices in pavement management other than for communication with high-level decision makers. Gharaibeh et al. (Citation2010) compared six different aggregated indices based on distress data and concluded that even seemingly similar indices lead to significantly different rating of the same pavement sections. In the literature there are also several studies that evaluated different solution algorithms for the benefit-maximisation problem (e.g. Yoo and Garcia-Diaz Citation2008, Peng and Ouyang Citation2010, Patidar et al. Citation2011). In contrast, this paper questions the suitability of maximising benefits based on the area between the curves as an objective in pavement management.
3. Case study, performance and cost models
3.1. Service life and distress correlation
This paper presents a comprehensive analysis of the consequences arising from using benefit maximisation strategies in pavement management. Selected commonly-used optimisation approaches are applied to a case study of a simulated road network. The individual computational steps in the following analysis, the cost and performance models resemble the typical process in common PMSs. Moreover, each parameter of the case study is estimated based on real-world data, with more details on the calibration being given in Donev and Hoffmann (Citation2018a, Citation2018b). A simulation approach provides exact knowledge of service life and condition distribution at any point in time, avoiding limitations of empirical data like censoring and ex ante prediction. Therefore, complete data allows researchers to isolate, objectively quantify and compare the deviations resulting from the application of a specific approach.
The case study is based on 1000 road sections, each with a length of 50 m, which is the standard for survey sections in Austria and a width of 3.75 m, resulting in a total length of 50 lane-km. All inputs are calibrated and conceptualised for flexible pavements on freeways in Austria, even though the generated sections are not tied to a specific location or a specific Austrian freeway. (a,b) provides an overview of the three considered distress types (rutting, surface defects and alligator cracking), together with their respective service life distributions. Initial service life is defined as the time from construction until exceedance of a given distress-specific condition threshold. At the section level, the first distress exceeding its threshold determines the overall service life, the cause for failure (series system) and the latest possible timing of treatment application (boundary condition). In this work, a trigger value is defined as the condition or condition index at the time of the treatment application. If pavement condition is constrained only to non-failing states, the trigger value can be less than or equal to the threshold value, where a lower value corresponds to a better condition. It must be noted that the selection of thresholds and trigger values directly impacts the observed service life in practice and restricts the solution space in the optimisation (e.g. Ford et al. Citation2012). Much like the development of aggregated indices, the definition of condition threshold is often based solely on subjective expert opinions. This drawback can be mitigated, for example by using soft constraints, user costs or condition-dependent treatment life (Donev and Hoffmann Citation2018b).
Figure 4. Overall and distress-specific service life distributions (a, b) and performance functions (c, d, e) employed in the case study.
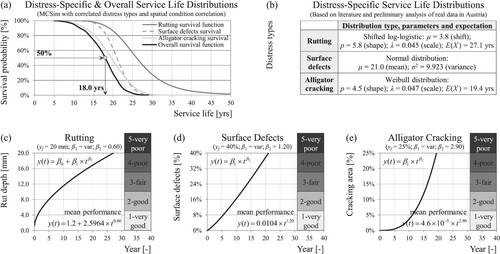
The service lives for these three distress types are positively correlated (distress correlation), as they are influenced by common factors like traffic loading. A set of three service lives (for each distress) is generated for each of the 1000 road sections. Performance functions with fixed power parameter (β2) are fitted to the individual service lives by varying the scale parameter (β1) to describe intermediate conditions. The employed power functions, as well as the corresponding rating scales for the computation of OCI are presented in (c,d,e). The scale for OCI ranges from 1.0 (very good) to 5.0 (very poor).
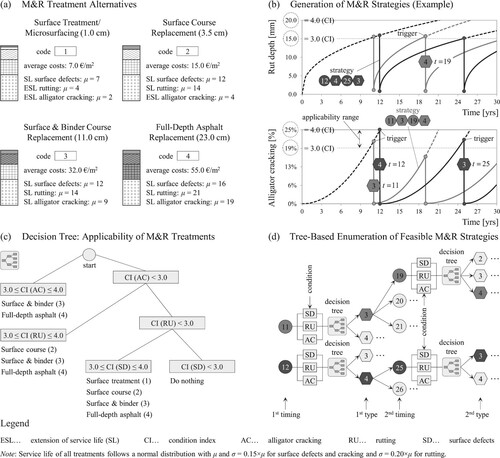
Figure 5. M&R treatment alternatives with average costs and service life (a), technical applicability based on decision tree (c) and generation of feasible combinations of treatment type and timing (M&R strategies) for a given road section (b, d).
More details on initial and post-treatment (see Section 3.2) service life distributions, on the estimated correlations and on the data generation procedure are offered in Donev and Hoffmann (Citation2018b). The focus here is not on the derivation of cost and performance models but on the definition of a realistic case study as basis for a comparison of different treatment selection and optimisation approaches. Different parameter values or distribution forms may change the exact numeric results more or less, but will not change the nature of the conclusions of this work, regarding the methodological drawbacks of the analysed approaches (see Section 4).
3.2. Costs and performance modelling
The application of methods for M&R prioritisation and optimisation to the case study data also requires the definition of treatment types, post-treatment service lives and treatment costs. Four different treatment types for asphalt pavements are considered, ranging from preventive maintenance (surface treatment) to full-depth asphalt replacement (see (a)). Each treatment is represented by an average unit cost, a distress-specific service life and an integer code from 1 to 4 for modelling purposes. The average unit cost estimates are based on analysis of empirical data from Austria and provided in 2016 constant euros. Furthermore, the average unit costs are computed for typical M&R project lengths. Economies-of-scale costs are not considered here to allow more clear interpretation of the results (cf. Irfan et al. Citation2012, Donev and Hoffmann Citation2018b, Qiao et al. Citation2019). The effect of a treatment on each distress type is modelled with distinct distribution. For the case study, it is assumed that treatment life follows a normal distribution with a mean value (μ) based on literature analysis (e.g. Hall et al. Citation2001, Cuelho et al. Citation2006, Anastasopoulos and Mannering Citation2015, Birbaum Citation2016, Nobakht et al. Citation2016). Similar to the initial service life, treatment life is defined as the time from the application of the treatment until the exceedance of the same distress-specific threshold. The effect ‘extension of service life’ (ESL) models a treatment effect which delays distress progression for a short period of time, without correcting the underlying problem.
The technical applicability of treatments is determined using the decision tree depicted in (c). The decision tree determines one or more treatment alternatives for any possible combination of distresses and their extent or severity. For consistency reasons, the extent is represented by a condition index (CI), which is a linear transformation to an uniform scale (see (c,d,e) for employed rating scales). For example, if the CI for alligator cracking is within the range from 3.0 to 4.0, two structural treatments (treatment 3 and 4) are feasible. The decision tree does not allow exceedance of condition thresholds for the individual distress types (CI ≤ 4.0), being an important boundary condition in the optimisation. If the condition indices of all distress types fall below 3.0, no M&R treatments are planned.
At the road section level, different temporal sequences of treatments (M&R strategies) are possible. Each feasible strategy defined by timings (integer) and types (integer) has to be evaluated in terms of cost and benefits. The generation of treatment strategies is based on an enumeration algorithm to ensure that all possible combinations are evaluated. A simplified example is presented in (b,d). The first year in which a treatment can be planed is year 11, as this is the first year with a CI exceeding 3.0. Feasible treatment alternatives are then determined for the predicted combination of distresses in year 11 using the decision tree. In the present example, only treatments 3 and 4 are viable alternatives, as the CI for alligator cracking exceeds 3.0. The selected treatment (in this case treatment 3) determines the performance after year 11 and the timing range for the next treatment (from year 19 to 21). If the next treatment is planned in year 19, three treatment alternatives become feasible according to the decision tree. Thus, the ordered sequence of pairs of treatment’s timing and type (11, 3; 19, 4) completely defines the strategy (in dark grey). (b,d) traces a second possible strategy (in black), starting from year 12 (i.e. 12, 4; 25, 3).
4. Consequences of applying benefit-maximisation strategies
This section presents the results from the application of the methods described in Section 2 to the case study data. First, all possible M&R strategies are generated for each of the 1000 road sections based on a decision tree, trigger rules and service lives (see ). The generation of strategies, as well as the computation of benefits and costs for each strategy is conducted automatically using a small add-in for Microsoft Excel written in Visual Basic for Applications (VBA) programming language. The number of single treatments in a strategy results from the requirement to always keep the condition within acceptable limits during the planning period. The planning period is set to 30 years as a compromise between typical periods for IBC analysis of 10–20 years and the aim of gaining some insights about the long-term effects of the M&R strategies. In any case, a true life cycle cost analysis in PMS will require a longer planning horizon (e.g. at least 50 years). A discount rate of 4% was selected for consistency with previous research. The case-study data produces 300 M&R strategies per section on average or approximately 300,000 strategies in total. provides a general overview of the computational steps in the case study, with the comparison taking place at the section level, at the network level with unlimited budget and, finally, at the network level with budget constraints. A comparison of M&R programmes without budgetary restrictions has little practical relevance with regard to the reality of limited agency budgets. Nevertheless, it is important from a theoretical point of view as it allows conclusions about the suitability of the defined optimisation goals.
Figure 6. Overview of major computational steps in the analysis as well as different levels of comparison and associated settings (1–5).
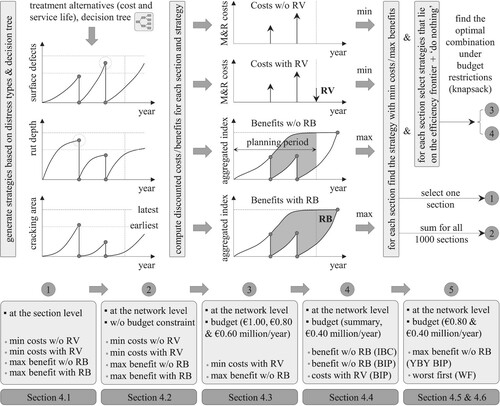
In the case study, four different objectives found in the literature are evaluated: maximisation of benefits with and without residual benefits and minimisation of costs with and without residual value. Residual benefit (RB) is the additional benefit area associated with a specific period (in this case 20 years) beyond the end of the planning period of 30 years (Weninger-Vycudil et al. Citation2009). The residual value (RV) at the end of the planning period is computed as a ratio of remaining life to service life of the last planned treatment multiplied by the cost of this treatment. RV is discounted and subtracted from the total life-cycle costs (Al-Qadi et al. Citation2009, Zuniga-Garcia et al. Citation2018).
4.1. Maximising benefits/minimising costs at the section level
The optimal strategies at the section level are found by a simple lookup in the tables of the generated strategies. If the budget constraint is not binding, the solution at the network level consists of the optimal solutions for each individual section. The solution of the unconstrained problem is also the overall best solution that can be achieved for the defined objective. The optimal strategies for a road section randomly-selected for illustration purposes (e.g. section 55) are displayed in . (a) shows the expenditure stream and benefit of the strategy that minimises total discounted costs without RV. This strategy minimises the costs strictly in the planning period without accounting for the network condition afterwards. Hence, such strategies may be of interest to investors in public-private partnership (PPP) projects. In this case, a small maintenance treatment in year 29 ensures that condition thresholds are not violated and the pavement holds until the end of the planning period. (b) depicts the strategy that minimises costs with RV. Such strategies will normally be desired by long-term oriented road agencies, as they do not push more expensive (structural) treatments behind the end of a considered or contracted planning period with substantial M&R backlogs thereafter.
Figure 7. Expenditure stream diagram and benefit calculation for strategies that minimise costs with/without residual value (a, b) and maximise benefits with/without residual benefits (c, d) for a given road section, together with benefit-cost plot and efficiency frontier as a basis for selection of strategies for network-level programming (e).
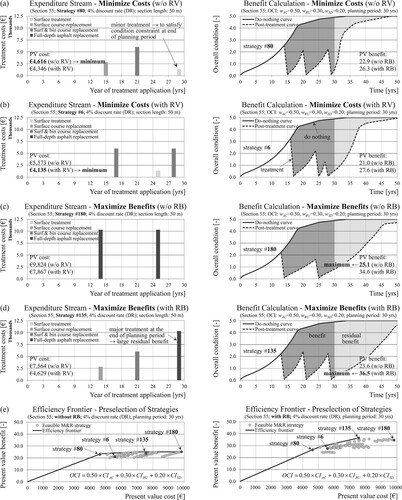
The strategy that maximises benefits without RB is shown in (c). In contrast to the previous two strategies, this strategy is composed solely of the most extensive (also the most expensive) treatment, as it produces a larger area between the curves. The objective of maximising benefits with RB (see (d)) has a reverse effect to the investments near the end of the planning period in comparison to the strategy of minimum costs without RV. The reason for this is that an additional treatment in the last years of the planning period generates a substantially larger RB area.
The post-treatment performance curves in reveal that treatments are applied before the overall condition reaches its threshold value of 4.0. This is due to the fact that treatments are triggered by the individual distress types, and the overall condition index is only used for the calculation of benefits. (e) presents the efficiency frontier in the cases of benefits with and without RB. The efficiency frontier is used to select strategies for network-level M&R programming under budget restrictions (see Section 4.3). The figure shows also the equation for a hypothetical OCI used for all computations presented in this paper. For the purpose of the case study, more weight is attributed to the structural condition indicator (alligator cracking), reflecting the practice in many PMSs. Thus, the following weights have been assigned: 0.50 to alligator cracking, 0.30 to rutting and 0.20 to surface defects.
4.2. Maximising benefits/minimising costs without budgetary restrictions
The insights from the comparison of strategies at the section level become more obvious by examining the resulting annual costs and condition distribution for the entire network (50 lane-km). (a) shows the strategy that minimises costs without RV, resulting in average agency costs of €0.42 million per year. The cost diagram exhibits decreasing investments in the last years (no structural treatments), which leads to a rapidly worsening condition right after the end of the planning period. The strategy that minimises costs with RV results in average annual expenditures of €0.52 million, as depicted in (b). This strategy produces steady cash flows and a more balanced mix of maintenance and rehabilitation treatments. As the remaining asset value at the end of the planning period is implicitly considered, the network condition does not decline as rapidly as in (a).
Figure 8. Annual budget needs and network condition without budgetary restrictions for the cases of minimum costs with/without residual value (a, b) and maximum benefits with/without residual benefits (c, d), as well as corresponding distributions of treatment trigger values in each year of the planning period (e).
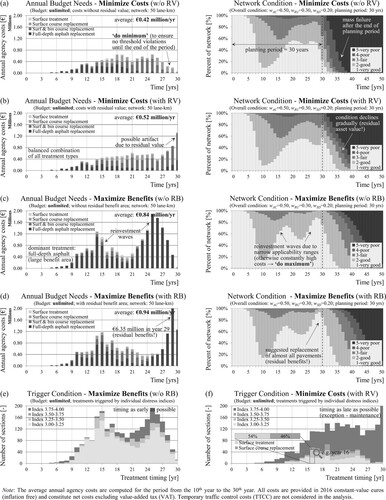
The maximisation of benefits without RB yields average agency costs of €0.84 million per year (see (c)), which is 62% higher than the corresponding costs of the strategy minimising costs with RV. Moreover, the resulting M&R programme is dominated by one particular treatment type: full-depth asphalt replacement. This treatment is suggested in almost all cases, irrespective of the actual distress combination and the leading failure cause. Furthermore, the two reinvestment waves are caused by the lower limit of the applicability range (i.e. CI = 3.0). The lower limit of the applicability range translates into minimum time interval between treatments. Without such a limitation, the maximisation of benefits will push follow-up treatments forward and more treatments will be included in the planning period, resulting in larger benefit area but also in constantly high expenditures. Thus, the case of unlimited budget clearly shows that the maximisation of benefits based on a subjective composite condition index is not an appropriate objective in pavement management. Moreover, additional analysis has revealed that using equal weights for the distresses in OCI will change the optimal strategy at the section level for 21% of all sections. Assigning weights of 0.20, 0,50 and 0,30 to alligator cracking, rutting and surface defects, respectively, leads to change of the optimal strategy on 36% of all sections. The resulting average annual agency costs, however, remain insensitive to any changes of weights. The reason for this is that, relative to other treatments, a major treatment produces larger area between the curves not only for the overall condition but also for all individual distress types, making the choice of the individual weights more or less irrelevant. Furthermore, the strategy that maximises benefits with RB results in even higher annual costs (81% higher than ‘minimum costs with RV’). The reason for this is the concept of residual benefits that leads to a selection of strategies with a major treatment in the last three years to gain the additional benefit.
The distribution of trigger values, depending on the application year of the treatment (x-axis) is illustrated in (e,f). The majority of treatments for the strategy of maximum benefits without RB are selected as early as possible (i.e. CI = 3.0 for any individual distress). In the case of minimisation of costs with RV, the majority of treatments are planned as late as possible to minimise the loss of service life but without exceeding the thresholds. The magnified detail from (f) shows that treatments with earlier timing are mostly preventive maintenance treatments. The following section will focus only on strategies of maximum benefits without RB and minimum costs with RV, as these objectives are more appropriate than their respective alternatives.
4.3. Maximising benefits/minimising costs under restricted budget (IBC)
The next objective is to find the combination of M&R strategies that maximises the total benefit under limited budgets using the IBC algorithm (see (a)). Only strategies that lie on the efficiency frontier are selected for the network-level analysis, amounting to 3976 M&R strategies in total (out of 300,000), not counting the ‘do nothing’ strategies for each section. (a,b,c) depicts the resulting annual agency costs and treatment demand (in lane-km) for annual budget levels of €1.00 million, €0.80 million and €0.60 million. In some of the cases the budget is not fully utilised due to the relatively small number of sections and strategies in the case study. The flexibility is also reduced by the fact that individual treatments composing a strategy impact budget constraints in multiple years. Nevertheless, in the case of maximum annual budget of €1.00 million, the resulting average agency costs (€0.71 million per year) are still 37% higher compared to the strategy minimising costs with RV. For the other two annual budget scenarios, €0.80 million and €0.60 million, the expenditures are respectively 23% and 4% higher.
Figure 9. Annual budget needs and distribution of treatment types based on IBC approach for different funding levels (a, b, c). Total discounted benefits, agency costs and average remaining life depending on the budget (d, e).
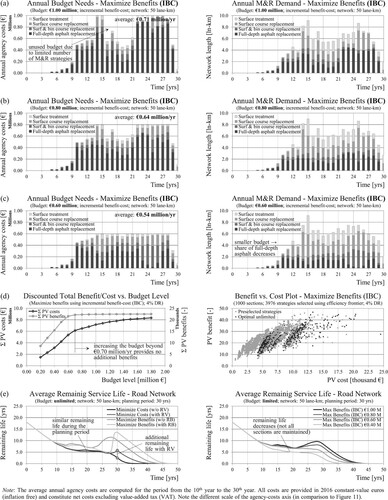
If the budget constraint for IBC is too tight, the resulting M&R programme becomes more similar to the solution of the cost-minimisation problem. If the budget constraint is less binding, the maximisation of benefits will lead to substantially higher costs as corresponding cost-minimisation strategies for the same reasons as those explained in Section 4.2. The graphs of the annual treatment demand show that with more severe budget restrictions, the share of full-depth asphalt replacement decreases in favour of surface and partial-depth repairs. If other performance and cost models are used, the alternative possibility cannot be ruled out that the share of repaired sections decreases and the shift in treatment type distribution is less significant.
The higher costs are further explained by the fact that the IBC and MCE approaches do not actually balance costs and benefits. The objective is to maximise benefits, while costs are only included in the budget constraint (see Peng and Ouyang Citation2010). Benefit–cost (B/C) or IBC values are only used for a pre-selection of strategies and to determine the order in which the strategies will be evaluated (i.e. to aid the heuristic procedure). (d) displays the total discounted costs and benefits for different budget situations. As can be seen, increasing the budget level beyond €0.70 million per year only leads to higher total costs but does not lead to a further increase of benefits. This follows from the fact that each subsequent more expensive strategy on the efficiency frontier provides smaller benefit improvements (law of diminishing marginal returns). Some authors suggest using a threshold for the IBC ratio (e.g. Farid et al. Citation1994). However, it is not possible to objectively determine, what constitutes a sufficient improvement in benefit (i.e. justifiable investment), as the benefit value is based on an overall condition with no monetary value. (e) illustrates the impact of the different objectives and the different budget levels on the resulting average remaining service life (RSL). Thus, the close link between condition distribution, remaining life, asset value and investment level is revealed, providing a complete picture of the implications of specific M&R strategies for the road agency.
4.4. Comparison to binary integer programming (BIP)
Next, the solution quality achieved by the heuristic algorithm IBC is evaluated. (a) displays the annual costs and network condition for an annual budget of €0.40 million. As a result of the tight budget, the do-nothing strategy must be selected for 23% of all sections, implying that these sections will not receive any treatments in the entire planning period. Still, the available budget in the last years of the planning period is not fully utilised. An optimisation approach can evaluate all possible combinations of strategies, while IBC evaluates the strategies in a sequence according to a specific order. So, a multi-year BIP (see (a)) model is formulated, where each of the 3976 strategies is represented by a binary variable. The problem is solved using the branch-and-cut solver (COIN-OR-CBC) supported by @OpenSolver 2.9.0, an open-source add-in for Microsoft Excel (Forrest and Lougee-Heimer Citation2005, Mason Citation2012). (b) presents the results, revealing that the budget is better utilised with this solution and only 13% of the network remains without funding (10% less!). In the literature it is argued that the IBC approach produces close to optimal results. In light of the already mentioned difficulties with the interpretation of benefits based on OCI, the finding here suggests that the difference between IBC and true optimisation might be considerable (depending on the situation), measured in terms of reducing the backlog demand (cf. Haas et al. Citation1985).
Figure 10. Comparison of annual budget needs and overall network condition resulting from maximising benefits using IBC approach (a), maximising benefits using BIP (b) and minimising costs using BIP (c), with summary of the results for different budget scenarios.
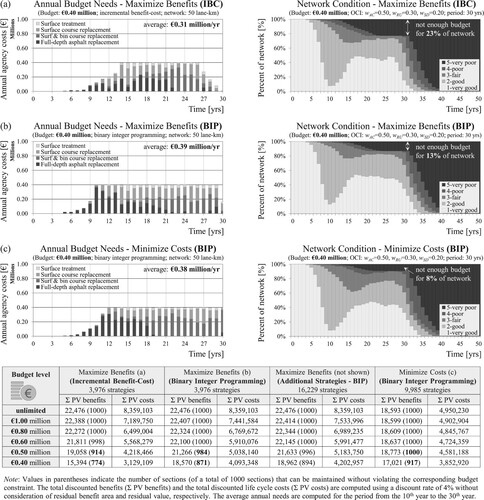
A BIP model minimising costs was also developed by considering the top ten strategies with the lowest life cycle costs for each section (9985 strategies). Minimising costs requires an additional constraint on the condition (e.g. no failures), otherwise the ‘do nothing’ strategy will always be selected. This approach leads to selection of strategies for additional 5% of the network, with only 8% remaining without M&R, as illustrated in (c). As can be seen, the pre-selection of M&R alternatives for the network-level optimisation is fundamentally different for the two objectives: benefit maximisation and cost minimisation. For the minimisation of costs is sufficient to sort the strategies by total discounted costs in ascending order and select the top alternatives. For maximisation of benefits, the efficiency frontier is needed, as the top strategies maximising benefits have all high agency costs and cannot provide the necessary flexibility for the satisfaction of the budget constraints.
A summary of the results for different budget levels is provided at the bottom of . It is clear that the BIP model leads to slightly higher total costs in comparison to IBC, but the two approaches should be compared with regard to their goal (i.e. maximisation of benefits). In summary, BIP outperforms IBC, especially for tight budgets. Moreover, the solution of BIP allows an additional 10% (7%) of the network to be repaired for the budget scenario of €0.40 million per year (€0.50 million per year). The strategy of maximising benefits with additional strategies includes strategies in the efficiency frontier tolerance range (16,229 strategies). This larger problem was solved using BIP, as the consideration of these strategies with IBC would require a modification of the algorithm. Anyhow, this provided only a little improvement compared to the original BIP formulation (3976 strategies). For example, in the case of €40 million annual budget, the amount of sections without treatments was reduced from 13% to 11% of the network.
4.5. Year-by-year binary programming
Alternatively, the benefit maximisation problem can be solved using a BIP model on a year-by-year (YBY) basis (see (b)). The decision variables for this formulation are the individual treatments (single-treatment strategies), resulting in a total of 5000 decision variables (1000 sections × 5 treatments). Thus, the benefits of all feasible treatments for all sections must be predicted prior to the optimisation in each year. Furthermore, the decision tree is slightly modified so that upper limits for the individual distresses are removed (i.e. threshold violations are allowed). Otherwise, the problem may become infeasible for tight budget scenarios.
(a) shows the optimal strategy for a selected road section and an annual budget level of €0.40 million. In contrast to a multi-year programme, the selection of a specific treatment in a given year does not depend on the type and timing of the subsequent treatments. Therefore, an M&R optimisation on a year-by-year basis does not constitute a life-cycle approach. A closer look at the performance curves reveals that the overall condition exceeds the threshold value in year 21 (individual distress types earlier). Due to a tight budget, this section is not repaired until year 29. (b) reveals that for a funding level of €0.80 million per year, the budget is almost fully utilised (compare with (b)). As treatment 4 produces the largest benefit area, for a larger budget, the problem is reduced to maximising the number of sections where this treatment can be applied (‘do maximum’). However, if the budget is insufficient, the optimisation will try to minimise the sections without treatment (zero benefit) by selecting less expensive treatment types, as illustrated in (c). The corresponding network condition shows 15% failures at the end of the planning period, which is still less than the failures with the IBC technique and a little more than the failures with the multi-year BIP (compare with (a,b)). However, in the latter case the violations of condition thresholds occur earlier in the planning period. The reason for this is that the YBY model may consider repair of an already failed section, while the ‘do nothing’ strategy for the multi-year model does not allow this option.
Figure 11. Maximisation of benefits for a single road section (a) and for the entire network with annual budget limits of €0.80 million (b) and 0.40 million (c) using BIP separately for each year of the planning period (year-by-year).
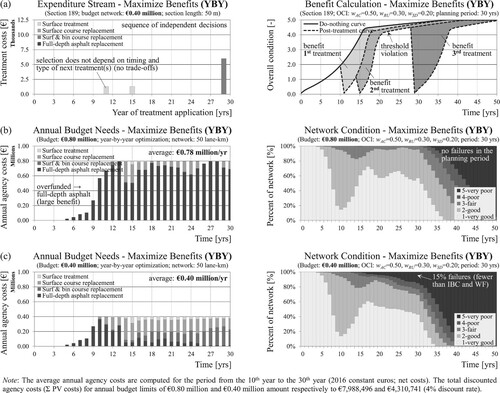
A limitation of the analysis in favour of the YBY approach follows from neglecting the negative effects of applying treatments by conditions worse than the threshold of 4.0. Such negative effects may include the need for more extensive treatment (higher costs) or shortening of post-treatment service life. This limitation relates mostly to the application of treatment 3 after year 15 in the case of €0.40 million annual budget ((c)).
4.6. Worst-first approach
Finally, the WF ranking approach is applied to the case study data on a year-by-year basis. The current pavement condition is used to prioritise road sections and assign treatments based on a decision tree. The modification to the decision tree is given in , defining a specific treatment without alternatives for each distress combination. Similar to the YBY BIP model, the selection of a treatment with the WF approach is independent from the timing and type of the subsequent treatments and temporary threshold violations are possible, as illustrated in (a). However, neither treatment costs nor benefits are used as a decision-making criterion. In the case of a budget limit of €0.80 million per year, the average annual expenditures amount to €0.57 million, as shown in (b). Thus, a simple WF approach results in respectively 11% and 27% lower costs compared to the multi-year IBC method and the BIP model on a year-by-year basis. The success of the WF approach, however, is highly dependent on the development of an appropriate decision tree.
Figure 12. M&R programme for a single section (a), annual budget needs and network condition (b, c), as well as distribution of treatment types (d) for budget levels of €0.80 and 0.40 million, resulting from the application of the worst-first approach.
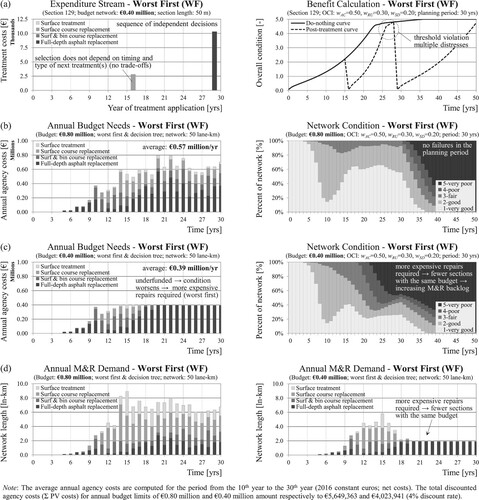
Nevertheless, the shortcomings of this method are evident for tight budgets, as demonstrated in (c). Since the available funding is not sufficient to cover all M&R needs, only the worst-performing sections will be repaired. A pavement in poor condition requires replacement (treatment 4), and thus fewer sections can be repaired with the same budget. This argument is confirmed by a decreasing annual network length with M&R actions in (d) (right). The ultimate result of WF ranking approaches under tight budget constraints is a large M&R backlog and 45% failed sections in the last year of the planning period.
5. Conclusions
The present paper focuses on one major shortcoming in several existing PMSs, namely the development of network-level M&R policies by maximising benefits (effectiveness) based on a composite condition index. The consequences of following benefit-maximisation strategies for condition distribution, agency costs and remaining life are analysed based on a parametric case study. Strategies maximising benefits and minimising costs are compared for the theoretical case of unlimited budget and for different funding scenarios using the IBC technique and true optimisation (BIP).
The results show that the maximisation of benefits gives preference to the most expensive replacement treatment with timing as early as possible, irrespective of actual service life and failure causes. However, the selection of treatments providing a larger area between the curves (benefit) based on an overall condition is neither an objective nor an economically justified decision-making approach. In the case of unlimited budgets, the benefit-maximisation strategy results in 62% higher costs for the agency compared to a strategy that minimises total life cycle costs. For limited budgets this percentage ranges between 4% and 37%. For road agencies with a tight budget, the IBC approach will lead to an inefficient use of funds, violations of thresholds and unnecessary M&R backlogs. Thus, the IBC objective of maximum benefits is a misleading, as these benefits have very little to do with actual monetary and non-monetary benefits resulting from following a specific M&R policy. In addition, the analysis reveals that using mathematical programming instead of heuristic approaches (IBC) may provide a substantial improvement, resulting in higher benefits and fewer sections in a failed state. Nevertheless, the results suggest that the selection of an appropriate optimisation objective (benefits vs. costs) is far more important than finding the best solution algorithm (prioritisation vs. optimisation).
A comparison with a simple ranking approach (worst first) suggests that WF may perform very well in the case of less binding budget constraints, conditional on the appropriate definition of a decision tree for selection of M&R treatments. For a less sufficient funding level, however, the agency budget is quickly consumed by expensive replacements for an increasing number of sections in a failed condition, leading to a quickly increasing gap between M&R needs and available budget.
The conclusions of this research contribute to both theory and practice of pavement management. In the context of aging infrastructure, increasing M&R needs and limited public budgets, a better budget allocation at the network level and substantial savings can be achieved by minimising agency or total (incl. user) costs instead of maximising the area between curves based on subjective weighting. In any case, road agencies should be aware of the short- and long-term effects of pursuing a specific optimisation objective on the average network condition and annual investment needs. The presented simulation approach avoids the limitations of empirical data providing researchers and agencies with the means to compare the effects of different parameters and optimisation objectives on the results.
Acknowledgment
The authors acknowledge the TU Wien University Library for financial support through its Open Access Funding Programme.
Disclosure statement
No potential conflict of interest was reported by the author(s).
Related Research Data
References
- AASHTO, 2012. Pavement management guide. 2nd ed. Washington, DC: American Association of State Highway and Transportation Officials.
- Al-Qadi, I.L., Buttlar, W.G., and Baek, J., 2009. Cost-effectiveness and performance of overlay systems in Illinois. Volume 2: guidelines for interlayer system selection decision when used in HMA overlays. Report no. FHWA-ICT-09-045. Urbana, IL: Illinois Center for Transportation.
- Anastasopoulos, P.C. and Mannering, F.L., 2015. Analysis of pavement overlay and replacement performance using random parameters hazard-based duration models. Journal of Infrastructure Systems, 21 (1), 04014024. doi: https://doi.org/10.1061/(ASCE)IS.1943-555X.0000208
- Birbaum, J., 2016. Entwicklung eines Verfahrens zur Ermittlung der Lebenszykluskosten von Straßen in Asphaltbauweise [Development of a procedure to determine the life-cycle-costs of asphalt roads]. Dissertation (PhD). Universität Siegen (in German).
- Brozek, B., Litzka, J., and Weninger-Vycudil, A., 2009. Entwicklung eines Nutzerkostenmoduls im österreichischen PMS [Development of a user cost module in the Austrian pavement management system]. Wien: BMVIT, Straßenforschung Heft 585 (in German).
- Cuelho, E., Mokwa, R., and Akin, M., 2006. Preventive maintenance treatments of flexible pavements: a synthesis of highway practice. Report no. FHWA/MT-06-009/8117-26. Helena, MT: Montana Department of Transportation.
- Donev, V. and Hoffmann, M., 2018a. Comparison of optimization approaches for pavement maintenance and rehabilitation policies on road section and network level. In: 6th international symposium on life -cycle civil engineering (IALCCE2018), 28–31 October, Ghent.
- Donev, V. and Hoffmann, M., 2018b. Optimisation of pavement maintenance and rehabilitation activities, timing and work zones for short survey sections and multiple distress types. International Journal of Pavement Engineering, doi:https://doi.org/10.1080/10298436.2018.1502433.
- Farid, F., et al., 1994. Feasibility of incremental benefit-cost analysis for optimal budget allocation in bridge management systems. Transportation Research Record: Journal of the Transportation Research Board, 1442, 77–87.
- Ferreira, A., Picado-Santos, L., and Antunes, A., 2002. A segment-linked optimization model for deterministic pavement management systems. International Journal of Pavement Engineering, 3 (2), 95–105. doi: https://doi.org/10.1080/10298430290030603
- FHWA, 1998. Pavement management systems. FHWA report HI-97-024. Washington, DC: Federal Highway Administration.
- Ford, K.M., et al., 2012. Estimating life expectancies of highway assets, volume 2: final report. NCHRP report no. 713. Washington, DC: Transportation Research Board.
- Forrest, J. and Lougee-Heimer, R., 2005. CBC user guide. INFORMS TutORials in Operations Research, 257–277.
- Gharaibeh, N. G., Zou, Y., and Saliminejad, S., 2010. Assessing the agreement among pavement condition indexes. Journal of Transportation Engineering, 136 (8), 765–772. doi: https://doi.org/10.1061/(ASCE)TE.1943-5436.0000141
- Haas, R., et al., 1985. Pavement rehabilitation programming: a range of options. In: 1st North American pavement management conference, 18–21 March, Toronto, Ontario.
- Haas, R., Hudson, W.R., and Falls, L.C., 2015. Birth and teen years of pavement management (1967–1987). In: R. Haas, W.R. Hudson, and L.C. Falls, eds. Pavement asset management. Salem, MA: Scrivener, 5–13.
- Haas, R., Hudson, W.R., and Zaniewski, J., 1994. Modern pavement management. Malabar, FL: Krieger.
- Hall, K.T., et al., 2001. Rehabilitation strategies for highway pavements. NCHRP project C1-38: conctractor’s final report. Washington, DC: Transportation Research Board.
- Hillier, F.S. and Lieberman, G.J., 2015. Introduction to operations research. 10th ed. New York, NY: McGraw-Hill Education.
- Irfan, M., et al., 2012. Scale and condition economies in asset preservation cost functions: case study involving flexible pavement treatments. Journal of Transportation Engineering, 138 (2), 218–228. doi: https://doi.org/10.1061/(ASCE)TE.1943-5436.0000323
- Javed, F., 2011. Integrated prioritization and optimization approach for pavement management. Thesis (PhD). University of Singapore.
- Juster, R.D. and Pecknold, W.M., 1976. Improving the process of programming transportation investments. Transportation Research Record, 599, 19–24.
- Keleman, M., et al., 2008. Pavement management manual. Denver, CO: Colorado Department of Transportation.
- Kerali, H.R. and Mannisto, V., 1999. Prioritization methods for strategic planning and road work programming in a new highway development and management tool. Transportation Research Record: Journal of the Transportation Research Board, 1655, 49–54. doi: https://doi.org/10.3141/1655-08
- Kuhn, K.D., 2012. Pavement network maintenance optimization considering multidimensional condition data. Journal of Infrastructure Systems, 18 (4), 220–277. doi: https://doi.org/10.1061/(ASCE)IS.1943-555X.0000077
- Lea, J., Harvey, J., and Tseng, E., 2014. Aggregating and modeling automated pavement condition survey data for flexible pavements for use in pavement management. Transportation Research Record: Journal of the Transportation Research Board, 2455, 89–97. doi: https://doi.org/10.3141/2455-10
- Li, N., Haas, R., and Huot, M., 1998. Integer programming of maintenance and rehabilitation treatments for pavement networks. Transportation Research Record: Journal of the Transportation Research Board, 1629, 242–248. doi: https://doi.org/10.3141/1629-27
- Maerschalk, G., and Socina, M., 2008. Weiterentwicklung der Bewertung des pavement management systems (PMS) um ein Verfahren für die Umsetzung von Qualitätszielen [Extension of the evaluation functions of the pavement management system (PMS) by a system for the implementation of quality goals]. Forschung Straßenbau und Straßenverkehrstechnik, Heft 1001. Bonn: Bundesministerium für Verkehr, Bau und Stadtentwicklung (in German).
- Mason, A.J., 2012. Opensolver – an open source add-in to solve linear and integer progammes in Excel. In: D. Klatte, H.-J. Lüthi, and K. Schmedders, eds. Operations research proceedings 2011. Berlin Heidelberg: Springer, 401–406.
- MDOT, 2019. Transportation asset management plan. Saint Paul, MN: Minnesota Department of Transportation.
- Menendez, J.R., et al., 2013. Prioritizing infrastructure maintenance and rehabilitation activities under various budgetary scenarios: evaluation of worst-first and benefit-cost analysis approaches. Transportation Research Record: Journal of the Transportation Research Board, 2361, 56–62. doi: https://doi.org/10.3141/2361-07
- Nobakht, M., et al., 2016. Mechanistic-empirical methodology for the selection of cost-effective rehabilitation strategy for flexible pavements. International Journal of Pavement Engineering, doi:https://doi.org/10.1080/10298436.2016.1199878.
- Odoki, J.B. and Kerali, H.G.R., 2000. Analytical framework and model descriptions. The highway development and management series, volume 4. Paris: World Road Association (PIARC).
- Patidar, V., et al., 2011. Evaluating methods and algorithms for multicriteria bridge management at the network level. Transportation Research Record: Journal of the Transportation Research Board, 2220, 38–47. doi: https://doi.org/10.3141/2220-05
- Peng, F. and Ouyang, Y., 2010. Pavement program planning based on multi-year cost-effectiveness analysis. Report no. FHWA-ICT-10-067. Springfield, IL: Illinois Department of Transportation.
- Qiao, Y., et al., 2019. Costs and effectiveness of standard treatments applied to flexible and rigid pavements: case study in Indiana, USA. Infrastructure Asset Management, 6 (1), 15–29. doi: https://doi.org/10.1680/jinam.17.00035
- Scheinberg, T. and Anastasopoulos, P.C., 2010. Pavement preservation programming: a multi-year multi-constraint optimization methodology. In: 89th annual meeting of the transportation research board, 10–14 January, Washington, DC.
- Shah, Y.U., Jain, S.S., and Parida, M, 2014. Evaluation of prioritization methods for effective pavement maintenance of urban roads. International Journal of Pavement Engineering, 15 (3), 238–250. doi: https://doi.org/10.1080/10298436.2012.657798
- Shahin, M.Y., et al., 1985. Pavement M&R budget optimization using the incremental benefit-cost technique. In: 1st North American pavement management conference, 18–21 March, Toronto, Ontario.
- Thompson, P.D., et al., 1998. The Pontis bridge management system. Structural Engineering International, 8 (4), 303–308. doi: https://doi.org/10.2749/101686698780488758
- Wang, F., Zhang, Z., and Machemehl, R.B., 2003. Decision-making problem for managing pavement maintenance and rehabilitation projects. Transportation Research Record: Journal of the Transportation Research Board, 1853, 21–28. doi: https://doi.org/10.3141/1853-03
- Weninger-Vycudil, A., 2001. Entwicklung von Systemelementen für ein österreichisches pavement management system [Development of system elements for the Austrian pavement management system]. Thesis (PhD). Technische Universität Wien (in German).
- Weninger-Vycudil, A., et al., 2009. Handbuch pavement management in Österreich 2009 [Manual pavement management in Austria 2009]. Straßenforschung, Heft 584. Wien: Bundesministerium für Verkehr, Innovation und Technologie (in German).
- Wu, Z. and Flintsch, G.W., 2009. Pavement preservation optimization considering multiple objectives and budget variability. Journal of Transportation Engineering, 135 (5), 305–315. doi: https://doi.org/10.1061/(ASCE)TE.1943-5436.0000006
- Yoo, J. and Garcia-Diaz, A., 2008. Cost-effective selection and multi-period scheduling of pavement maintenance and rehabilitation strategies. Engineering Optimization, 40 (3), 205–222. doi: https://doi.org/10.1080/03052150701686937
- Yu, B, et al., 2015. Multi-objective optimization for asphalt pavement maintenance plans at project level: Integrating performance, cost and environment. Transportation Research Part D: Transport and Environment, 41, 64–74. doi: https://doi.org/10.1016/j.trd.2015.09.016
- Zavitski, J.L., Rose, R.T., and Kuhl, G., 2008. Integrating pavement management into a comprehensive strategic asset management system for the state of Utah Department of Transportation. In: 7th international conference on managing pavement assets, 23–28 June, Calgary, Alberta.
- Zuniga-Garcia, N., et al., 2018. Economic analysis of pavement preservation techniques. Transportation Research Record: Journal of the Transportation Research Board, 2672 (12), 10–19. doi: https://doi.org/10.1177/0361198118768515