
ABSTRACT
Aged road pavements and insufficient maintenance budgets, along with increasing concerns over the environmental issues related to transportation have introduced additional challenges to highway agencies. Multiobjective optimisation techniques can be used to account for those multiple aspects in the design of maintenance and rehabilitation (M&R) strategies. Contrary to the single-objective optimisation problems where a single solution is optimal, the solution of multiobjective optimisation problems is a set of non-dominated solutions, often referred to as Pareto-optimal set. This set of optimal solutions represents the trade-off between the different and often conflicting objectives, and in many cases is comprised by a vast number of elements. This paper presents the development and application of a fuzzy logic expert system for selecting a single solution from the Pareto set obtained from the multiobjective optimisation of sustainable pavement M&R strategies. It provides decision-makers with an easy and intuitive methodology for the selection of the most preferred solution according to sustainability criteria. The proposed system is applied to a case study from France. Posteriorly, different strategies reflecting the decision-maker’s preferences towards economic and environmental objectives are analysed. Conclusions and recommendations for future improvements are derived from this application.
Introduction
Air pollution and climate change are some of the greatest environmental challenges faced by the world currently. Global warming due to anthropogenic greenhouse gases (GHGs) emissions to the atmosphere might have harsh environmental, social and economic effects around the world if temperature levels continue to rise. Parallelly, air pollution is acknowledged to be a cause of premature death as well as a wide array of illnesses, including both respiratory and cardiovascular diseases. For instance, the World Health Organization estimated the number of deaths in 2012 attributable to diseases caused by carcinogens and other poisons in outdoor polluted air to be one in nine (WHO Citation2016). Analogous outcomes were also recently published in a major new report in The Lancet medical journal (Watts et al. Citation2018).
In order to tackle these issues, international public positions, treaties and initiatives have been announced, celebrated and held to constraint the impact of global warming by mitigating carbon emissions, and thereby contributing to limiting resource depletion and reducing pollution as well. An example of such events was the December 2015 United Nations Climate Change Conference (COP21), from which resulted the Paris Agreement signed by more than 174 countries and the European Union (EU) on 22 April 2016. The tone for countries to enhance their national climate commitments to many of the core elements of the Paris rulebook and guidelines was recently strengthened in the December 2018 United Nations Climate Change Conference (COP24) held in Katowice, Poland. The latter initiative was preceded by a communication from the European Commission (EC) underlining the Europe's commitment to lead in global climate action and to present a vision that can lead to achieving net-zero GHGs emissions by 2050 through a socially-fair transition in a cost-efficient manner (European Union: European Commission Citation2018).
The formal recognition of the need to stablish a sustainable global climate policy is a first step towards reversing the negative effects of climate change. However, meeting the expectations of these agreements in their full and effective extension is a challenging task that requires a serious, engaged and global commitment from all sectors. Within this context, special attention has been paid to the transportation sector, which, although providing our society with several benefits, such as the movement of people and goods and the promotion of economic grow and employment, is also harmful to the human health and the environment due to its expressive contribution to the global emission of GHGs and noxious air pollutants (EEA Citation2016, Watts et al. Citation2018). For instance, according to Pérez-Martínez (Citation2012) road transport accounts for up to 30% of the total energy consumption and CO2 emissions considering the whole economic sector. In particular, the bituminous road pavement sector is a key player in driving the environmental performance of the transportation sector. To a great extent, that is a consequence of the considerable quantity of environmental impacts generated during the construction, maintenance and rehabilitation (M&R) and usage of the road pavements (Santero and Horvath Citation2009). The negative effects related to those activities are not expected to decrease, as the developed countries generally present an aged road pavement network in need of urgent repair and improvement. Instead, they might even be experienced more often and with much adverse consequences as a result of the higher frequency of extreme weather events (i.e. flooding, heavy rainfall, etc.) and their impacts in leading to a clear early road infrastructure deterioration. This deterioration, in turn, will bring more often M&R activities, having as immediate consequence the reduction of the network availability and, clearly, a need for additional and costly extra investment, which might not be met due to insufficient budgets, shortened during the last years by the financial crisis.
To deal with this decision-making scenario characterised by the competitive needs of deteriorated road pavement sections, limited budgets allocated for M&R and the need of accounting for environmental concerns, asset managers are looking for prioritisation techniques which given a pavement network, allow them to define which sections should receive M&R treatments and which treatments should be applied over a given analysis period.
Optimisation has been identified as an effective technique for infrastructure management problems (Wu et al. Citation2012). It has promising characteristics that can help to tackle the challenges abovementioned (Santos et al. Citation2018b). Different optimisation methods have been applied in the pavement management field for the design of M&R strategies, including: linear and non-linear programming (de la Garza et al. Citation2011, Gao et al. Citation2012), integer programming (Ferreira et al. Citation2002, Ng et al. Citation2011), dynamic programming (Farhan and Fwa Citation2012, Fwa and Farhan Citation2012), local search heuristics (Yepes et al. Citation2016, Torres-Machi et al. Citation2017), and evolutionary algorithms (Santos et al. Citation2018a, Citation2019), among others (Torres-Machi et al. Citation2014a). Although these methods differ on the mathematical approach used to solve the optimisation problem, they all seek the best M&R strategies that should be applied over the analysis period. The optimisation problem is therefore formulated in terms of one/a set of objective(s) function(s) (OFs) to be maximized/minimized and a set of constraints that need to be satisfied.
Traditionally, M&R strategies have been evaluated considering technical and economic criteria (Torres-Machi et al. Citation2014b). In the last years, environmental sustainability has become an emerging field in the transportation industry (Tighe and Gransberg Citation2011, AzariJafari et al. Citation2016), where terms such as green, sustainable development, environmental impact, energy efficiency, global warming, GHGs, and eco-efficiency are becoming more widely recognised (Chehovits and Galehouse Citation2010, Tighe and Gransberg Citation2011). Previous literature has focused on how to quantify environmental impacts derived from pavement construction and M&R (Santero et al. Citation2011, Santos et al. Citation2014, Citation2015, AzariJafari et al. Citation2016, Jiang and Wu Citation2019). However, when it comes to incorporate those efforts into the optimal planning of M&R strategies, much remains to be done to demystify its complexity at the decision-makers’ (DMs’) eyes (Gosse et al. Citation2013, Bryce et al. Citation2014, Torres-Machi et al. Citation2014b). This limitation was indeed highlighted in a study developed by Tighe and Gransberg (Citation2011), which included a survey about the current state of practice in sustainable pavement management. This study found that transportation agencies in the USA and Canada are becoming more aware of the significance of environmental sustainability. However, this does not translate to direct measures within their management process. Indeed, only 4% of respondent agencies reported to use environmental performance to select maintenance practices (Tighe and Gransberg Citation2011). Given this gap in current state of practice, there is a need to develop a methodology for the practical consideration of environmental aspects in current pavement management systems.
Environmental aspects can be taken into account in the optimal design of M&R strategies by including new OFs accounting for the environmental impact of the M&R activities (Santos et al. Citation2017, Citation2018b). When considering more than one OF the optimisation problem becomes a multiobjective optimisation problem (MOOP). Whereas MOOPs allow to reflect the various goals of the agency, they increase the complexity of the mathematical formulation and the analysis of results (Wu et al. Citation2012). In contrast to the single-objective optimisation, which involves finding a solely optimal solution, solutions obtained in MOOPs are usually defined by a set of non-dominated solutions, often referred to as Pareto optimal solutions. A solution is called Pareto optimal if there exist no another solution which would decrease the value of some OF without causing a simultaneous increase in at least one other considered OF (assuming a minimisation problem) (Chiandussi et al. Citation2012).
One of the challenges of considering multiple objectives in the design of M&R strategies resides in the selection of the most satisfactory solution from the Pareto set. From the classical mathematical conception of vector fields, all the solutions contained in the Pareto set are equally acceptable solutions, as vector fields are not endowed with a natural ordering. In practical terms, it is desirable to define the preferences of the DM towards the different objectives (Wu et al. Citation2012, Chen et al. Citation2015). This would allow the DM to evaluate the global performance of the solutions contained in the Pareto set and select the most preferred one based on his/her preferences.
Different methods, reviewed in detail in a later section, can be used to articulate the DM’s preferences. Analytical Hierarchy Process (AHP), weighted sum, and multi-attribute utility theory, among others, have previously been applied in the pavement management field to select the most satisfactory solution from MOOPs (Giustozzi et al. Citation2012, Meneses and Ferreira Citation2013, Citation2015, Torres-Machi et al. Citation2015). Each method has demonstrated advantages and shortcomings, and thus no widely accepted method has been adopted by the transportation sector (Bryce et al. Citation2014). Whereas these traditional methods allow to articulate the DM’s preferences, they are not able to incorporate expert specific, qualitative and structured knowledge. In this regard, fuzzy logic systems (FLS) present the advantage of being able to incorporate experts’ specific knowledge through the use of implication rules capable of reflecting imprecise knowledge and qualitative data in the decision-making process. Fuzzy systems are convenient to model expert reasoning because they handle linguistic rules efficiently and are fault-tolerant regarding small changes in the input or system parameters (Flintsch and Chen Citation2004).
Aim and purpose of the study
The study presented in this paper aims to provide pavement managers with an easy and intuitive methodology for the selection of the most preferred solution from the Pareto set obtained from the multiobjective optimisation (MOO) of pavement life cycle M&R strategies, considering sustainability criteria. To achieve this goal, a fuzzy logic expert system (FLES) is developed to articulate the DMs’ preferences using linguistic rules.
The proposed FLES is applied to a French case study in which different optimal pavement M&R strategies reflecting the DM’s preferences towards economic and environmental objectives are analysed.
The overall purpose of this study is to increase the DMs/stakeholders’ capacity to make strategic and informed decisions regarding the selection of optimal pavement M&R that would ultimately enhance the sustainability of transportation systems.
The research approach is organised as follows: Section 2 provides the theoretical background on the use of MOO methods for the design of optimal pavement M&R strategies. Section 3 describes the main features of the proposed FLES for the sustainability-based appraisal of optimal pavement M&R strategies. Section 4 illustrates the capabilities of the proposed FLES through its application to a case study analysing optimal M&R strategies in a French road pavement section. Section 5 explains how the proposed FLES could be applied to tackle the optimisation of pavement maintenance management at the network level. Finally, Section 6 provides conclusions and recommendations for further research work.
Background: multiobjective optimisation (MOO) for the design of optimal pavement maintenance and rehabilitation strategies
MOO has drawn an increasing interest from transportation agencies as an operation research technique to help advancing the sustainability of pavement management practices. However, one of the challenges underlying to the use of MOO for the design of M&R strategies resides in the selection of a single preferred solution from the Pareto set. Mathematically, all the solutions contained in the Pareto set are equally optimal. However, in practical terms, only one solution will be applied. Under this situation, DMs may find it hard to articulate their preferences in the selection of the most appropriate solution. To ease up this process, several methodologies exist that provide the DM with a reduced, and thereby more manageable set of alternative solutions.
There are three different categories of methods for incorporating the DM’s preferences in the optimisation process (Syan and Ramsoobag Citation2019): (i) methods with a priori articulation of preferences, (ii) methods with a posteriori articulation of preferences, and (iii) methods with a progressive (interactive) articulation of preferences (Cohon and Marks Citation1975, Wu et al. Citation2012, Purshouse et al. Citation2014, Hosseininasab et al. Citation2018, Li and Li Citation2018, Augeri et al. Citation2019). In the first method, preferences are defined in terms of the relative importance of the objectives and then the optimisation algorithm is run. In the second method, the set of Pareto optimal solutions are generated first and then the satisfactory/acceptable solution is posteriorly selected. Finally, in the latter method the DM’s preference is progressively integrated during the optimisation process.
A priori decision-making approach is effective and efficient when the DM is completely aware of his/her preferences and is able to express them conveniently. However, this is not often the case. An interactive decision-making approach enables the DM to learn about the problem and to adapt his/her preferences if needed, thereby guiding the search towards regions of interest and away from exploring non-interesting solutions. The main disadvantage of this approach is that the DM may need to be involved intensively during the optimisation process. As far as the a posteriori decision-making approach is concerned, it presents the advantage of providing the DM with the information of the Pareto set firstly, after which his/her preferences are articulated and the most preferred solution is then chosen. This section introduces some of the techniques that have been used in the pavement management field to evaluate the global performance of a solution considering several criteria/objectives.
Analytic hierarchy process (AHP)
The AHP is a structured analytical method developed in the 1970s by Saaty (Saaty Citation2008). It is an established prioritising tool used for solving the choosing problem, comparing alternatives, ranking best practices, and making multi-criteria decisions when both qualitative and quantitative factors must be considered. Because AHP assesses alternatives considering a pairwise comparison, all the alternatives under evaluation need to be known. Therefore, AHP can be used to evaluate the goodness of the solutions in the Pareto set under a posteriori articulation of preferences.
AHP is widely used in infrastructure management and especially in transportation. Kabir et al. (Citation2014) found AHP is widely applied in the management of transportation infrastructure, being used more than 50% of the times. In terms of its application, AHP is followed by ELECTRE, which is applied in less than 10% of the reviewed papers (Kabir et al. Citation2014). Farhan and Fwa (Citation2011) used AHP to prioritise maintenance needs at the network level considering multiple pavement distresses. Similarly, Smith and Tighe (Citation2006) applied AHP to compare different repair products and maintenance strategies. More recently, Torres-Machi et al. (Citation2015) applied AHP to evaluate maintenance treatments integrating technical, economic, and environmental criteria.
AHP shows strengths (such as the calculation of consistency ratio to assure DMs and its ability to incorporate both qualitative and quantitative criteria) and limitations (such as the complex and time-consuming implementation and computation when increasing the number of criteria considered in the evaluation) (Whitaker Citation2007, Saaty et al. Citation2009, Kabir et al. Citation2014). Among the limitations of AHP, several authors have highlighted the complexity of the evaluation when more than eight alternatives or criteria are considered (Cafiso et al. Citation2002, Torres-Machi et al. Citation2015). This is a major limitation in MOOPs, where it is common to have much more than eight solutions in the Pareto set.
Weighted sum
Weighted sum method combines the different objectives/goals considered in the optimisation problem into a single indicator by assigning weights to each of the objectives under consideration. This method can be used in MOOPs both considering a priori articulation of preferences (and therefore transforming the different OFs into a single OF) and with a posteriori articulation of preferences.
The weighted sum method enjoys a wide popularity because of its simplicity in integrating different OFs (Wu et al. Citation2012). Examples of the application of this method in the pavement management field can be found in Wu and Flintsch (Citation2009) and Meneses and Ferreira (Citation2013, Citation2015). In these applications, weighted sum is applied with a priori articulation of preferences where the weights are varied consistently and continuously to obtain the Pareto optimal set.
Multi-attribute utility theory
Multi-attribute utility theory is based on a mathematical framework in which the OFs are combined into an overall performance index that considers the relative importance of the objectives in terms of utility functions. Previous work published by Giustozzi et al. (Citation2012) and Torres-Machi et al. (Citation2015) show examples of the application of this method for the sustainable evaluation of maintenance strategies.
Multi-attribute utility theory presents the advantage of being capable of quantifying a DM’s preferences over the available alternatives to a decision. However, one of the major limitations is that it is difficult to construct the individual’s utility function in a practical situation (Wu et al. Citation2012).
Fuzzy logic systems
FLS, introduced by Zadeh (Zadeh Citation1965), can be defined as the nonlinear mapping of an input data set to a scalar output data (Mendel Citation1995). They are an extension of the traditional rule-based reasoning (expert systems) incorporating imprecise, uncertain, and qualitative data in the decision-making process (Flintsch and Chen Citation2004). Fuzzy logic extends the notions of logic beyond simple true and false values to allow for partial continuous truths (Sundin and Braban-Ledoux Citation2001).
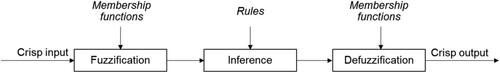
A FLS consists of three main parts (): fuzzifier, rules and inference engine, and defuzzifier. The process followed by a FLS is as follows (Mendel Citation1995). Firstly, a crisp set of input data are gathered and converted to a fuzzy set using fuzzy linguistic variables, fuzzy linguistic terms and membership functions. This step is known as fuzzification. Afterwards, an inference is made based on a set of rules. Lastly, the resulting fuzzy output is mapped to a crisp output using the membership functions in the defuzzification step.
Figure 1. Components and general architecture of a FLS.
Fuzzy logic has successfully been applied to decision-making in different fields of engineering (Morillas et al. Citation2009, Morillas and Gregori Citation2011, Camarena et al. Citation2013).
In the pavement management field, FLS have been applied to determine maintenance needs, deterioration and maintenance timing (Chen and Flintsch Citation2007, Moazami et al. Citation2011, Pragalath et al. Citation2018). Moazami et al. (Citation2011) applied a prioritisation system based on fuzzy logic to determine maintenance needs at the network level. A recent application developed by Pragalath et al. (Citation2018) combined fuzzy logic and image processing to assess infrastructure deterioration. Similarly, Chen and Flintsch (Citation2007) applied fuzzy logic in combination with probabilistic life-cycle cost analysis to determine the timing of M&R.
Previous applications have demonstrated that fuzzy systems are convenient to model expert opinions because they handle linguistic rules efficiently and are fault-tolerant regarding small changes in the input parameters. The main advantage of this approach is the possibility of introducing and using rules from experience or intuition. In the light of these advantages, this study explores the application of FLES for selecting a single solution from the Pareto set obtained from the MOO of sustainable pavement M&R strategies.
Methodology
This section presents the proposed FLES for the sustainable evaluation of optimal M&R strategies based on the general architecture of the FLES shown in . At this point, it is important to remind that the main goal of the proposed system is to assist pavement managers in the selection of the most preferred solution among a Pareto set of solutions. The set of optimal solutions of a MOOP belongs to a multidimensional space which is not endowed with a natural order as the unidimensional data does. Therefore, to decide which of the solutions in the set is the most appropriate in a given context, an ordering scheme must be defined. In this study, each solution contained in the Pareto set represents an optimal M&R strategy according to different objectives. Through the application of the proposed FLES, the DM will be able to assess the global performance (GP) of each solution in the Pareto set and therefore rank and select the one having a higher GP value. Unlike other FLS that are built through data-based training, the proposed FLES is defined using experts’ specific knowledge. The knowledge to be incorporated in the system may come from different sources. One possibility is that for a particular application, general accepted criteria are available, either coming from regulations or institutions’ recommendations of different kind. Another option is to use expert specific knowledge. Although this option has the disadvantage of having a subjective nature, and as such the knowledge in the system may change from expert to expert, it is also true that the use of expert knowledge may suit better a particular application since it is able to be designed ad-hoc for the case or context under study. In this case, the authors’ expertise is used to decide the knowledge to be incorporated in the system presented in this paper. Thus, the main contribution from experts is the definition of the fuzzy implication rules that in turn define the different fuzzy sets needed for both fuzzyfication and defuzzyfication.
Crips inputs
The crisp inputs correspond to the values of the OFs considered in the MOO of pavement M&R strategies. The proposed FLES aims to account for sustainable M&R strategies. Therefore, the crisp input variables represent the OFs values of the optimal pavement M&R strategies (e.g. life-cycle agency costs and potential environmental impact, etc.).
Fuzzification
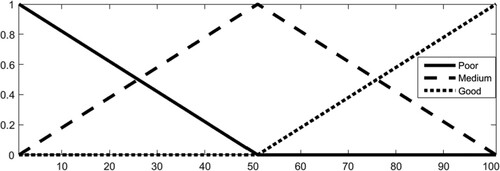
The fuzzification process transforms the crisp inputs into linguistic terms through the application of membership functions. Membership functions are used in the fuzzification and defuzzification steps of a FLES to map the crisp values to fuzzy linguistic terms and vice versa. In the proposed system, the crisp values are fuzzified into three levels: Poor, Medium, and Good. The degree to which each input is considered Poor, Medium or High, is computed using the membership functions.
In the proposed FLES, the popular triangular fuzzy membership functions as those plotted in were adopted due to their simplicity and good performance in many other applications. In each fuzzy membership function the peak is set to the maximum, median, and minimum value of each input OF in the Pareto set, respectively. It should be noticed that this setting ensures the functionality of the system in a non-linear context-dependent way.
Figure 2. Triangular membership functions used to decide the extent to which the inputs can be considered Poor, Medium, and Good.
Inference process
By applying a set of rules, the inference process transforms the fuzzy input values to fuzzy output values. A fuzzy rule is a simple IF–THEN rule with an antecedent and a consequent (Mendel Citation1995). Considering the IF–THEN structure, the proposed FLES determines the GP of each solution through expert evaluation rules based on the fuzzy values of input variables. The set of rules is defined on linguistic terms considering linguistic variables of both inputs and outputs.
Linguistically, the proposed FLES considers five levels of GP: Very Poor, Poor, Medium, Good, and Very Good. For each of these levels, the proposed FLES uses one rule to define the membership degree of the GP being in that level, also called certainty degree for the level. The inference process is the mathematical operation used to determine the certainty degree of the GP being in each of the five levels considered. For each level it is used a fuzzy rule. That implies that in the proposed FLES five fuzzy rules are considered. The inference process applied in each fuzzy rule assigns the certainty degree of the output (GP being in the level corresponding to the rule) to the certainty degree of the antecedent of the rule, which must be previously computed. More specifically, the following three steps are followed:
The certainty degree of each linguistic variable in the antecedent fuzzy rule is computed using the corresponding membership function and the crisp data, as explained above.
Conjunction (AND) and disjunction (OR) operations are applied to compute the certainty of the whole antecedent rule. For that purpose, an appropriate t-norm is used to represent the AND operation and an s-norm for the OR operation. In the proposed FLES, the classical product t-norm and probabilistic addition s-norm are used.
The certainty of the consequent rule is assigned to the certainty of the antecedent computed in the previous step. This certainty represents the degree in which the GP can be considered to be in the level corresponding to the rule.
In the proposed FLES, the rules define the DM’s preferences towards the different objectives considered in the optimal design of M&R strategies so that different set of rules may represent different strategies towards the sustainability criteria considered in the optimisation. For example, a cost-centered strategy could be simulated by giving higher values of GP to those solutions having lower costs.
Defuzzification
After the inference process, the overall result is a fuzzy certainty value measuring the GP in each of the five levels (Very Poor, Poor, Medium, Good, and Very Good). This result must be defuzzied to obtain a final crisp output. This is the purpose of the defuzzifier component of the FLES, which performs the defuzzification according to the membership function of the output variable.
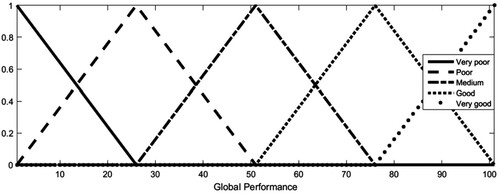
The membership functions used for the defuzzification in the proposed FLES are depicted in . As for the membership functions used for fuzzification (), triangular functions are used. In this case, the peak of each triangle measuring Very Poor, Poor, Medium, Good and Very Good GP is set to 0, 25, 50, 75 and 100, respectively. This implies that GP will be in the range [0, 100], being 100 the best possible value and 0 the worst. Different methods can be used for defuzzification. In the proposed FLES, the Centre of Gravity method is adopted (Kerre Citation1998). To obtain a numerical value of GP from the qualitative evaluation given by the fuzzy rules, an area is formed by the triangular function where each triangle is bounded by the corresponding degree of certainty of the output level that it represents. The centre of gravity of this area is then computed and its projection on the GP axis provides the quantitative level of GP.
Figure 3. Triangular membership functions used to decide the degree in which GP can be considered Very Poor, Poor, Medium, Good and Very Good.
Case study
General description
The capabilities of the proposed approach are illustrated through a case study consisting of determining the optimal M&R strategy for a flexible road pavement section of a typical French highway which yields the best trade-off between two OFs. The pavement section is 1-km long and possesses two independent roadways, each with two lanes with an individual width of 3.5 m. The project analysis period (PAP) is equal to 30 years, starting in 2015, and covers the following phases of the pavement life cycle: (i) raw material extraction and mixtures production; (ii) construction and M&R; (iii) work-zone traffic management (WZTM); and (iv) usage phase.
Based on the real values observed in a French road section in 2015, the initial two-way average annual daily traffic (AADT) was considered to be equal to 6500 vehicles/day, of which 33% are heavy duty vehicles (HDV) (equality divided between rigid HDV and articulated HDV). The structure and composition of the French fleet of vehicles, expressed in terms of type of vehicles and European emissions standards, was that defined by CITEPA (Centre Interprofessionnel Technique d’Études de la Pollution Atmosphérique). The traffic growth rate was 1.5% per year (Jullien et al. Citation2015) and the future M&R costs were discounted to present worth by adopting a discount rate of 4%.
A pavement structure with an initial structural number (SN0) equal to 5.13 and the geometric characteristics presented in was adopted in each of the independent roadways. The ID and features of the four M&R activities considered to be available for application over the PAP are presented in . presents the M&R strategy corresponding to the French practice (Laurent Citation2004).
Figure 4. Geometric characteristics of the flexible pavement structure. (Acronyms: BBGA – bituminous bound graded aggregate; HMAC – hot mix asphalt concrete; STAC – super thin asphalt concrete).
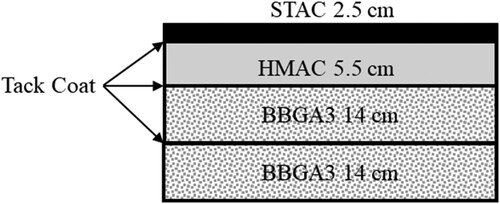
Table 1. ID and features of the M&R activities considered to be available for application over the PAP.
Table 2. M&R strategy corresponding to the French practice.
Moreover, in this case study three bi-objective optimisation problems (b-OOP) were considered, namely the minimisation of the net presented value (NPV) of the costs incurred by the highway agency with the M&R of the road pavement section, hereafter abbreviated as LCHAC, and the minimisation of three life cycle environmental impact category scores. They are as follows: (i) climate change (CC); (ii) cumulative energy demand non-renewable resources (CED NRR), and (iii) human toxicity (HT). The calculation of the environmental impact category scores was performed at midpoint level by applying the life cycle impact assessment (LCIA) method CML 2001 (Guinee et al. Citation2002).
The pavement life cycle phases and processes included within the system boundaries of the life cycle assessment (LCA) study performed to determine the potential environmental impacts related to the construction, M&R and usage of the road pavement section are the following: (i) extraction of materials and mixtures production, consisting of the acquisition and processing of raw materials, and the mixing process of asphalt mixtures in plant; (ii) construction and M&R, including the operations required to construct, maintain and rehabilitate the pavement layers, namely those referring to the use of the required construction equipment; (iii) transportation of materials, accounting for the transportation of materials to and from the construction site and between intermediate facilities (e.g. transportation of aggregates from the quarries to asphalt mixing plants, etc.); (iv) WZ traffic management phase, which consists of the additional environmental impacts produced by the on-road vehicles when experiencing a disruption of the normal traffic flow due to the perturbations associated with a WZ traffic management plan; and (v) usage, which models the interactions of the pavement with vehicles and environment throughout the PAP. For further details on the features of the LCA study the reader is referred to Santos et al. (Citation2018c).
To ensure the practicality of the b-OO model, a set of constraints was defined: (i) the Present Serviceability Index (PSI) of the pavement section, which was adopted to model the pavement performance over the PAP according to the AASHTO model (AASHTO Citation1993), cannot be lower than 2.0; (ii) the macrotexture, modelled through the model proposed by Lorino et al. (Citation2008), cannot be lower than 0.6 mm; and (iii) no more than one M&R activity can be applied within a time frame of 5 years.
The b-OOP described above are extremely difficult to solve to an exact optimum given their marked combinatorial nature and the difficulties in verifying, when they exist, the required mathematical properties of continuity, convexity and derivability. Therefore, they were solved with a Multi-Objective Evolutionary Algorithm (MOEA), namely the NSGA-II (Deb et al. Citation2002), adapted and implemented in the optimisation-based decision support system (DSS) for pavement management developed by Santos et al. (Citation2018a). Details on the parameter setting of the optimisation algorithm are given in the previous reference.
Components of the fuzzy logic expert system (FLES)
Four crisp inputs variables were considered in the case study, each one corresponding to one of the OF presented in the previous sub-sections.
The next step in the FLES design is to determine the knowledge in the system that should be structured in the form of implication rules. As mentioned before, in this case study the authors’ expertise is used to decide the knowledge to be incorporated in the system. In particular, three different scenarios are considered that lead to three different strategies reflecting the DM’s preference towards the OF: (i) cost, (ii) environmental; and (iii) neutral strategy. The cost strategy represents a DM whose preference is to minimise the M&R costs incurred by the highway agency over the PAP. In this strategy, cost is given more importance over the environmental impact generated throughout the pavement life cycle. On the other hand, the environmental strategy accounts for the interests of a DM who is much more aware of the environmental impact. Hence, environmental indicators of performance provide the main GP evaluation and cost is just used for refinement. Finally, the neutral strategy represents the DM’s view who possesses an equidistant position in relation to economic and environmental aspects. It is defined by combining the rules used for the cost and environmental strategies. These preferences are articulated in the following set of rules:
Cost strategy:
o C1: IF Cost is Poor THEN GP is Very Poor
o C2: IF Cost is Medium AND 2 environmental inputs are Poor THEN GP is Poor
o C3: IF Cost is Medium THEN GP is Medium
o C4: IF Cost is Good and 2 environmental inputs are Medium THEN GP is Good
o C5: IF Cost is Good and 2 environmental inputs are Good THEN GP is Very Good
Environmental strategy:
o E1: IF 2 environmental inputs are Poor and Cost is not Good THEN GP is Very Poor
o E2: IF 2 environmental inputs are Poor and Cost is Good OR 1 environmental input is Poor OR 2 environmental inputs are Medium THEN GP is Poor
o E3: IF 2 environmental inputs are Medium AND Cost is High OR 2 environmental inputs are Good THEN GP is Medium
oE4: IF 2 environmental inputs are Good AND 1 environmental input is Medium OR environmental inputs are Good AND Cost is Good THEN GP is Good
oE5: IF 3 environmental inputs are Good AND Cost is not Poor OR 2 environmental inputs are Good AND 1 environmental input is Medium AND Cost is Good THEN GP is Very Good
Neutral strategy:
o N1: IF Cost is Poor OR 2 environmental inputs are Poor and Cost is NOT Good THEN GP is Very Poor
o N2: IF Cost is Medium AND 2 environmental inputs are Poor OR 2 environmental inputs are Poor and Cost is Good OR 1 environmental input is Poor OR 2 environmental inputs are Medium THEN GP is Poor
o N3: IF Cost is Medium OR 2 environmental inputs are Medium AND Cost is High OR 3 environmental inputs are medium OR 2 environmental inputs are Good THEN GP is Medium
o N4: IF Cost is Good and 2 environmental inputs are Medium OR 2 environmental inputs are Good AND 1 environmental input is Medium OR 2 environmental inputs are Good AND Cost is Good THEN GP is Good
o N5: IF Cost is Good and 2 environmental inputs are Good OR 3 environmental inputs are Good AND Cost is NOT Poor OR 2 environmental inputs are Good AND 1 environmental input is Medium AND Cost is Good OR all inputs are Good THEN GP is Very Good
Results
a–c displays the pareto optimal set of solutions in the objective space for each b-OOP, along with the M&R corresponding to the French practice. In turn, d displays the GP of each Pareto optimal pavement M&R strategy, as well as the solution corresponding to the French M&R practice, for each DM’s preference towards the OF. According to the FLES theory, the closer the GP to 100, the better the solution is. presents the M&R strategies corresponding to the best optimal solutions (BOSs) (i.e. highest GP values) and the current French M&R practice, as well as the OF and GP scores.
Figure 5. Pareto optimal set of solutions along with the M&R strategy corresponding to the French M&R practice: (a) Min. LCHAC vs. Min. CC; (b) Min. LCHAC vs. Min. HT; (c) Min. LCHAC vs. Min. CED NRR; (d) GP of each Pareto optimal pavement M&R strategy, as well as the solution corresponding to the French M&R practice, for each DM’s preference towards the OF. (Acronyms: LCHAC – life cycle highway agency costs; CC – climate change; HT – human toxicity; CED NRR – cumulative energy demand non-renewable resources).
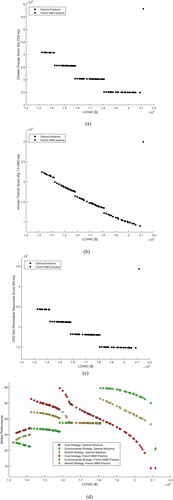
Table 3. M&R strategies corresponding to the best optimal solutions and the current French M&R practice, as well as the OF and GP scores.
Similar to the Pareto fronts of the several b-OOP, also the ‘combined’ Pareto fronts expressed in terms of GP are not continuous. Instead, they are comprised by several segments, which evolve differently with the increase in the M&R expenditures, depending on the DM’s preference. Overall, for a DM who privileges the environmental aspects, the money has a low marginal value, and then, he/she should not expect great variations in the GP score when he/she increases the M&R expenditures in the same relative proportion. That is because the ‘combined’ Pareto front is comprised by several roughly flat segments that can be interpreted as cluster of solutions, which for a given range of M&R expenditures (and M&R strategies) generate a similar GP score. On the contrary, when the DM’s choices are primarily driven by monetary aspects, the GP of the solutions are more sensitive to variations in the M&R expenditures, being this trend more pronounced for higher budgets. For instance, when the life cycle costs incurred by the highway agency increase from €180,896.50 to €208,964.30, the GP of the M&R strategies decreases by 78% if the DM is more prone to economics aspects. This value is considerably greater than the reduction of 16% observed in the case of the environmental selection strategy. Furthermore, the same optimal solution has a greater GP score when a cost-based selection strategy is adopted. The exception to this general trend is observed for M&R expenditures greater than €180,896.50, although this situation does not represent more than 25% of all optimal solutions.
As far as the neutral selection strategy is concerned, the GP values of the Pareto optimal pavement M&R strategies centre between those corresponding to the DM’s selection strategy driven by economic and environmental interests. An exception to this global trend is, however, observed in the case of the solutions corresponding to a middle range of M&R expenditures, in which the GP score of the optimal solutions corresponding to the environmental and neutral selection strategies are the same. This happens because fuzzy certainty values equal (or very close) to 0 act as identity element for the OR connector. In the fuzzy rules of the neutral strategy there are many antecedent connectors with OR operators. In general, all not-null antecedents make a contribution to the certainty of the consequent. But those which are null do not affect the consequent. In those cases, it is the antecedents related to the cost strategy which should be very close to 0. Therefore, the consequent of the neutral strategy is only determined by the antecedents related to the environmental strategy, making both to coincide.
When comparing the BOSs of each DM’s selection strategy, it can be observed that the GP values corresponding to the economic and environmental strategies are almost the same and equal to 59.5, while that corresponding to the neutral strategy is slightly inferior and equal to 52.7. In relative terms, the inexistent difference in the GP values of the BOSs driven by environmental and economic interests contrasts with a difference of 14% in the costs corresponding to the respective M&R strategies.
displays in a parallel coordinates plot the BOS for each DM’s selection strategy and the French M&R practice. In this figure, the x-axis represents the set of OFs and GP, while the left y-axis corresponds to the normalised values of the solutions calculated in relation to the maximum and minimum OF values attained by the solutions belonging to the Pareto front. Also represented in this figure (right y-axis) is the relative variation of the OF and GP values corresponding to the BOS for each DM’s selection strategy in relation to those of the current French M&R practice. These results are to be understood as follows: positive numbers mean that the BOSs improve on current French practice, while negative numbers represent a deterioration of the metrics considered.
Figure 6. Parallel coordinates plot of the BOS and the current French M&R practice (left y-axis) and relative variation of the OF and GP values associated with the BOS, in relation to the current French M&R practice. (Acronyms: LCHAC – life cycle highway agency costs; CC – climate change; HT – human toxicity; CED NRR – cumulative energy demand non-renewable resources).
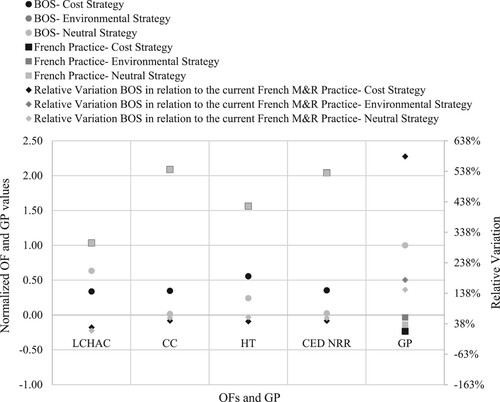
From the analysis of the parallel coordinates plot, it can be seen that the normalised values of the environmental metrics associated with the BOS for a DM’s selection strategy driven by highway agency costs are in the range of 0.34–0.55, while the normalised LCHAC is equal to 0.34. In turn, if the DM favours environmental concerns or has a neutral position, the normalised values of the environmental metrics associated with the BOS varies between approximately 0 (for CC and CED NRR) and 0.24, whereas the normalised LCHAC is equal to 0.63. These results show that the for an environmental selection strategy the way the LCHAC are taken into account by the fuzzy rules does to prevent the optimal solution from being the one with almost the lowest value of the environmental metrics. The same cannot be said about the way the environmental-related OF are taken into account by the fuzzy rules corresponding to a DM’s selection strategy driven by highway agency costs, as this OF value is found to be far from the null value (0.34).
When comparing the BOS with the solution corresponding to the current French M&R practice, the results presented in the right y-axis of show that the best optimal M&R strategy always improves on French M&R practice regardless of the OF considered. On average, a reduction of approximately 47% is obtained in the environmental metrics for a cost selection strategy, while in the case of the costs incurred by the highway agency with the M&R strategies, the reduction drops to 25%. For a selection strategy which either privileges environmental aspects or has a neutral position the values previously presented are equal to 57% and 14%, respectively. As far as the GP is concerned, the improvements in relation to the current French M&R practices are equal to 586%, 181% and 149%, for costs, environmental and neutral selection strategies, respectively.
Extension of the proposed system for a network level analysis
The case study presented previously analyses the design of sustainable pavement M&R strategies at the project level. This case study is adopted for demonstrating the capabilities of the proposed FLES using a simplified problem. Nevertheless, the proposed FLES can be directly applied to analyse road segments with different characteristics (e.g. length, M&R activities available for application, etc.).
One of the challenges faced by highway agencies relates to the complexities derived from the analysis at the network level. One of those complexities is associated with the large number of possible solutions presented in the optimal design of M&R strategies at the network level. This problem presents STxN possible solutions in a network with N sections and S possible M&R activities over a planning horizon of T years. Although some authors have tackled this problem with a holistic approach (i.e. exploring the whole space of solutions) (Torres-Machi et al. Citation2017), a common methodology consists of simplifying the problem by performing a sequential approach (Torres-Machi et al. Citation2014a). According to this approach, the problem is divided in two phases. First, the problem is solved at the project level in order to determine the optimal M&R strategy on a section-by-section basis. This is also often called bottom-up approach (Guo et al. Citation2020) and once the optimal M&R strategies are defined for each section, the DM selects the ‘candidate sections’ to be treated (i.e. network level analysis) based on existing constraints such as available budget.
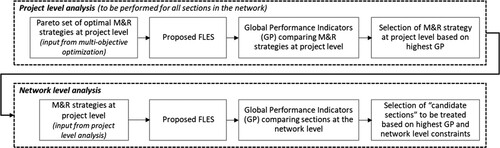
The proposed FLES can be expanded to perform network level analysis by using a sequential approach. The optimal M&R strategy at the project level will be designed following the process described in this manuscript and illustrated in the case study. In order to determine which ‘candidate sections’ in the network will be selected to receive the M&R strategy, the proposed FLES can be applied again to determine the normalised GP of each of the sections in the network. The advantage of applying the proposed FLES at the network level is that it will provide a common metric (i.e. GP) that can be used to compare the sections in the network. This indicator can then be used to solve the network problem (also known as the knapsack-based portfolio optimisation problem). depicts the overall process to follow to extend the application of the proposed FLES to perform network level analysis.
Figure 7. Proposed approach to extend the Fuzzy Logic Expert System (FLES) for a network level analysis.
Summary and conclusions
This paper presents a methodology for selecting a single solution from the Pareto optimal set obtained from the MOO of sustainable pavement M&R strategies, based on a FLES.
The capabilities of the proposed methodology were demonstrated by means of a case study consisting of determining the optimal M&R strategy for a flexible road pavement section of a typical French highway, as a result of considering simultaneously four OFs, among which three correspond to environmental metrics, and three different DM’s perspective towards costs and environmental concerns.
The results of the analysis showed that reductions in the scores of all metrics considered can be achieved by moving from the current pavement M&R practice to the BOSs. For a DM who either privileges the environmental aspects or has no preference towards economic and environmental considerations, the BOS denotes environmental metrics scores quite close to the lowest scores observed amongst all solutions laying on the Pareto front. In turn, if the DM strives for saving the expenditures associated with the M&R strategies, the BOS presents a low LCHAC value but not as low as the one corresponding to the Pareto optimal solution that performs best from this perspective.
Although the authors believe that the methodology presented in this paper can already be seen as a useful approach for helping DMs striving for more sustainable transportation infrastructure, it can still benefit from further improvements. Therefore, this research work will proceed in two main directions. Initially, the decision level for which the current version is intended for will be upgraded from the project level to the network level to ensure that the road pavement maintenance decisions taken at project level end up in optimal sustainable solutions for the whole road pavement network, according to the specific DM’s interests. This upgrade can be performed by implementing the procedure presented in the previous section. Second, the optimisation problem will be formulated as a single-objective optimisation problem in which the OF will consist of maximising the Global Performance.
Disclosure statement
The contents of this paper reflect the views of the authors, who are responsible for the facts and the accuracy of the data presented. Any inclusion of manufacturer names, trade names, or trademarks is for identification purposes only and is not to be considered an endorsement. Moreover, this paper does not constitute a standard, specification, or regulation.
Correction Statement
This article has been republished with minor changes. These changes do not impact the academic content of the article.
References
- American Association of State Highway and Transportation Officials (AASHTO), 1993. Guide for design of pavement structures. Washington, DC: American Association of State Highway and Transportation Officials.
- Augeri, M.G., Greco, S., and Nicolosi, V., 2019. Planning urban pavement maintenance by a new interactive multiobjective optimization approach. European Transport Research Review, 11 (17), https://doi.org/https://doi.org/10.1186/s12544-019-0353-9.
- AzariJafari, H., Yahia, A., and Ben Amor, M., 2016. Life cycle assessment of pavements: reviewing research challenges and opportunities. Journal Cleaner Production, 112 (4), 2187–2197. https://doi.org/https://doi.org/10.1016/j.jclepro.2015.09.080.
- Bryce, J., Flintsch, G., and Hall, R., 2014. A multi criteria decision analysis technique for including environmental impacts in sustainable infrastructure management business practices. Transportation Research Part D: Transport and Environment, 32, 435–445. https://doi.org/https://doi.org/10.1016/j.trd.2014.08.019.
- Cafiso, S., et al., 2002. Multicriteria analysis method for pavement maintenance management. Transportation Research Record: Journal of Transportation Research Board, 1816, 73–84. https://doi.org/https://doi.org/10.3141/1816-09.
- Camarena, J., et al., 2013. A simple fuzzy method to remove mixed Gaussian-impulsive noise from color images. IEEE Transactions on Fuzzy Systems, 21 (5), 971–978. https://doi.org/https://doi.org/10.1109/TFUZZ.2012.2234754.
- Chehovits, J. and Galehouse, L., 2010. Energy usage and greenhouse gas emissions of pavement preservation processes for asphalt concrete pavements. Presented at the first international conference on pavement preservation, Newport Beach, CA, USA.
- Chen, L., et al., 2015. Multiobjective optimization for maintenance decision making in infrastructure asset management. Journal of Management Engineering, 31 (6), 04015015. https://doi.org/https://doi.org/10.1061/(ASCE)ME.1943-5479.0000371.
- Chen, C. and Flintsch, G., 2007. Fuzzy logic pavement maintenance and rehabilitation triggering approach for probabilistic life-cycle cost analysis. Transportation Research Record: Journal of Transportation Research Board, 1990, 80–91. https://doi.org/https://doi.org/10.3141/1990-10.
- Chiandussi, G., et al., 2012. Comparison of multi-objective optimization methodologies for engineering applications. Computers and Mathematics with Applications, 63 (5), 912–942. https://doi.org/https://doi.org/10.1016/j.camwa.2011.11.057.
- Cohon, J. and Marks, D., 1975. A Review and evaluation of multiobjective programing techniques. Water Resources Research, 11 (2), 208–220. https://doi.org/https://doi.org/10.1029/WR011i002p00208.
- Deb, K., et al., 2002. A fast and elitist multiobjective genetic algorithm: NSGA-II. IEEE Transactions Evolutionary Computation, 6 (2), 182–197. https://doi.org/https://doi.org/10.1109/4235.996017.
- de la Garza, J.M., et al., 2011. Network-level optimization of pavement maintenance renewal strategies. Advanced Engineering Informatics, 25 (4), 699–712. https://doi.org/https://doi.org/10.1016/j.aei.2011.08.002.
- EEA, 2016. Explaining road transport emissions. A non-technical guide. Luxembourg: European Environmental Agency.
- European Union: European Commission, 2018. Communication from the commission to the European parliament, the European council, the council, the European economic and social committee, the committee of the regions and the European investment bank. A clean planet for all. A European strategic long-term vision for a prosperous, modern, competitive and climate neutral economy, 28 November 2018, COM(2018) 773 final.
- Farhan, J. and Fwa, T., 2011. Use of analytic hierarchy process to prioritize network-level maintenance of pavement segments with multiple distresses. Transportation Research Record: Journal of Transportation Research Board, 2225, 11–20. https://doi.org/https://doi.org/10.3141/2225-02.
- Farhan, J. and Fwa, T., 2012. Incorporating priority preferences into pavement maintenance programming. Journal of Transportation Engineering, 138 (6), 714–722. https://doi.org/https://doi.org/10.1061/(ASCE)TE.1943-5436.0000372.
- Ferreira, A., Antunes, A., and Picado-Santos, L., 2002. Probabilistic segment-linked pavement management optimization model. Journal of Transportation Engineering, 128 (6), 568–577. https://doi.org/https://doi.org/10.1061/(ASCE)0733-947X(2002)128:6(568).
- Flintsch, G. and Chen, C., 2004. Soft computing applications in infrastructure management. Journal of Infrastructure Systems, 10 (4), 157–166. https://doi.org/https://doi.org/10.1061/(ASCE)1076-0342(2004)10:4(157).
- Fwa, T. and Farhan, J., 2012. Optimal multiasset maintenance budget allocation in highway asset management. Journal of Transportation Engineering, 138 (10), 1179–1187. https://doi.org/https://doi.org/10.1061/(ASCE)TE.1943-5436.0000414.
- Gao, L., et al., 2012. Network-level road pavement maintenance and rehabilitation scheduling for optimal performance improvement and budget utilization. Computer-Aided Civil and Infrastructure Engineering, 27 (4), 278–287. https://doi.org/https://doi.org/10.1111/j.1467-8667.2011.00733.x.
- Giustozzi, F., Crispino, M., and Flintsch, G., 2012. Multi-attribute life cycle assessment of preventive maintenance treatments on road pavements for achieving environmental sustainability. International Journal of Life Cycle Assessment, 17 (4), 409–419. https://doi.org/https://doi.org/10.1007/s11367-011-0375-6.
- Gosse, C., Smith, B., and Clarens, A., 2013. Environmentally preferable pavement management systems. Journal of Infrastructure Systems, 19 (3), 315–325. https://doi.org/https://doi.org/10.1061/(ASCE)IS.1943-555X.0000118.
- Guinee, J., et al., 2002. Handbook on lifecycle assessment. Operational guide to the ISO standards. I: LCA in perspective. IIa: guide. IIb: operational annex. III: scientific background. Dordrecht, Netherlands: Springer.
- Guo, F., Gregory, J., and Kirchain, R, 2020. Incorporating cost uncertainty and path dependence into treatment selection for pavement networks. Transportation Research Part C: Emerging Technologies, 110, 40–55. https://doi.org/https://doi.org/10.1016/j.trc.2019.11.015.
- Hosseininasab, S.-M., et al., 2018. A multi-objective integrated model for selecting, scheduling, and budgeting road construction projects. European Journal of Operational Research, 27 (1), 262–277. https://doi.org/https://doi.org/10.1016/j.ejor.2018.04.051.
- Jiang, R. and Wu, P, 2019. Estimation of environmental impacts of roads through life cycle assessment: a critical review and future directions. Transportation Research Part D, 77, 148–163. https://doi.org/https://doi.org/10.1016/j.trd.2019.10.010.
- Jullien, A., et al., 2015. ECOLABEL. Deliverable D1.4: benchmarking exercise to assess the set of proposed indicators in diverse road case studies, 1–106.
- Kabir, G., Sadiq, R., and Tesfamariam, S, 2014. A review of multi-criteria decision-making methods for infrastructure management. Structures and infrastructure engineering: maintenance. Management. Life-Cycle Design and Performance, 10 (9), 1176–1210. https://doi.org/https://doi.org/10.1080/15732479.2013.795978.
- Kerre, E., 1998. Fuzzy sets and approximate reasoning. Xian: Xian Jiaotong University.
- Laurent, G., 2004. Evaluation économique des chaussées en béton et classiques sur le réseau routier national français. Paris: Ed. LCPC. (in French).
- Li, Y.-J. and Li, H.-N, 2018. Interactive evolutionary multi-objective optimization and decision-making on life-cycle seismic design of bridge. Advances in Structural Engineering, 21 (15), 2227–2240. https://doi.org/https://doi.org/10.1177/1369433218770819.
- Lorino, T., et al., 2008. Pavement surface characteristics evolution. Portorož, Slovenia: SURF, 1–17.
- Mendel, J, 1995. Fuzzy logic systems for engineering: a tutorial. Proceedings of the IEEE, 83, 345–377. https://doi.org/https://doi.org/10.1109/5.364485.
- Meneses, S. and Ferreira, A, 2013. Pavement maintenance programming considering two objectives: maintenance costs and user costs. International Journal Pavement Engineering, 14 (2), 206–221. https://doi.org/https://doi.org/10.1080/10298436.2012.727994.
- Meneses, S. and Ferreira, A, 2015. Flexible pavement maintenance programming considering the minimisation of maintenance and rehabilitation costs and the maximisation of the residual value of pavements. International Journal Pavement Engineering, 16 (7), 1–16. https://doi.org/https://doi.org/10.1080/10298436.2014.943207.
- Moazami, D., Behbahani, H., and Muniandy, R., 2011. Pavement rehabilitation and maintenance prioritization of urban roads using fuzzy logic. Expert Systems with Application, 38 (10), 12869–12879. https://doi.org/https://doi.org/10.1016/j.eswa.2011.04.079.
- Morillas, S., et al., 2009. Fuzzy analysis for detection of inconsistent data in experimental datasets employed at the development of the CIEDE2000 colour-difference formula. Journal of Modern Optics, 56 (13), 1447–1456. https://doi.org/https://doi.org/10.1080/09500340902944038.
- Morillas, S. and Gregori, V., 2011. Robustifying vector median filter. Sensors, 11 (8), 8115–8126. https://doi.org/https://doi.org/10.3390/s110808115.
- Ng, M., Zhang, Z., and Waller, S., 2011. The price of uncertainty in pavement infrastructure management planning: an integer programming approach. Transportation Research Part C: Emerging Technologies, 19 (6), 1326–1338. https://doi.org/https://doi.org/10.1016/j.trc.2011.03.003.
- Pérez-Martínez, P., 2012. Energy consumption and emissions from the road transport in Spain: a conceptual approach. Transport, 27 (4), 383–396. https://doi.org/https://doi.org/10.3846/16484142.2012.751051.
- Pragalath, H., et al., 2018. Deterioration assessment of infrastructure using fuzzy logic and image processing algorithm. Journal of Performance Constructed Facilities, 32 (2), 04018009. https://doi.org/https://doi.org/10.1061/(ASCE)CF.1943-5509.0001151.
- Purshouse, R., et al., 2014. A review of hybrid evolutionary multiple criteria decision making methods. Presented at the 2014 IEEE Congress on Evolutionary Computation (CEC).
- Saaty, T, 2008. Relative measurement and its generalization in decision making why pairwise comparisons are central in mathematics for the measurement of intangible factors the analytic hierarchy/network process. RACSAM – Revista de la real Academia de Ciencias Exactas, Fisicas y Naturales. Serie A. Matematicas, 102 (2), 251–318. https://doi.org/https://doi.org/10.1007/BF03191825.
- Saaty, T., Vargas, L., and Whitaker, R, 2009. Addressing with brevity criticisms of the analytic hierarchy process. International Journal of the Analytic Hierarchy Process, 1, 2. https://doi.org/https://doi.org/10.13033/ijahp.v1i2.53.
- Santero, N. and Horvath, A, 2009. Global warming potential of pavements. Environmental Research Letters, 4, 1–7. http://iopscience.iop.org/article/https://doi.org/10.1088/1748-9326/4/3/034011.
- Santero, N., Masanet, E., and Horvath, A., 2011. Life-cycle assessment of pavements. Part I: critical review. Resources, Conservation and Recycling, 55 (9–10), 801–809. https://doi.org/https://doi.org/10.1016/j.resconrec.2011.03.010.
- Santos, J., et al., 2018a. A multi-objective optimisation approach for sustainable pavement management. Structures and infrastructure Engineering: maintenance. Management. Life-Cycle Design and Performance, 14 (7), 854–868. https://doi.org/https://doi.org/10.1080/15732479.2018.1436571.
- Santos, J., et al., 2018b. A many-objective optimization model for sustainable pavement management considering several sustainability metrics through a multi-dimensionality reduction approach. In: R. Caspeele, L. Taerwe, and D.M. Frangopol, eds. Life-cycle analysis and assessment in civil engineering: towards and integrated vision: proceedings of the sixth international symposium on life-cycle civil engineering (IALCCE 2018), 28–31 October 2018, Ghent, Belgium, CRC Press 2018, 604 Pages, ISBN 1138626333.
- Santos, J., et al., 2018c. Life cycle assessment of low temperature asphalt mixtures for road pavement surface layers: a comparative analysis. resources. Conservation and Recycling, 138, 283–297. https://doi.org/https://doi.org/10.1016/j.resconrec.2018.07.012.
- Santos, J., Ferreira, A., and Flintsch, G., 2014. A life cycle assessment model for pavement management: road pavement construction and management in Portugal. International Journal Pavement Engineering, 16 (4), 268–286. https://doi.org/https://doi.org/10.1080/10298436.2014.942862.
- Santos, J., Ferreira, A., and Flintsch, G., 2015. A life cycle assessment model for pavement management: methodology and computational framework. International Journal Pavement Engineering, 16 (3), 268–286. https://doi.org/https://doi.org/10.1080/10298436.2014.942861.
- Santos, J., Ferreira, A., and Flintsch, G., 2017. A multi-objective optimization-based pavement management decision-support system for enhancing pavement sustainability. Journal of Cleaner Production, 164 (15), 1380–1393. https://doi.org/https://doi.org/10.1016/j.jclepro.2017.07.027.
- Santos, J., Ferreira, A., and Flintsch, G., 2019. An adaptive hybrid genetic algorithm for pavement management. International Journal Pavement Engineering, 20 (3), 266–286. https://doi.org/https://doi.org/10.1080/10298436.2017.1293260.
- Smith, J. and Tighe, S, 2006. Analytic hierarchy process as a tool for infrastructure management. Transportation Research Record: Journal of Transportation Research Board, 1974, 3–9. https://doi.org/https://doi.org/10.3141/1974-03.
- Sundin, S. and Braban-Ledoux, C., 2001. Artificial intelligence-based decision support technologies in pavement management. Computer-Aided Civil and Infrastructure Engineering, 16 (2), 143–157. https://doi.org/https://doi.org/10.1111/0885-9507.00220.
- Syan, C. and Ramsoobag, G, 2019. Maintenance applications of multi-criteria optimization: a review. Reliability Engineering and System Safety, 190, 106520. https://doi.org/https://doi.org/10.1016/j.ress.2019.106520.
- Tighe, S. and Gransberg, D., 2011. Sustainable pavement maintenance practices. Publication NCHRP research results digest 365. Washington, DC, USA: Transportation Research Board of the National Academies.
- Torres-Machi, C., et al., 2014a. An iterative approach for the optimization of pavement maintenance management at the network level. The Scientific World Journal, 524329, 1–12. https://doi.org/https://doi.org/10.1155/2014/524329.
- Torres-Machi, C., et al., 2014b. Current models and practices of economic and environmental evaluation for sustainable network-level pavement management. Revista de la Construcción, 13 (2), 49–56. https://doi.org/https://doi.org/10.4067/S0718-915X2014000200006.
- Torres-Machi, C., et al., 2015. Sustainable pavement management: integrating economic, technical and environmental aspects in decision making. Transportation Research Record: Journal of Transportation Research Board, 2523, 56–63. https://doi.org/https://doi.org/10.3141/2523-07.
- Torres-Machi, C., et al., 2017. Towards a sustainable optimization of pavement maintenance programs under budgetary restrictions. Journal of Cleaner Production, 148, 90–102. https://doi.org/https://doi.org/10.1016/j.jclepro.2017.01.100.
- Watts, N., et al., 2018. The 2018 report of the Lancet Countdown on health and climate change: shaping the health of nations for centuries to come. The Lancet, https://doi.org/https://doi.org/10.1016/S0140-6736(18)32594-7.
- Whitaker, R., 2007. Criticisms of the analytic hierarchy process: why they often make no sense. Mathematical and Computer Modelling, 46 (7-8), 948–961. https://doi.org/https://doi.org/10.1016/j.mcm.2007.03.016.
- WHO, 2016. Ambient air pollution: a global assessment of exposure and burden of disease. Geneva: World Health Organization.
- Wu, Z., et al., 2012. Framework for multiobjective optimization of physical highway assets Investments. Journal of Transportation Engineering, 138 (12), 1411–1421. https://doi.org/https://doi.org/10.1061/(ASCE)TE.1943-5436.0000458.
- Wu, Z. and Flintsch, G, 2009. Pavement preservation optimization considering multiple objectives and budget variability. Journal of Transportation Engineering, 135 (5), 305–315. https://doi.org/https://doi.org/10.1061/(ASCE)TE.1943-5436.0000006.
- Yepes, V., et al., 2016. Optimal pavement maintenance programs based on a hybrid greedy randomized adaptive search procedure algorithm. Journal of Civil Engineering & Management, 22 (4), 540–550. https://doi.org/https://doi.org/10.3846/13923730.2015.1120770.
- Zadeh, L., 1965. Fuzzy sets. Inform. Control, 8 (3), 338–353. https://doi.org/https://doi.org/10.1016/S0019-9958(65)90241-X.