
ABSTRACT
Accurate estimation of traffic load plays a crucial role in the economical design of pavements. The cross sectional distribution of the vehicle positions means that the traffic load is spread across the surface of the pavement. Several factors influence the distribution of vehicle positions and hence load. When wheel paths are perfectly aligned with each other, this is termed channelised traffic (or channelisation). This study investigated the impact of channelisation on asphalt pavement rutting. Data was collected on 100 sections of pavement in the city of Portsmouth, United Kingdom including vehicle/wheel positions and rut depths. Regression analysis was conducted to understand how the degree of channelisation influenced the rut depths that the traffic loading had created. The analyses revealed that the degree of channelisation of traffic has a statistically significant contribution to the progress of rutting. In this study, the difference between the maximum and minimum degrees of channelisation observed, related to a seven-fold difference in the rut depth. These findings give further guidance to pavement engineers when designing new pavements and considering the maintenance schedules for existing pavements, as it allows them to better predict the future condition and lifespan of a pavement.
Introduction
The distribution of vehicles across a pavement surface is referred to as ‘lateral wander’ (Wardle et al., Citation2003, Hjort et al., Citation2008). In instances where there is very little lateral wander, the traffic can be described as ‘channelised’. In channelised traffic, successive vehicles follow the same wheel path over a narrow cross-section of the pavement surface i.e. there is limited wander of vehicles to the left or right due to the narrow width of the lane. Few studies have considered how to categorise the traffic flow as either channelised or un-channelised. The UK design standards (Highways Agency, Citation2006b) do not consider channelisation effects, however several widely used supplementary design guides do. The Institution of Civil Engineers (ICE) design guidance suggests doubling the design traffic when channelisation is expected, to prevent premature deterioration (Walsh et al., Citation2011b). There is little empirical evidence that channelisation leads to double the traffic load or double the rate of pavement deterioration. The recommendation stems from a study conducted by Kent County Council in 1983 (Garrett, Citation1983). The rationale for the factor of two (doubling) appears to be based on a theoretical comparison of a normal distribution of vehicle positions on a wide lane and a narrow lane. Narrow lane widths are neither defined in this research nor the ICE guidance. However the ICE guidance gives examples of when a lane might be considered narrow “ … at traffic calming gateways, at entrances to bus stations or at bus stops … ” (Walsh et al., Citation2011a).
In the past, several methods have been used to measure the lateral position of vehicles (Buiter et al., Citation1989, Blab and Litzka, Citation1995, Liu and Wang, Citation2003, Timm and Priest, Citation2005, Erlingsson et al., Citation2012, Luo and Wang, Citation2013, Siddharthan et al., Citation2017, Sinanmis and Woods, Citation2019). These measurements have been analysed to find the most important parameters influencing the lateral position of vehicles in a lane/road. Many factors have been suggested, however, lane width and road width appear to be the key determinants of vehicle positions in the UK (Sinanmis and Woods, Citation2019).
Deterioration of pavements is a safety concern and rutting in asphalt pavements is a trigger in Pavement Management Systems (PMS) for maintenance to be undertaken (Robinson et al., Citation1998).
Whilst there appears to be a considerable body of literature and design guides that indicate channelisation causes rutting, the results of these studies vary and are rarely supported by field measurements (e.g. (Rust et al., Citation1994, Garrett, Citation1983)). The relationships may also be context specific, meaning that models developed in one region may not be transferable to another due to differences in climate, pavement construction materials and method, traffic loading and driving styles. Therefore, this study sought to provide empirical evidence as to the effects of channelised traffic on asphalt pavement rut depths in the UK with the City of Portsmouth as a case study, in order to add evidence to the current guidance (Walsh et al., Citation2011b) that a doubling of the deterioration is expected when channelisation occurs, or to develop new approaches based on the analyses presented in this paper.
Channelisation of traffic and flexible pavement performance
Flexible pavements consist of specifically selected stiff materials arranged in layers. Pavements are expected to have overall stability when a load is applied to the surface. The exact behaviour of flexible pavements under repeated wheel loads is difficult to predict due to the different properties of materials, the nature of loadings and their failure modes (Huhtala, Citation1995).
A large body of literature has found many factors that influence pavement deterioration, and hence lifespan. The critical determinant is the amount and type of traffic exerting a load on the pavement surface (Atkinson et al., Citation2006, Blab and Litzka, Citation1995, Buiter et al., Citation1989). The traffic load is distributed to the pavement through the axles, wheels and then the tyres of the vehicles (Pais et al., Citation2013). Hence, various design standards and guides convert different vehicle types into standard axle loads and wear factors (Highways Agency, Citation2006a). In the UK, the wear factors specified in the design standard (Highways Agency, Citation2006b) are derived from the fourth power law, where the damaging effect is proportional to the fourth power of the load exerted by a vehicle’s wheel onto the surface. Studies and design codes around the world highlight that load repetitions by heavy vehicles in particular results in considerable deterioration, which could be up to a power of 7 of the traffic load for chip sealed pavements (Collop, Citation2002, Erlingsson et al., Citation2012, Blab and Litzka, Citation1995, van der Walt et al., Citation2017a). While there is a large body of evidence as to the damaging effect of different vehicle types on the pavement; there is less evidence and guidance as to whether the distribution of traffic loads over the cross-section of the pavement influences this.
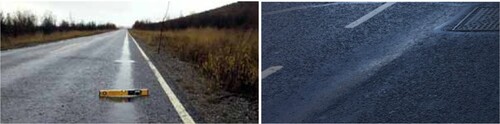
Research has shown that the widths of roads and traffic lanes are related to the degree of channelisation, with wider roads and lanes having lower levels of channelisation and vice versa (Erlingsson et al., Citation2012, Sinanmis and Woods, Citation2019, Blab and Litzka, Citation1995, Atkinson et al., Citation2006). As a result of channelisation, some studies indicate that road pavements deteriorate more rapidly when there was less/limited freedom for the wandering of wheel loads (Blab and Litzka, Citation1995, Erlingsson et al., Citation2012). There is a consensus in the literature that rutting is a common deterioration (deformation) mode of flexible pavement structures with consolidation and/or displacement of materials due to repeated load applications along the wheel paths (Erlingsson et al., Citation2012, Kasahara, Citation1982, Pais et al., Citation2013, Harvey et al., Citation2000, Brito, Citation2011, Shafiee et al., Citation2014, Blab and Litzka, Citation1995, van der Walt et al., Citation2017b). As shown in , rutting is defined as a depression or groove worn into pavement surfaces by the wheels. It is often observed at locations where there are heavy traffic volumes and overloading. The severity of rutting depends on the pavement structure, layer thicknesses, material characteristics and environmental conditions as well as the distribution, volume and composition of wheel loadings.
Figure 1. Illustration of rutting mechanism under channelised traffic (Dawson & Kolisoja, Citation2006)
Tests were also undertaken of the performance of pavement sections using Heavy Vehicle Simulations (HVS) in South Africa and by the California Department of Transport (Rust et al., Citation1994). One of the objectives of these research projects was to evaluate pavement rutting from channelised traffic through laterally guided automated vehicle control systems (AVCS), without wander, and without lateral and longitudinal forces associated with acceleration and braking (Harvey et al., Citation2000). The repetitive use of a single, precise wheel path (absence of wheel wander) resulted in an increased rate of rut depth between 25% and 45%. Temperature also has a significant effect, accelerating rutting behaviour when hotter (Rust et al., Citation1994). These test conditions demonstrated only perfectly channelised or perfectly distributed traffic, giving little in the way of guidance as to how real traffic distributions (unlikely to be either perfectly channelised or distributed) effect rutting.
To prevent premature deterioration, some research suggests that the thickness of a pavement can be increased when channelisation is expected. Blab and Litzka (Citation1995) in Netherlands expressed the lateral wander of wheel positions through a shift factor which is then applied to pavement thicknesses.
Finally, there are questions as to the causality in the relationship between channelisation and rutting. It is suggested that there is a feedback loop with channelisation causing rutting, which then further exacerbates the channelisation and so on (Aydin and Topal, Citation2016).
Summary of literature
Based on consideration of international design standards, and in the case of the UK, the limited research underpinning them, the importance of channelisation of traffic for pavement design and analysis is unclear. There is no guidance in the UK as to when traffic might be expected to be channelised and the doubling of the traffic load when this is expected is based on no empirical UK-based evidence. Therefore, this study aims to give further guidance as to the damaging effect of channelisation on flexible pavements in the UK.
Data collection and methodology
The overall methodological approach used in this study, was to compare rut depths and degrees of channelisation collected in the field, alongside other control factors, to explain the effect of channelisation on rutting in the UK.
Measurements of the degree of channelisation
The study was conducted in the City of Portsmouth, UK, as shown in , to investigate the impact of channelisation on pavement rutting.
Figure 2. Location of the study area - Clearance Parade and South Parade (Ordanance Survey, Citation2019)
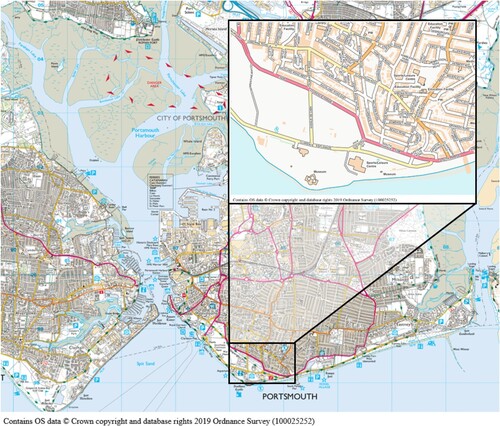
Clarence Parade/South Parade A288 () was chosen, as the type of pavement was consistent along its length (Heavy Duty Macadam (HDM) with 0/20 mm aggregate and 50 penetration binder), as confirmed by pavement core samples. In addition, there was minimal variation in traffic flow or composition and climatic and soil conditions along its length. No recent maintenance had been undertaken.
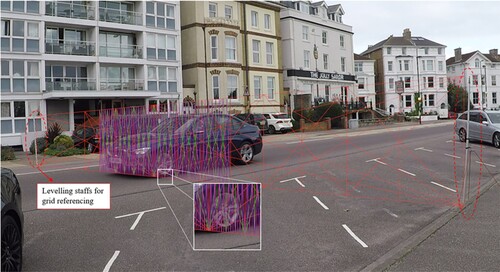
The overall road and lane widths were measured using a laser measuring device. The vehicle position data was measured through a photogrammetric technique using video recorded traffic, as described in Sinanmis and Woods (Citation2019). The video record was transferred to Adobe Premiere software and analysed with superimposition grids produced in AutoCAD, as shown in . The photogrammetric technique then divided this overall width into a number of increments of equal width. This accounted for the perspective caused by the camera position. The number of increments across the lane that the wheel passed could then be converted into a distance from the kerb. This enabled the positions of each vehicle (nearside wheel position relative to nearside kerb) to be measured, accounting for the perspective caused by the position of the video camera at one side of the road.
Figure 3. Superimposition method used in the analysis of recorded traffic flow
The overall lateral distribution of all recorded wheel paths was found to be normally distributed. The standard deviation of the first 105 vehicles at each of the 100 locations (10,500 vehicles in total) was calculated as the measure of the degree of channelisation. Although other measures of vehicle wander/channelisation are possible, such as the 95th percentile of vehicle distribution from the mean, the empirical rule suggests that the results would not be altered, if all samples are normally distributed. Full details of the measurement of the degree of channelisation in this study can be found in Sinanmis and Woods (Citation2019). Previous analyses of the same data set (Sinanmis and Woods, Citation2019) showed no difference in the distribution and vehicle wander based on vehicle type. This may be due to there being no extremely narrow road sections included in the study.
Rutting deterioration data
The rutting data was obtained from Portsmouth City Council and its Highways contractor COLAS Ltd through their annual surveys of road condition.
COLAS operate a 25 year Private Finance Initiative (PFI) highway maintenance programme on behalf of Portsmouth City Council (Finch et al., Citation2008) (11 years of contract currently remaining). This requires regular collection of pavement condition data which were provided for use in this study, including SCANNER survey (Surface Condition Assessment for the National Network of Roads) data (Department for Transport, Citation2009b). The SCANNER data were collected for different traffic lanes and directions for different years. This data includes rut depths in millimetres for the nearside (leftside) wheel paths and offside (rightside), averaged over 10 m lengths (Department for Transport, Citation2019, Department for Transport, Citation2009a).
Nearside and offside rut depths are known to differ due to the cross sectional profile (camber) of the pavements and the different dimensions of wheel tracks. This means that in most instances the nearside ruts are deeper than the offside ruts (Chen and Hugo, Citation1998, vanderWalt et al., Citation2018). Observations by the Transport Research Laboratory confirmed that nearside rut depths were on average about 20% higher than those on the offside (Potter & O'Conner, Citation1989).
When considering the lifespan or condition of a pavement, the average of deterioation across the pavement is not of interest. What is important is that no section of the pavement falls below a certain level of performance. Hence, the nearside rut is usually the determining factor in the overall rut level on a road section. As such, in this study the nearside rut was used in the analysis, rather than the offside. As the data supplied by COLAS included different traffic directions and lanes in different years, the nearside rut depths for the 100 sections included in this study were taken from one of three different survey years.
The explanatory factors collected for each of the 100 locations were as follows:
East or west bound traffic lane.
Year of rut depth data (2014, 2017, 2018).
Camber (% cross fall taken from COLAS data).
Horizontal curvature (radius of curve taken from COLAS data).
Traffic level (manual classified counts: 08:00 - 09:00 & 17:00 - 18:00)
Traffic compositon (manual peak hour classified counts).
Results and data analysis
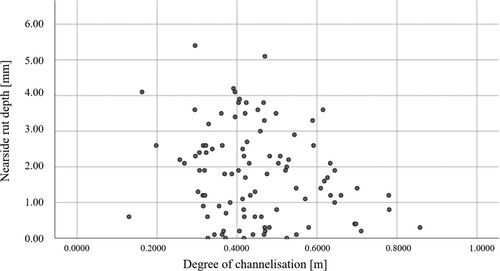
shows the rut depths recorded at each of the 100 locations used in this study.
Figure 4. 100 nearside rut depths used in the analyses.
The data were analysed to develop an explanatory model of rut depth. shows the range of values for variables included in the final model. Typical cambers in the UK range from a minimum of 2.5% (for good drainage) up to 7% (Highways England, Citation2020). The rut depths were relatively small in most sections and so, in this case, are unlikely to have influenced driving behaviours as part of the feedback loop suggested in the literature by (Aydin and Topal, Citation2016). The standard deviation of vehicle positions was used as the measure of the degree of traffic wander/channelisation.
Table 1. Descriptive statistics of variables in the analysis
The scatterplot shown in indicates that there is a negative correlation between the nearside wheel path rutting and the degree of channelisation. The Pearson Correlation Coefficient was −0.223 (p-value < 0.05), indicating sections with higher degrees of channelisation (lower standard deviations of vehicle positions) tend to have increased rut depths.
Figure 5. Scatter plot of the nearside wheel path rutting with the degree of channelisation
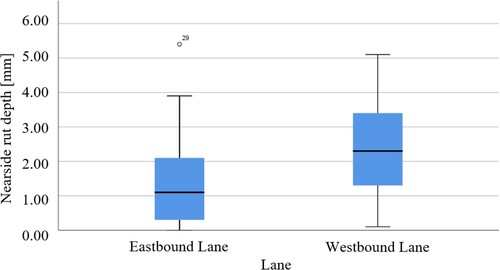
A boxplot of nearside rut depth for Eastbound and Westbound lanes can be seen in . Independent samples T-tests were undertaken on the direction of the lane to estimate whether either the Eastbound or Westbound lane was associated with a difference in the degree of channelisation. The results suggested that there is a statistically significant effect on the rut depth for the direction of the lane (p-value < 0.05).
Figure 6. Boxplot of the nearside rut depth with lane
No statistically significant bivariate correlations were found for the year of data collected, traffic levels, traffic composition, and horizontal curvature. It should be noted however, that due to the transport network in the case study area, there was little variation in traffic levels and composition along the length of the case study road.
Multivariate linear regression analyses were performed to model associations between nearside wheel path rutting and all explanatory factors. The nearside rut depth at each of the 98 road sections was used as a dependent variable to represent the pavement performance. Two outliers related to sections were removed from the original 100 sections due to being located within traffic junctions.
A stepwise removal method was used to refine the model and only those variables that were found to be statistically significant were included in the final model specification. Similarly, all two-way interaction effects were tested, but none were found to be statistically significant and were removed. The final model of nearside wheel path rutting is shown in the following equation and .
Table 2. Results of multivariate regression analysis
Nearside wheel path rutting = −1.881 (degree of channelisation) + 0.396 (camber of road) + 1.633 (direction of lane) (2)
displays the predicted value of rutting at each of the 98 locations by the model with the actual rut depths measured. This gives an indication as to the overall model fit.
Figure 7. Nearside wheel path rutting deterioration model graphical representation
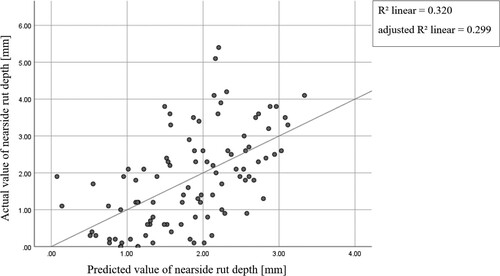
The explanatory power (R² value) of the model was found to be 0.320, and adjusted R² was 0.299. As such, around 30% of the variation in rut depth could be explained by these three variables alone. This means that 32% of the variation in rut depth could be explained by just the degree of channelisation and the camber of the lane. 68% is expected to relate to unobserved characteristics, however, this does not diminish or negate the significant role of camber and channelisation on rut depth uncovered in this work.
The loading on the pavement (standard axles), was not the focus of this study, and the traffic load and composition had little variation across the sample. As such it is suggested here that the degree of rutting predicted here, could be incorporated into wider models to predict the rut depths, which do incorporate traffic loading. For example, in the UK, the method of determining pavement strength includes standardised traffic loads, left hand lane factors for dual carriageways, and according to the ICE guidance (Walsh et al., Citation2011a), a factor of two is then applied depending on whether the road is considered channelised or not. The findings of this paper suggest that this factor of two could be removed from the model. Instead the degree of channelisation, measured as described here could be incorporated, along with camber.
One metre difference in the degree of channelisation was related to 1.881 mm difference in rut depth. The degree of channelisation varied between the 98 locations and had a standard deviation of 0.137 mm. This variation in the degree of channelisation was found to correspond to a difference in rut depths of 0.256 mm (1/5th of the standard deviation of the rut depths).
For road camber, every 1% greater the cross-fall, the nearside wheel path rutting was 0.396 mm greater. The variation in road camber observed resulted in 0.198 mm difference in rut depths.
Although bivariate analyses did not indicate a statistically significant association, the direction of the traffic lane was statistically significantly associated with rut depth in the multivariate regression analyses. The westbound direction had on average a rut depth 1.633 mm more than eastbound traffic lanes all else being equal. The variable is specific only to the case study location, but has been included in the final model as an important control for these unobserved factors.
Discussions and conclusions
It has been shown previously (Sinanmis and Woods, Citation2019) that lane and road widths relate to the degree of channelisation. The results presented in this paper indicate that this difference in channelisation relates to different rut depths forming on an otherwise consistent asphalt pavement. This is the first empirical evidence of any association in the UK and the first quantification of the magnitude of the effect since Kent County Council (Garrett, Citation1983) suggested, from a theoretical perspective that channelised traffic leads to a doubling of the pavement deterioration.
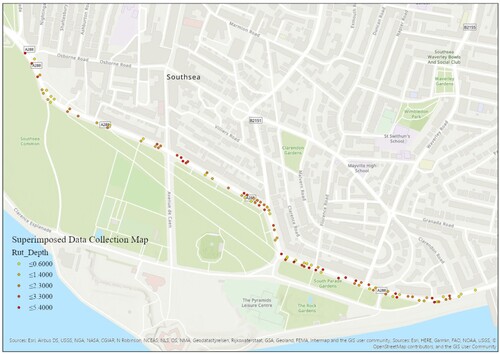
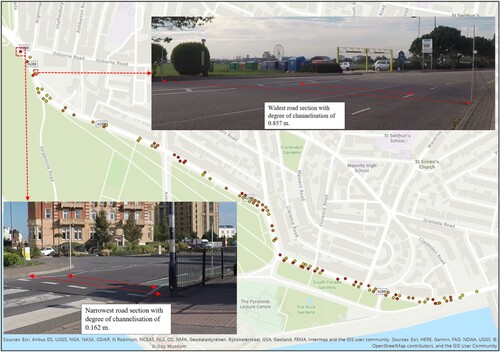
The results show a relatively large magnitude of effect between the degree of channelisation and rut depth based on the case study location and data. The results contradict the advice provided in the UK (Walsh et al., Citation2011b) as they indicate a linear relationship between channelisation and rutting, as opposed to a binary one. It should be noted that the linear relationship between channelisation and rutting, observed here, cannot be extrapolated to situations of extreme lane widths not included in this study and also to situations where deeper ruts occur. Where deeper ruts occur, feedback loops between rutting and channelisation may accelerate the formation of ruts, and hence the relationship would not be linear. shows the 98 survey locations, colour coded to indicate the deepest ruts (red) to shallowest ruts (yellow). The widest and narrowest road/lane sections are detailed.
Figure 8. Illustrated map of the degree of channelisation for narrowest and widest road sections with rut depths Dawson and Kolisoja (Citation2006, Ordanance Survey (Cartographer) (Citation2019).
The results presented here may enable pavement engineers to modify pavement thicknesses more appropriately, as opposed to simply doubling the load and thickness when channelisation is expected based on the standard deviation of vehicle positions.
Also, whilst not the focus of this study, the findings provide insights into the role of pavement camber and horizontal curvature in the formation of rutting. It is suggested here that a plausible causal mechanism through which these two geometric characteristics of highways influence deterioration is through the effect that they have on the distribution of load between the nearside and offside wheels of vehicles, with large cambers leading to higher forces exerted on nearside wheel paths and on the outer edges of horizontal curves. These findings are novel and may be explored in further research before any suggestions made to pavement design standards can be made. A key determinant found in the literature of pavement deterioration and included in all pavement design standards, is a measure of the expected traffic loading on the pavement (standardised axle loading). As this study sought to investigation the effects of channelisation only, the samples were selected to have minimal differences in vehicle composition/axle loading. As such, the findings produced here demonstrate the effect of channelisation on rutting, over and above the effect of traffic/axle loading, which are expected to be main determinants of rut formation. Further work could explore whether there are interaction effects between traffic/axle loading and the degree of channelisation, which would question the generalisability of the finds to areas with different traffic loads.
While the present investigation produced novel and useful findings, it is necessary to note the limitations of the study. The results relate to the pavement material considered. Although it may be considered logical that similar difference in rut depths would be found in other asphalt pavement types, further work would be required in order to demonstrate this. In addition, the minimal rutting meant that the feedback loops between rutting and channelisation could not be explored, which may mean that the effects presented here are an underestimate of the potential magnitude of association between vehicle wander and rutting for pavements experiencing more severe ruts. That is, as the pavement ages and ruts deepen, the effects of channelisation may accelerate.
Also, rutting is only one deterioration mode when the overall pavement performance is considered. It may be the case that there is a different or no relationship between vehicle wander and other deterioration modes, which could be explored in any further work. However, the results of this study indicate that the current guidance in the UK around channelised traffic may produce un-economic or underperforming pavements and it is recommended here that guidance be reconsidered on the basis of the evidence produced here.
In addition, recent work has addressed some issues around the deterioration models that underpin pavement management systems. These are related to the performance models for pavement behaviours that need to be developed in order to determine the deterioration mechanisms and to incorporate related maintenance and rehabilitation actions into the model.
Acknowledgements
We thank COLAS for supplying the rutting and other road geometry data. The data that support the findings of this study are available from the corresponding author, upon reasonable request.
Disclosure statement
No potential conflict of interest was reported by the author(s).
Correction Statement
This article has been corrected with minor changes. These changes do not impact the academic content of the article.
References
- Atkinson, V, Merrill, D, and Thom, N, 2006. Pavement wear factors, wokingham, berkshire. TRL.
- Aydin, M. M., and Topal, A., 2016. Effect of road surface deformations on lateral lane utilization and longitudinal driving behaviours. Transport, 31, 192–201. doi:10.3846/16484142.2016.1193049.
- Blab, R., and Litzka, J., 1995. Measurements of the lateral distribution of heavy vehicles and its effects on the design of road pavements. Proceedings of the International Symposium on Heavy Vehicle Weights and Dimensions, Road Transport Technology, 389–395.
- Brito, L., 2011. Design methods for low volume roads. Doctor of Philosophy, University of Nottingham.
- Buiter, R, et al., 1989. Effects of transverse distribution of heavy vehicles on thickness design of full-depth asphalt pavements. Transportation Research Record.
- Chen, D.-H., and Hugo, F, 1998. Full-scale accelerated pavement testing of texas mobile load simulator. Journal of Transportation Engineering, 124, 479–490. doi:10.1061/(ASCE)0733-947X(1998)124:5(479).
- Collop, A., 2002. Traffic characterisation in flexible pavement design. International Symposium on Heavy Vehicle Weights and Dimensions, 7th, 2002, Delft, The Netherlands, 2002.
- Dawson, A., and Kolisoja, P., 2006. Managing rutting in low volume roads. The European Union European Regional, Development Fund, Rovaniemi, Finland, Scientific Report, ROADEX II Final Report Part, 2.
- Department For Transport, 2009a. SCANNER surveys for local roads user guide and specification volume 1. introduction to SCANNER surveys. London: TRL.
- Department For Transport, 2009b. SCANNER surveys for local roads user guide and specification volume 1. introduction to SCANNER surveys. London: TRL.
- Department For Transport, 2019. Technical Note: Road Condition and Maintenance data London: Network Condition & Geography Statistics Branch.
- Erlingsson, S., Said, S., and Mcgarvey, T., 2012. Influence of heavy traffic lateral wander on pavement deterioration. In: (VTI), S. N. R. A. T. R. I., ed. 4th European Pavement and Asset Management Conference, 2012 Malmo, Sweden.
- Finch, A, Brangier, E., and Chaignon, F, 2008. PFI of the City of Portsmouth: Four Years on the Road-Private Finance Initiative 25 Years Contract. 2008 Annual Conference of the Transportation Association of Canada, 2008 Toronto, Canada.
- Garrett, C., 1983. Vehicle Damage Factors Present, Past and Future Values. Kent County Council The County Surveyors’ Society.
- Harvey, J. T., et al., 2000. Caltrans Accelerated Pavement Test (CAL/APT) program: Summary report: Six year period: 1994-2000.
- Highways Agency 2006a. DESIGN MANUAL FOR ROADS AND BRIDGES VOLUME 7 SECTION 2 PART 1 HD 24/06: TRAFFIC ASSESSMENT. In: Z AGENCY, H. (ed.). England: TSO (The Stationery Office).
- Highways Agency, 2006b. DESIGN MANUAL FOR ROADS AND BRIDGES VOLUME 7 SECTION 2 PART 3 HD 26/06: PAVEMENT DESIGN In: AGENCY, H. (ed.). England: TSO (The Stationery Office).
- Highways England, 2020. Highway link design. Highways England.
- Hjort, M., Haraldsson, M., and Jansen, J. M., 2008. Road Wear from Heavy Vehicles-An overview. In: TRANSPORTS, N. C. V. A. (ed.). Borlänge, Sweden.
- Huhtala, M, 1995. The effect of wheel loads on pavements. Road Transport Technology, 4), Proceedings of the Fourth International Symposium on Heavy Vehicles and Dimensions, 1995. 235-241.
- Kasahara, A, 1982. Wheel path distribution of vehicles on highway. Proceedings of a International Symposium on Bearing Capacity of Roads and Airfields. Volume, 1), Trondheim, held June 23-25, 1982., 1982.
- Liu, C, and Wang, Z, 2003. Effect of narrowing traffic lanes on pavement damage. International Journal of Pavement Engineering, 4, 177–180. doi:10.1080/1029843042000198586.
- Luo, W., and Wang, K. C., 2013. Wheel path wandering based on field data. Airfield and Highway Pavement 2013: Sustainable and Efficient Pavements.
- Ordanance Survey (Cartographer), 2019. Backdrop mapping: Scale colour raster [TIFF geospatial data]. Available from: http://digimap.edina.ac.uk/
- PAIS, J, et al., 2013. Impact of traffic overload on road pavement performance. Journal of Transportation Engineering, 139, 873–879. doi:10.1061/(ASCE)TE.1943-5436.0000571.
- Potter, J. F., and O'Conner, M. G. D., 1989. The TRRL transverse profilometer for measuring wheeltrack rutting. Wokingham: Transport and Road Research Laboratory (TRRL), Report Number RR 195.
- Robinson, R., Danielson, U., and Snaith, M. S., 1998. Road maintenance management: concepts and systems. Macmillan International Higher Education.
- Rust, F., et al. Fatigue and Rutting Performance of Conventional Asphalt and Bitumen-rubber Asphalt under Accelerated Trafficking. PROCEEDINGS OF THE 6TH CONFERENCE ON ASPHALT PAVEMENTS FOR SOUTHERN AFRICA, CAPSA'94, HELD CAPE TOWN OCTOBER 1994. VOL 1, 1994.
- Shafiee, M. H., et al., 2014. Field investigation of the effect of operational speed and lateral wheel wander on flexible pavement mechanistic responses. Transportation.
- Siddharthan, R, et al., 2017. Investigation of impact of wheel wander on pavement performance. Road Materials and Pavement Design, 18, 390–407. doi:10.1080/14680629.2016.1162730.
- Sinanmis, R., and Woods, L., 2019. Relationship between channelisation and geometric characteristics of road pavements. International Journal of Pavement Engineering, 1–8.
- Timm, D. H., and Priest, A. L., 2005. Wheel Wander at the NCAT Test Track. Report.
- Van der walt, J, Scheepbouwer, E, and West, N, 2017a. Positioning of travelling vehicles in rural New Zealand on chip sealed roads. Journal of Structural Integrity and Maintenance, 2, 227–233. doi:10.1080/24705314.2017.1388692.
- Van Der Walt, J. D., et al., 2017b. DETERIORATION COST DUE TO CAMBER FOR CHIPSEALED PAVEMENTS OVER GRANULAR BASES. In: International conference on maintenance and rehabilitation of constructed infrastructure FacilitiesSeoul: Republic of Korea.
- Vanderwalt, J., Scheepbouwer, E., and Tighe, S, 2018. Differential rutting in canterbury New Zealand, and its relation to road camber. International Journal of Pavement Engineering, 19, 798–804. doi:10.1080/10298436.2016.1208198.
- Walsh, I. D., et al., 2011a. Chapter 36 Pavement design (highways). ICE manual of highway design and management.
- Walsh, I.D., et al., 2011b. ICE manual of highway design and management.
- Wardle, L., Youdale, G., and Rodway, B., 2003. Current issues for mechanistic pavement design. Proceedings of the 21st AARB and 11th REAAA Conference 18–23 May 2003, Cairns, Queensland, Australia, 2003.