
 ?Mathematical formulae have been encoded as MathML and are displayed in this HTML version using MathJax in order to improve their display. Uncheck the box to turn MathJax off. This feature requires Javascript. Click on a formula to zoom.
ABSTRACT
Poor pavement skid resistance contributes to frequent traffic accidents, with the asphalt surface rapidly deteriorating over time. Accurate prediction of skid resistance behavior is essential for road safety. This study introduces a pavement accelerated polishing system, collecting data from 11 stages using a British pendulum tester and a high-precision three-dimensional laser scanner. It develops a predictive model, FrictionNet-II, based on a peephole long-short time memory (peephole-LSTM) neural network. The model uses data from the first eight polishing stages as input and the last three as output, allowing for predictions of pavement skid resistance after 160,000, 180,000, and 200,000 cycles based on the friction deterioration curve of the initial stages (0 to 140,000 cycles). FrictionNet-II accurately forecasts skid resistance after 160,000, 180,000, and 200,000 cycles, achieving R2 values of 88%, 90%, and 90%, respectively. This research demonstrates the potential of deep learning in predicting asphalt pavement skid resistance, laying the foundation for intelligent pavement preservation and improved skid-resistance performance.
Introduction
The operation capacity of the road network has been greatly improved in recent years following the continuous global improvement in the highway network. However, this improvement has significantly increased highway traffic accidents. More than one million people worldwide are killed yearly due to traffic accidents(Asi Citation2007), and the skid resistance of asphalt pavement is a critical factor affecting traffic safety. Inadequate skid resistance reduces the braking efficiency of vehicles, increasing driving risks and crash accidents(Mayora and Pina Citation2009). Sufficient skid resistance is an essential condition for maintaining road traffic safety(Kogbara et al. Citation2016). The skid-resistance performance of asphalt pavement gradually deteriorates due to the influence of traffic load and environmental factors, significantly increasing the incidence of traffic accidents(McCullough and Hankins Citation1966). Therefore, maintaining and improving the pavement skid resistance are major concerns for road researchers. Before exploring methods of improving the skid resistance, the attenuation mechanism of the skid resistance must first be understood(Wu et al. Citation2021). An intelligent prediction model of the skid resistance is desirable for effectively monitoring its deterioration behaviour in asphalt pavement(Zhu and Liao Citation2018, Huang and Zheng Citation2019).
Research on the deterioration behaviour of pavement skid-resistance performance has mainly been based on field data investigations. The investigations involve continuously collecting long-term multimodal indicator data pertaining to pavement skid resistance and establishing the corresponding prediction model to analyze the deterioration law of the pavement skid-resistance performance. From long-term data collected (over years), the decay curve of the antislide performance of specific roads can be obtained. For instance, the Long Term Pavement Performance (LTPP) programme in the United States built a relatively complete pavement management database after more than 30 years of research. Its purpose is to explore the long-term service performance of different pavement materials and structure combinations under diverse influencing factors (rainfall, ambient temperature, traffic load, maintenance measures, etc.,) to extend the pavement service life(Shan and Hou Citation2005, Wang and Wang Citation2013). Wang and Wang (Citation2013) investigated the long-term skid-resistance performance based on stepwise regression analysis using the data collected during Specific Pavement Studies-3 of the LTPP programme. Li et al.(Citation2017) conducted panel data analysis on the long-term skid-resistance performance of various pavement preventive maintenance treatments using the LTPP database. Furthermore, Zhan et al. (Citation2021) evaluated the effects of aggregate abrasions on pavement skid-resistance deterioration using laboratory and field-testing data from Oklahoma.
Laser scanning technology, high-resolution cameras, and computer algorithms have developed by leaps and bounds, facilitating data acquisition from high-precision images of road surfaces(Moghadas Nejad et al. Citation2016, Hoang Citation2019, Cereceda et al. Citation2022, Wang et al. Citation2022). Numerous studies on the deterioration behaviour of pavement skid resistance have been conducted by studying the decay law of the pavement texture and identifying effective textural indicators. Fractal geometry was introduced in 2013 to accurately simulate transect contour curves of pervious concrete specimens through fractal interpolation(Chen et al. Citation2013). Demonstrably, a fractal dimension can be adopted to measure the skid resistance. According to the wavelength range and corresponding spatial frequency, road texture can be classified into microscopic, macroscopic, mega-texture, and inhomogeneous(Andersen et al. Citation2015). However, among them, only microtexture and macrotexture levels affect the pavement skid resistance(Pranjić et al. Citation2020). Guan et al. (Citation2018) studied the influence of macro- and microtextures on the skid resistance of four types of aggregates and extracted several indexes, such as the polished stone value (PSV) of the pavement structure, as a variable for measuring its attenuation change. Li et al.(Citation2019) investigated the effectiveness of a laser triangulation-based portable three-dimensional (3D) scanner for exploring the effects of the changes in the textural property of the aggregate, before and after polishing, on pavement skid-resistance deterioration. Similarly, Zong et al.(Citation2021) investigated the influence of aggregate type and polishing level on the long-term skid resistance of a thin friction course. Despite extensive studies, an intelligent prediction model with high precision and stability for exploring the decay behaviour of the pavement skid-resistance performance is still lacking.
First, complete and accurate pavement surface friction data from long-term observations are critical for determining the deterioration behaviour of pavement skid resistance and developing corresponding models. Accordingly, some research teams have conducted simulations in recent years based on accelerated polishing equipment in the laboratory to acquire the pavement skid-resistance data under different conditions(Wang et al. Citation2014, ASTM Citation2015, Chen Citation2018, Xie et al. Citation2018, Ren Citation2019). The accelerated polishing equipment comprises real rubber tires to realistically simulate the tire–pavement abrasion process. It can replicate the abrasion between tires and pavements, reflecting the deterioration behaviour of the pavement skid resistance under different driving speeds, driving loads, and environmental factors. In this study, the researchers independently develop a pavement accelerated polishing system (PAPS) to collect pavement skid-resistance data at different polishing stages in the laboratory. PAPS adopts actual pneumatic tires and superimposes rolling and sliding with annular motion. Additionally, multiple samples are simultaneously abraded, significantly improving the test efficiency.
Second, the outputs from current skid-resistance deterioration models of asphalt pavement vary significantly and are sometimes contradictory. Therefore, an accurate model to consistently predict long-term pavement skid-resistance performance using a large amount of representative friction data from multiple observations is required, which is the objective of this study. A deep learning algorithm can be applied to this field to meet this objective. Without determining the actual parameters, the neural network can learn and predict the attenuation law of the pavement skid resistance using a unique deep learning algorithm. In 2018, an optimised GA-BP neural network model was proposed to predict the long-term skid resistancecite8(Zheng et al. Citation2018). A similar GM-SVR prediction model was proposed to predict the change in pavement skid resistance with time(Chen et al. Citation2021). A convolutional neural network model was then established in 2022 based on parameters related to the pavement surface texture(Lu et al. Citation2022). However, these prediction models inadequately account for the intrinsic dependencies among adjacent temporal instances within the time-series skid-resistance data of asphalt pavement and its associated prediction target. These unexplored relationships are crucial for effective real-time monitoring and sustainable long-term management of asphalt pavement skid resistance. To address this limitation, advanced deep learning technologies, such as recurrent neural networks (RNN) (Elman Citation1990) could be utilised the skid resistance time-series data of asphalt pavements. Nonetheless, the RNN architecture suffers from gradient disappearance and explosion, which weaken the generalisation ability of the networks. This problem can be overcome by using the long short-term memory (LSTM) network(Hochreiter and Schmidhuber Citation1997), which is a special RNN architecture with long- and short-term memory. LSTM has been widely employed in research involving time series prediction in transportation and civil engineering, including in predicting the performance of shield tunnels(Zhu et al. Citation2020), detecting subway tunnel damage(Zhang et al. Citation2022), predicting traffic flow(Lv et al. Citation2015), detecting unsafe behaviours on construction sites (Ding et al. Citation2017), and detecting concrete damage(Andrushia et al. Citation2022). However, in previous LSTM network applications, data transmission to the next stage mainly depended on the last moment of the time series data. Although this pattern is generally applicable, it may lead to large errors if outliers are presented within the dataset. Moreover, the traditional LSTM architecture assigns the same weight to each moment of the hidden layer neurons. However, the weights of different moments should be distinct because the subsequent stages usually contribute more than the precedent stages to forward forecasts(Liu et al. Citation2021). Pu et al. (Citation2021) introduced a novel LSTM neural network model for predicting road surface friction. Their study demonstrated that the proposed LSTM model outperformed three baseline models in terms of accuracy. Despite these advancements, further investigations have revealed that enhancing predictive precision remains a priority in certain areas. Notably, the mean absolute percentage error (MAPE) of the proposed model was found to be 15%, indicating room for improvement.
Therefore, this study aims to introduce and validate the peephole-LSTM network for predicting the skid-resistance behaviour of asphalt pavement. We independently developed a pavement accelerated polishing system, and 48 groups of pavement friction and texture data were collected over 11 polishing stages using a British pendulum tester and high-precision 3D laser scanner. The skid resistance performance of the last three polishing stages could be predicted based on the time series data of the first eight polishing stages (20,000 polishing cycles for each stage) using the proposed peephole-LSTM-based RNN model, FrictionNet-II. The findings can provide technical support for road construction and maintenance decisions, as well as supply a theoretical reference for improving the safety of highway infrastructure.
Lab testing
Data acquisition
The influencing factors of the skid resistance deterioration considered in this study were pavement surface texture, temperature, and traffic load. As shown in (a–b), the self-developed PAPS was used to conduct polishing tests on 36 standard rutting plate samples (300 mm × 300 mm × 50 mm) with SMA-13 gradation. The PAPS was equipped with ordinary pneumatic tires exerting a vertical pressure of 0–5 kN, and the running velocity was 0–60 r/min: moreover, a maximum of 12 rutting plates (3 per side) could be loaded simultaneously. The 36 rutting plates were divided into three test runs, and 16 test sites were measured for each test run (8 test sites on the corner and 8 on the sideline). The total vertical pressure and rotation rate were set to 4.5 kN and 60 r/min, respectively. Water was continuously added during the polishing process to keep the samples wet. Taking 20,000 polishing cycles as comprising a stage, 48 groups of pavement friction and texture data for a total of 11 polishing stages (including the initial stage without polishing, a total of 200,000 wears) were collected using a BM-Ⅲ pendulum tester (BPT) and a high-precision 3D laser scanner (LS-40): the test instruments are shown in (c and d). Each group of samples was labelled with labelling liquid before the test, and the running track was marked to track the polishing behaviour. Further, the polishing area was delimited based on the testing area of the BPT and the LS-40 to facilitate repeated measurements at different polishing stages.
Figure 1. Lab testing instruments.

The aggregate used in the samples was basaltic, and the specific grading of the mixture is presented in . SBS-modified asphalt, with an ideal oil-to-stone ratio of 5.84%, was used in the lab test. Limestone mineral powder was used as a filler, whereas 0.3% lignin fibre was used as the fibre component.
Table 1. Mixture gradation.
Preliminary data analysis
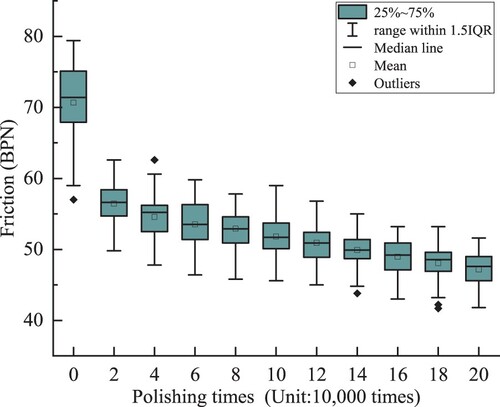
A total of 48 groups of friction and 3D texture data from 11 polishing stages (528 pairs of data points) were obtained from the wear test. The statistical box plot of the friction number is shown in . The mean and median values of the initial friction coefficient BPN were both above 70, and most of the values were distributed between 68 and 75, indicating that the rutting plate samples had excellent initial skid-resistance performance before polishing. After 20,000 polishing cycles, the skid-resistance performance of the sample surface rapidly decayed, and the mean and median values decreased by approximately 15 points mainly because the asphalt film on the aggregate surface fell off during tire–pavement interaction. The friction number after several polishing stages exhibited a slow decay trend mainly because the tire begins to polish the surface texture of the coarse aggregate after the asphalt film on the aggregate surface falls off. However, the decline in friction was relatively stable because the polishing of the aggregate surface texture is a long-term process.
Figure 2. Box plot of friction.
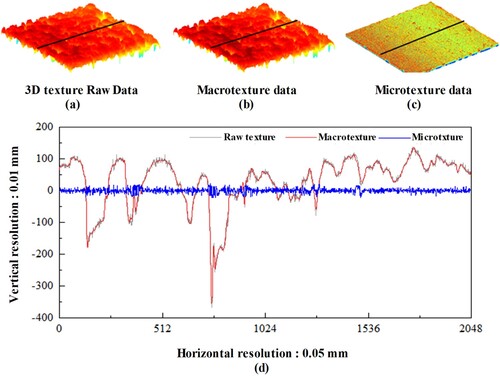
visualizes the high-resolution pavement 3D texture data collected by LS-40: (a) presents the raw pavement texture data, and (b and c) show the macrotexture (wavelength ≥ 0.5 mm) and microtexture (wavelength < 0.5 mm) data extracted via wavelet transform, respectively. The raw pavement texture can be approximated by superpositioning the macrotexture and microtexture waveforms. The multiscale profile texture waveform is shown in (d). Noticeably, the overall changing trends of the macrotexture waveform are consistent with those of the raw pavement texture waveform. However, the macrotexture waveform is smoother than the raw texture waveform, and the raw texture waveform contains more oscillations within a small range, which demonstrates the influence of microtexture.
Figure 3. Separation of pavement 3D texture.
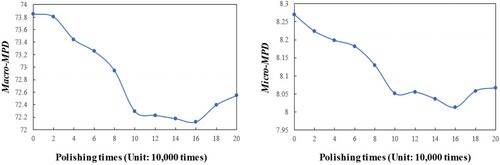
Pavement texture can be evaluated in terms of the mean profile depth (MPD) using the LS-40 3D laser scanner(ASTM Citation1845, Citation2009). Macro-MPD and Micro-MPD were selected as the evaluation indexes of the pavement texture at the macro- and microscales, respectively. As shown in , the Macro-MPD deteriorated slowly during the first 20,000 polishing cycles, and the deterioration rate then gradually increased. After 100,000 polishing cycles, this rate gradually levelled off. Intriguingly, the Macro-MPD value slightly increased after 160,000 polishing cycles. Unlike Macro-MPD, Micro-MPD exhibited a high deterioration rate from the onset, which also tended to stabilise after 100,000 polishing cycles. Similarly, the Micro-MPD value also increased slightly after 160,000 wear cycles. These phenomena are attributed to the following main reasons. At the initial stage of abrasion, the asphalt film and part of the microtexture on the aggregate surface quickly abrase. After the asphalt film falls off, the tire begins to polish the angularity of aggregate, thus beginning to deteriorate the macro- and microtexture. However, as the abrasion progresses, the pavement surface is gradually smoothed, so the macro- and microtexture change little as abrasion progresses. In the later stages, the surface aggregates begin to loosen and peel off under the action of water, temperature, and load, leading to an increase in both Macro-MPD and Micro-MPD values.
Figure 4. Decay trend of pavement texture.
Methodology
Data preparation
Randomness was incorporated into the initial experimentally obtained data set to increase its size. This increase can enable the model to learn the correct rules in the data set, thus improving its performance. Specifically, using a dataset with reasonable noise to train the neural network model can reduce the sensitivity of the model to specific inputs or parameters, thus improving its generalisation. This confers upon the model sufficient prediction accuracy for the skid-resistance performance on other data sets. Random disturbance was added by including a random value with standard distribution (a mean of 0) and a relative error level of 5% in the data set. The random values were in the range of [−1,1]. This expanded the sample size of the dataset from 48 to 192. The dataset was then randomly divided at the commonly used ratio of 4:1(Joseph Citation2022) into testing and training sets and further divided into the input and output of the corresponding dataset.
Furthermore, data normalisation was performed to eliminate the dimensional influence between indicators. Min–max normalisation, also known as deviation normalisation, which is a linear transformation of the original data whose resulting values are mapped to [0,1] was performed before training and testing.
Architecture
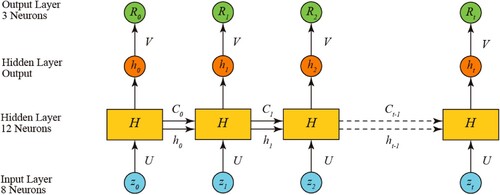
FrictionNet-II, a peephole-LSTM neural network based on an RNN architecture, was applied to predict pavement friction deterioration. FrictionNet-II was designed to overcome the problems of gradient disappearance and explosion associated with RNN through the design of its hidden layer. In addition to the output of the previous implicit layer, FrictionNet-II also takes the cell state of the previous implicit layer as the input of the next hidden layer, as shown in . This is equivalent to adding a cell state variable that varies with time in the iterative calculation of each moment, which represents the state of the hidden layer at moment t.
Figure 5. Structure of FrictionNet-II.
Corresponding to the aforementioned variable are the three gates in the hidden layer of FrictionNet-II. As shown in , the three gates are the forget, input, and output gates. Among them, the forget gate determines the forget degree of the relevant variables at the last moment, the input gate determines the input degree of the variables in the hidden layer at this time, and the output door determines the output degree of the output value of the hidden layer.
Figure 6. Structure of hidden cell of FrictionNet-II at moment t.
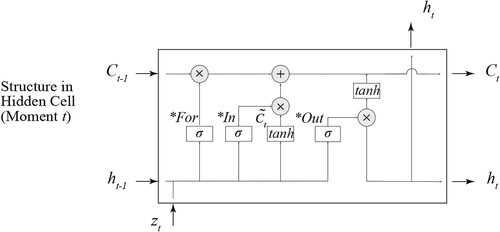
In an LSTM neural network, the three aforementioned gates take the output of the last hidden layer (ht-1) and the value of the input layer (zt) at this time as input. After decision-making through the three gates, the cell state is updated; thus, the learnt previous sequence information is reasonably forgotten and remembered. Finally, the input of the hidden layer at this moment and the updated cell state are transferred to the next moment together with the value of the input layer in the next moment as the input of the next hidden layer. Unlike in LSTM, the cell state of the last moment in FrictionNet-II is also used as the input of each gate at this moment. The iterative calculation within the hidden layer is presented in Equations 1–6.
(1)
(1)
(2)
(2)
(3)
(3)
(4)
(4)
(5)
(5)
(6)
(6) where
Table
Parameters determination
The initial assignment of variables and parameters is crucial when developing the model: they can be divided into the following two categories. As listed in , the hyperparameters need to be assigned an initial value, which then remains unchanged during model calculation. As listed in , the other variables need to be assigned an initial value, which is constantly adjusted using algorithms such as back propagation in the subsequent model calculation.
Table 2. Hyperparameter determination.
Table 3. Variables to be adjusted during training.
Results and analysis
Error-iteration graph
During one million model iterations, the value of the cost function changes with continuous updates to the weights and biases. The specific results are shown in .
Figure 7. Error-iteration graph.
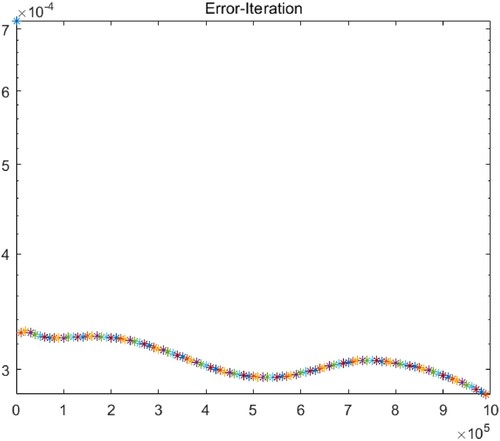
Notably, the downward trend of the whole curve is gentle, which means that the model converges gradually according to the design, validating the reliability of the fitting result. After one million iterations, the value of the cost function was very small, indicating an insignificant difference between the output value of the model and the real value and a very high model fitting accuracy. Significantly, after some fluctuations, the model still slowly approached the global minimum without falling into the local minimum. This proves that the set learning rate was reasonable because the model can escape the local minimum and continue to converge after a certain number of iterations.
Testing results
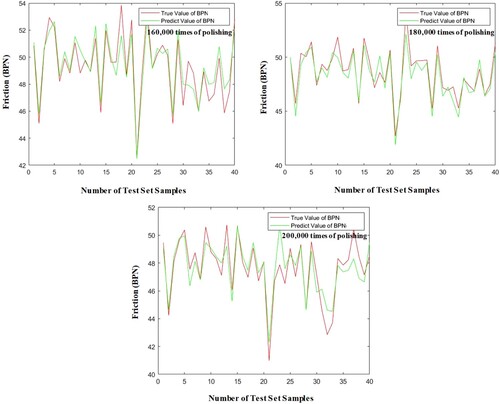
To better visualise the performance of FrictionNet-II, the actual and predicted friction values of the testing samples are plotted in . The test results reveal that the FrictionNet-II can achieve high accuracy in the test set to predict the pavement skid resistance performance accurately after 160,000, 180,000, and 200,000 polishing cycles.
Figure 8. Testing result demonstration.
Model evaluation
Finally, four indicators were selected to evaluate the goodness of fit of the model: root mean square error (RMSE), mean square error (MSE), mean absolute percentage error (MAPE), and regression coefficient (R2). Their values under 160,000, 180,000, and 200,000 polishing cycles are listed in . The pavement skid resistance performance, as represented by BPN, ranged from 0 to 100. All the RMSE and MSE values were smaller than 1, and the MAPE value was low – 1.46% on average. Furthermore, the predicted friction value was in good agreement with the actual measured friction after 160,000, 180,000, and 200,000 wear cycles, with R2 values of 88%, 90%, and 90%, respectively.
Table 4. Model evaluation results.
Conclusions
This study focused on predicting the skid-resistance performance of asphalt pavements based on the historical monitoring data of different polishing cycles, which has rarely been undertaken. A peephole-LSTM-based framework called FrictionNet-II was proposed for pavement friction prediction considering friction degradation. PAPS was independently developed by the authors to conduct the tire–pavement polishing test using standard rutting plates. Considering a stage of 20,000 polishing cycles, parallel data sets comprising 11 polishing stages (a total of 200,000 polishing cycles) were collected using a BM-Ⅲ pendulum tester for friction data and a high-precision 3D laser scanner for 3D texture data from 48 testing sites on 36 rutting plates.
The pavement skid resistance performance deterioration was preliminarily analyzed. The results indicated that the skid resistance performance of asphalt pavement decayed faster at the beginning due to shedding of the asphalt film and traffic polishing. The tire then began to polish the aggregate angularity, thus worsening the skid resistance performance. As the abrasion progressed, the pavement surface was gradually smoothed, and the rate of deterioration in the skid-resistance performance slowed. Finally, under the action of water, temperature, and load, the surface aggregates began to loosen and peel off, thereby increasing the pavement texture values.
Randomness was then added to the initial experimentally obtained data set to reasonably expand the size of the dataset from 48 to 192. Thereafter, 75% of the data population was randomly selected to train FrictionNet-II. The inputs were the historical friction data of the first eight polishing stages, whereas the outputs were the corresponding future friction data of the last three polishing stages. Subsequently, the remaining 25% of friction data were processed in FrictionNet-II for validation and testing. The results demonstrated that FrictionNet-II could accurately predict the pavement skid resistance from the historical data with small RMSE, MSE, and MAPE values. The predicted friction value was in good agreement with the actual measured friction after 160,000, 180,000, and 200,000 polishing cycles, with R2 values of 88%, 90%, and 90%, respectively.
Overall, the proposed model can accurately predict the evolution of pavement skid resistance over time by analyzing previous pavement wear conditions. The achieved prediction accuracy is notably high. The outcomes of this study have the following significant implications:
The predicted results facilitate the evaluation of the service life of specific road sections, considering skid resistance limitations.
By manipulating various influencing factors, such as load and temperature, strategies to mitigate the adverse effects of pavement wear can be devised.
The findings can aid in formulating road traffic regulations, maintenance schedules, and other related planning activities.
However, further research is needed in several aspects. First, although only peephole-LSTM was tested for model development, other advanced algorithms could also be applied for comparison to improve the prediction accuracy. Second, 200,000 polishing cycles are still limited, and more influencing factors should be considered. For road sections with a large traffic volume, only the early deterioration behaviour of the pavement skid-resistance performance can be simulated. In the future, the amount and categories of data will be expanded and the polishing increased to study the long-term service performance of the pavement.
The experimental apparatus generalises a motor vehicle roadway. Accordingly, FrictionNet-II presented in this study exhibits a degree of applicability to analogous roadways. However, this model is unsuitable for roads designed for specific purposes, such as sidewalks, due to their distinctive characteristics. Therefore, future studies should consider the functionality of the road and increase the generalizability of the prediction model. To achieve the aforementioned, considering potential factors, expanding the dataset, and adding validation set, among others, can be implemented.
Furthermore, it is essential to address the absence of a comparative model within the dataset. Thus, to verify the advantages and efficacy of the peephole LSTM model, additional baseline models should be incorporated for a comprehensive evaluation in future investigations. These comparative analyses can grant the scientific community deep insights into the model’s strengths and limitations, fostering progress in the field of predictive modelling of road skid resistance.
Disclosure statement
No potential conflict of interest was reported by the author(s).
Funding
This work was supported by the National Natural Science Foundation of China [grant number 52008354], China Postdoctoral Science Foundation [grant number 2021T140572], Natural Science Foundation of Sichuan Province [grant number 2022NSFSC0437], and Science and Technology Project of Sichuan Transportation Department [grant number 2022-ZL-02].
References
- Andersen, L.G., et al., 2015. Rolling resistance measurement and model development. Journal of Transportation Engineering, 141 (2), 04014075. doi:10.1061/(ASCE)TE.1943-5436.0000673.
- Andrushia, A.D., et al., 2022. Autonomous detection of concrete damage under fire conditions. Automation in Construction, 140, 104364. doi:10.1016/j.autcon.2022.104364.
- Asi, I.M., 2007. Evaluating skid resistance of different asphalt concrete mixes. Building and Environment, 42, 325–329. doi:10.1016/j.buildenv.2005.08.020.
- ASTM, 1845. Standard practice for calculating pavement macrotexture mean profile depth. ASTM International, Annual Book of ASTM Standards West Conshohocken, PA.
- ASTM, 2009. Standard test method for measuring pavement macrotexture properties using the circular track meter. E2157-09.
- ASTM, 2015. Standard practice for accelerated polishing of aggregates or pavement surfaces using a small-wheel, circular track polishing machine. E660-90
- Cereceda, D., et al., 2022. Roughness and condition prediction models for airfield pavements using digital image processing. Automation in Construction, 139, 104325. doi:10.1016/j.autcon.2022.104325.
- Chen, Y., et al., 2013. Evaluation of surface textures and skid resistance of pervious concrete pavement. Journal of Central South University, 20, 520–527. doi:10.1007/s11771-013-1514-y.
- Chen, B., 2018. Research on asphalt pavement skid resistance performance evaluation method based on tire-pavement effective contact characteristics. Guangzhou: South China University of Technology.
- Chen, X., et al., 2021. Improved GM-SVR combined prediction model of pavement skid resistance condition based on finite data. Journal of Physics: Conference Series, IOP Publishing, 2044 (No. 1), 012111.
- Ding, L., et al., 2017. A deep hybrid learning model to detect unsafe behavior: integrating convolution neural networks and long short-term memory. Automation in Construction, 86, 118–124. doi:10.1016/j.autcon.2017.11.002.
- Elman, J.L., 1990. Finding structure in time. Cognitive Science, 14 (2), 179–211. doi:10.1207/s15516709cog1402_1.
- Guan, B.W., et al., 2018. Influence of macrotexture and microtexture on the skid resistance of aggregates. Advances in Materials Science and Engineering, 2018, 9.
- Hoang, N.D., 2019. Automatic detection of asphalt pavement raveling using image texture based feature extraction and stochastic gradient descent logistic regression. Automation in Construction, 105, 102843. doi:10.1016/j.autcon.2019.102843.
- Hochreiter, S. and Schmidhuber, J., 1997. Long short-term memory. Neural Computation, 9, 1735–1780. doi:10.1162/neco.1997.9.8.1735.
- Huang, X. and Zheng, B., 2019. Research status and progress for skid resistance performance of asphalt pavements. China Journal of Highway and Transport, 32, 32–49.
- Joseph, V. Roshan, 2022. Optimal ratio for data splitting. Statistical Analysis and Data Mining: The ASA Data Science Journal, 15 (4), 531–538. doi:10.1002/sam.11583.
- Kogbara, R.B., et al., 2016. A state-of-the-art review of parameters influencing measurement and modeling of skid resistance of asphalt pavements. Construction and Building Materials, 114, 602–617. doi:10.1016/j.conbuildmat.2016.04.002.
- Li, Q.J., et al., 2017. Panel data analysis of surface skid resistance for various pavement preventive maintenance treatments using long term pavement performance (LTPP) data. Canadian Journal of Civil Engineering, 44, 358–366. doi:10.1139/cjce-2016-0540.
- Li, Q.J., et al., 2019. 3D characterization of aggregates for pavement skid resistance. Journal of Transportation Engineering Part B-Pavements, 145, 11.
- Liu, Z., et al., 2021. Hard-rock tunnel lithology prediction with TBM construction big data using a global-attention-mechanism-based LSTM network. Automation in Construction, 125, 103647. doi:10.1016/j.autcon.2021.103647.
- Lu, J., et al., 2022. A novel noncontact method for the pavement skid resistance evaluation based on surface texture. Tribology International, 165, 107311. doi:10.1016/j.triboint.2021.107311.
- Lv, Y., et al., 2015. Traffic flow prediction with big data: a deep learning approach. IEEE Transactions on Intelligent Transportation Systems, 16, 865–873.
- Mayora, J.M.P., and Pina, R.J., 2009. An assessment of the skid resistance effect on traffic safety under wet-pavement conditions. Accident Analysis & Prevention, 41, 881–886. doi:10.1016/j.aap.2009.05.004.
- McCullough, B.F., and Hankins, K., 1966. Skid resistance guidelines for surface improvements on Texas highways. Highway Research Record, 131.
- Moghadas Nejad, F., et al., 2016. Automatic image acquisition with knowledge-based approach for multi-directional determination of skid resistance of pavements. Automation in Construction, 71, 414–429. doi:10.1016/j.autcon.2016.08.003.
- Pranjić, Ivana, et al., 2020. Influence of pavement surface macrotexture on pavement skid resistance. Transportation Research Procedia, 45, 747–754. doi:10.1016/j.trpro.2020.02.102.
- Pu, Ziyuan, et al., 2021. Road surface friction prediction using long short-term memory neural network based on historical data. Journal of Intelligent Transportation Systems, 26 (1), 34–45.
- Ren, W., 2019. Study on the abrasion characteristic of surface texture and its effect on noise for asphalt pavements. (PhD). Chang’an University (In Chinese).
- Shan, L., and Hou, X., 2005. A review of the progress of LTPP. Journal of China & Foreign Highway, 25 (5), 51–55.
- Wang, D.W., et al., 2014. Study of micro-texture and skid resistance change of granite slabs during the polishing with the Aachen Polishing Machine. Wear, 318, 1–11. doi:10.1016/j.wear.2014.06.005.
- Wang, Y.C., et al., 2022. Automatic extraction and evaluation of pavement three-dimensional surface texture using laser scanning technology. Automation in Construction, 141, 13.
- Wang, H., and Wang, Z.L., 2013. Evaluation of pavement surface friction subject to various pavement preservation treatments. Construction and Building Materials, 48, 194–202. doi:10.1016/j.conbuildmat.2013.06.048.
- Wu, X.R., et al., 2021. Influencing factors and mechanism for the attenuation of the skid resistance for bauxite clinker-asphalt mixtures. Construction and Building Materials, 283, 9.
- Xie, X., et al., 2018. Influence of temperature on polishing behaviour of asphalt road surfaces. Wear, 402–403, 49–56. doi:10.1016/j.wear.2018.02.002.
- Zhan, Y., et al., 2021. Effect of aggregate properties on asphalt pavement friction based on random forest analysis. Construction and Building Materials, 292, 10. doi:10.1016/j.conbuildmat.2021.123467.
- Zhang, Y., et al., 2022. Subway tunnel damage detection based on in-service train dynamic response, variational mode decomposition, convolutional neural networks and long short-term memory. Automation in Construction, 139, 104293. doi:10.1016/j.autcon.2022.104293.
- Zheng, D., et al., 2018. Prediction and sensitivity analysis of long-term skid resistance of epoxy asphalt mixture based on GA-BP neural network. Construction and Building Materials, 158, 614–623. doi:10.1016/j.conbuildmat.2017.10.056.
- Zhu, H., et al., 2020. Similarity search and performance prediction of shield tunnels in operation through time series data mining. Automation in Construction, 114, 103178. doi:10.1016/j.autcon.2020.103178.
- Zhu, H., and Liao, Y., 2018. Present situations of research on anti-skid property of asphalt pavement. Highway Research Record, 63, 35–46.
- Zong, Y.J., et al., 2021. Effect of aggregate type and polishing level on the long-term skid resistance of thin friction course. Construction and Building Materials, 282, 10.