
 ?Mathematical formulae have been encoded as MathML and are displayed in this HTML version using MathJax in order to improve their display. Uncheck the box to turn MathJax off. This feature requires Javascript. Click on a formula to zoom.
ABSTRACT
Recent research using the semicircular bending (SCB) test with 100 mm diameter specimen cored from gyratory compacted samples demonstrated the suitability of this sample size for testing dense graded asphalt mixes with a nominal maximum aggregate size (NMAS) of up to 19 mm. Alongside the gyratory compactor, the Marshall compactor remains part of current specifications in many countries, including ASTM international standards. The Marshall compactor uses a 4-inch (101.6 mm) mould, which is slightly larger than the gyratory compactor’s 100 mm mould, and employs a different compaction effort, resulting in different aggregate orientation. This study investigates potential differences in the fracture properties of SCB test specimens compacted using different methods. Sample thicknesses of 30 , 40 , and 50 mm were evaluated in the SCB test at 25°C under a monotonic loading rate of 1 mm/min. A total of 81 specimens were prepared from three asphalt mixes with NMAS of 14 mm and 20 mm, including two dense graded asphalt mixes and one stone mastic asphalt mix. The fracture properties, including fracture energy, fracture toughness, and cracking resistance index (CRI) were evaluated. The study found that the repeatability, evaluated via the coefficient of variation, ranged from 1.1% to 21.7%, with an average value of 8.3%. A directly proportional relation was observed for indexes from the 100 mm and 150 mm samples using the gyratory compactor. The Marshall compactor specimens yielded higher fracture toughness and fracture energy values, while the CRI values were approximately 1.23 times those obtained from the gyratory compactor. This result shows that different compaction methods have direct effect on the fracture properties of SCB test specimens, emphasising the importance of considering compaction methods for the SCB test when determining the threshold value of cracking resistance for asphalt mixes, especially in the balanced mix design for asphalt mixes.
1. Introduction
The semicircular bending (SCB) test is popularly used by researchers and practitioners for evaluating the susceptibility of asphalt concrete to cracking. Various SCB test standards have been developed to assess cracking resistance at different temperatures. Examples include AASHTO TP (AASHTO Citation2015) and ASTM D8044-16 (ASTM Citation2016) for intermediate temperatures and AASHTO TP (AASHTO Citation2018) for low temperatures. In Europe, the SCB test adheres to the EN 12697-44 standard (EN12697-Citation44 Citation2010). The European standard does not prescribe a specific parameter or criterion to characterise cracking resistance. Instead, it only focuses on characterising the tensile strength and fracture toughness of asphalt concrete to characterise the propagation of cracks within asphalt concrete. Note that the European standard defines the SCB test as for cracking propagation characterisation while crack initiation should be characterised by the fatigue tests. Thus, the use of the European standard is different from the AASHTO and ASTM standards for the SCB test in which a parameter to characterise the cracking resistance, including the initiation and propagation process, is described in both the AASHTO and ASTM standards. Despite differences among international standards, the SCB standards uniformly adopt half-cylinder samples with a diameter of 150 mm, either from cores or compacted samples.
Recent investigations have explored the viability of using 100 mm diameter core samples for SCB testing. For the extensive literature review of the applicability of 100 mm diameter samples, the readers are encouraged to read earlier works (Lu Citation2016, Lu and Saleh Citation2017, Lu et al. Citation2021). These works summarise the main developments to date to point out the potential of the method as well as the current gaps. Past studies have agreed that SCB tests can be conducted on 100 mm diameter samples with mix designs featuring up to a 19 mm nominal maximum aggregate size (NMAS) in dense graded asphalt mixes (Lu et al. Citation2021, Lu et al. Citation2021). Furthermore, a comparison between the SCB cracking resistance index using 100 mm cored samples and the fatigue life of the four-point bending fatigue test shows a positive relationship between the flexibility index (FI index) and the fatigue life of asphalt materials (Lu et al. Citation2020). Earlier research has demonstrated that fracture properties and cracking resistance indexes from gyratory compacted 150 mm diameter samples can be correlated with those from 100 mm cored samples in a directly proportional relation. However, the effects of compaction methods and using samples directly from compacted materials instead of cores remain unexplored.
It is worth noting that alongside the widely used gyratory compactor, the Marshall compactor is still being used by several countries (Lu and Saleh Citation2017, Pérez Madrigal et al. Citation2017, Vacková and Valentin Citation2021). The Marshall compactor employs a 4-inch (101.6 mm) mould and a 6-inch (152.4 mm) mould, slightly larger in diameter than the gyratory compactor moulds, and employs a distinct compaction energy approach Several studies have examined the impact of compaction methods on the volumetric and mechanical properties of asphalt mixtures. For instance, Oliver’s study (Oliver Citation2008) looked into the asphalt mix design and volumetric properties, comparing gyratory and Marshall compaction methods. The study found that the angle of aggregate orientation in both gyratory and Marshall is not similar to the field conditions, although gyratory compaction was found to be closer, indicating the difference in aggregate packing of the two compaction methods. In another study (Kök et al. Citation2014), it was found that samples from the field are less affected by compaction level than laboratory samples. The study found that Marshall compaction was more effective for high compaction temperatures than gyratory compactors, while the opposite trend was witnessed at lower compaction temperatures. The findings indicated that the Marshall compactor is more sensitive to compaction temperature than the gyratory compactor due to the impact compaction scheme. Zhang et al. (Zhang et al. Citation2020) found that the Marshall method is more sensitive to aggregate gradation than gyratory compaction. In particular, the authors found that coarse aggregate had more influence on Marshall than gyratory, while medium and fine aggregate had a greater effect on gyratory compaction. For mixtures with coarse and fine aggregates, the Marshall method was found to be more sensitive, and for medium aggregate gradations, both compaction methods showed significant differences (Zhang et al. Citation2020). Ribas and Thives (Citation2019) compared different compaction methods with the fields, including gyratory compactors, Marshall compactors, and French rollers. The study employed different angles of compaction for the gyratory test. It was observed that Marshall compaction and gyratory compaction with angles of 0.75°, 1°, and 1.25° were the closest to the field samples. In another study by Polaczyk et al. (Citation2018), it was found that controlling the air void content of samples in a gyratory compactor by the number of gyrations was not possible due to the significant variation in the results. Regarding the mechanical test comparison, Kök et al. (Citation2014) found that the compaction level affects the results of the indirect tensile repeated load test the most for Marshall compaction, followed by the gyratory sample and finally the field samples. They also found that the indirect tensile stiffness modulus (ITSM) of field samples is the least sensitive to the sample air void content, while the ITSM from gyratory compacted samples was the most sensitive to the air void content. Sreedhar et al. (Citation2018) conducted the SCB test at 25 °C on field and gyratory compacted samples. The study concluded that the gyratory compactor produced an unrealistic aggregate skeleton due to the excessive compaction effort, resulting in samples with higher stiffness and lower ductility compared to their field-compacted counterparts. In another study, Ghoroghi et al. (Citation2023) used samples from different compaction methods to evaluate the cracking resistance via the fracture toughness of the asphalt mixes in the edge-notched disk bend (ENDB) test. The study found that at low temperatures, samples from gyratory compaction exhibited higher fracture toughness, while at intermediate temperatures, the samples from the Marshall compactor yielded higher fracture toughness than the gyratory samples. Similar results were also reported by (Haghighatpour and Aliha Citation2023). Peng and Sun (Citation2014) observed that samples from the Marshall compactor were more homogeneous in the horizontal cross section at the top and bottom of the samples than the gyratory compactor, indicating that the possible results in the IDT test were due to the dominant nature of variation in maximum stresses related to horizontal homogeneity.
To date, few direct comparisons between Marshall and gyratory samples have been studied for the SCB test. Most investigations only mention the sample size employed. Even the current standards lack a direct correlation between the different sample preparation methods (e.g. compaction methodology). Hence, establishing a correlation between the two methods, both widely used globally, has become necessary. Notably, the Marshall apparatus is more cost-effective and practical for field sampling and testing, as it allows manual compaction instead of relying on air pressure systems and automatic advanced compaction equipment. However, the absence of a one-to-one correlation potential could lead to disparate result reports considering the differences in compaction schemes. Furthermore, within the subset of gyratory-compacted samples, understanding the possible effects of varied compacted sample sizes (100 vs. 150 mm) alongside core comparisons is necessary. Note that while cores suit field samples, employing compacted samples is more relevant for laboratory scenarios. Thus, finding a possible correlation between laboratory compacted samples will avoid the need for additional coring steps prior to testing.
In summary, this study primarily aims to achieve two novel objectives:
Compare the fracture behaviour of samples compacted using a Marshall compactor versus a gyratory compactor using 100 mm and 150 mm mould diameters.
Investigate the influencing factors, including asphalt sample thickness, aggregate size, and gradation, on SCB test results.
Ultimately, this exploration of 100 mm samples, either from cores or compacted samples using different compaction methods, can contribute to advancing the cracking characterisation of asphalt concrete using the SCB test .
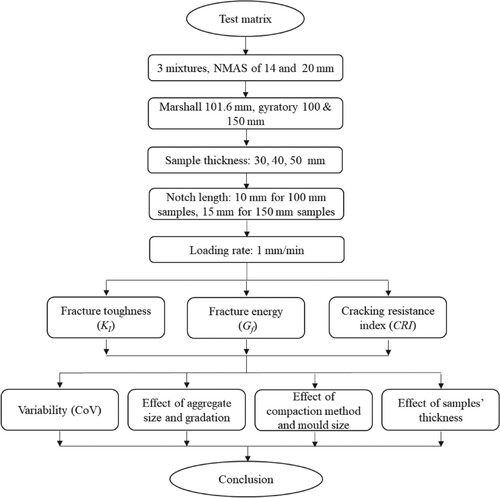
Figure 1. Flow chart of the research scheme.
2. Material and mixture design
The research was conducted on three different aggregate gradations, including two dense-graded asphalt (DGA) mixes and a stone mastic asphalt (SMA) mix. The two DGAs were designated AC14 and AC20, reflecting asphalt mixes with nominal maximum aggregate sizes (NMAS) of 13.2 mm and 19 mm, respectively. Meanwhile, the SMA mix was denoted as SMA14, having an NMAS of 13.2 mm. The aggregate gradation envelopes of these mixes are depicted in . The composition of aggregates varied according to the mix type. AC14 comprised a combination of white granite and sandstone aggregates, whereas AC20 and SMA14 were formulated with basalt and sandstone aggregates. In terms of additives, hydrated lime was incorporated at a proportion of 1% of the aggregate mass for both AC14 and AC20. Conversely, SMA14 utilised hydrated lime at a higher proportion of 1.7% of the aggregate mass. Additionally, SMA14 included 0.3% cellulose fibre by mix mass to avoid any drain-off issue of SMA at high binder content. The study used three different bitumen types, graded as C170, C320, and A10E, in accordance with the Australian system. C170 and C320 represent conventional (unmodified) bitumen, categorised based on their viscosity in Pa.s at 60°C. On the other hand, A10E is a high-performance polymer (SBS)-modified bitumen specially designed for pavements subjected to heavy traffic loads. AC14 and AC20 were designed with a binder content of 5.1% by the mass of the mix, whereas SMA14 had a higher binder content of 6.2%. The fundamental properties of the bitumen types are summarised in .
Figure 2. Gradation curves of asphalt mixtures including AC14, AC20, and SMA14.
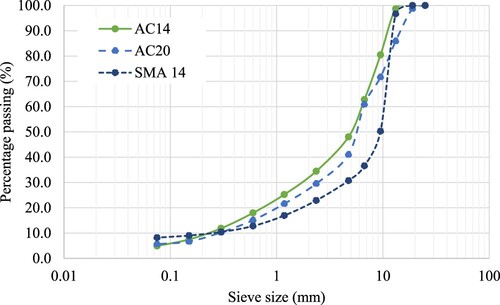
Table 1. Basic properties of the binders.
The mixing temperature for AC14 using the C320 binder was 155°C, and the samples were compacted at 150°C. AC20 using the C170 binder was mixed at 142°C and compacted at the same temperature. SMA14 was mixed and compacted at 163°C.
3. Semicircular bending test
3.1. Sample preparation
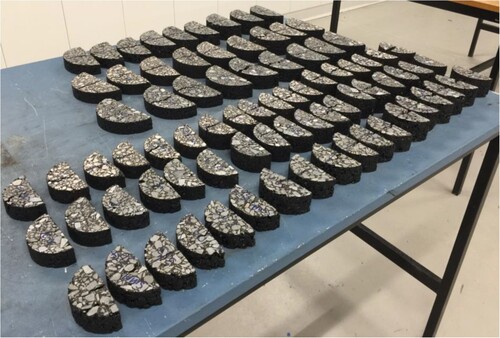
In previous studies (Lu et al. Citation2020, Lu et al. Citation2021, Lu et al. Citation2021), 100 mm diameter samples were extracted by coring 100 mm specimens from 150 mm cores compacted by the superpave gyratory compactor. However, in this study, a distinct approach was adopted in which all samples were taken directly from compacted specimens. This approach specifically omits coring the perimeter surface. This approach was pursued to explore the potential impact of compaction-related alterations resulting from the arrangement of aggregates along the specimen walls, which could influence test outcomes. The procedural steps include the compaction of cylindrical samples, subsequent trimming of the top and bottom surfaces, cutting cylinder samples into smaller cylinder samples (e.g. 30, 40, and 50 mm thick), and cutting of cylindrical specimens into halves, which were then notched to form SCB samples. The SCB test sample preparation procedure is illustrated in . Within the scope of this study, three sample thicknesses (t) were investigated: 30 , 40 , and 50 mm. It is noteworthy mentioning that the use of gyratory compactors can accommodate thick samples (e.g. 70 mm or higher) without issues. However, the constraints imposed by the Marshall method typically restrict the sample height to a range of 65 to 70 mm. Upon trimming both ends to ensure smooth surfaces and mitigate the potential impact of differences in the air void content at the sample's top and bottom, it was observed that smooth preparation of up to 50 mm thick samples for Marshall compaction was achievable. This study used 10 mm as a standard notch length (a) for both gyratory 100 mm and Marshall samples. The 10 mm notch length was found to be suitable for 100 mm diameter samples, while the 15 mm notch length was applied to 150 mm diameter samples, resulting in an approximate ratio of notch length to sample radius of 0.2. The notch thickness was approximately 1 ± 0.5 mm. Each configuration (comprising compaction method, sample diameter, and thickness) was replicated three times and subsequently subjected to testing. The study used different air void contents for asphalt mixes: 5% for AC14, 4% for AC20, and 7% for SMA14. As a result, a total of 81 samples were prepared and tested. Test specimens for the SCB are shown in .
Figure 3. Sample preparation illustration for the SCB test from cylindrical compacted samples either from the gyratory compactor or Marshall compactor.
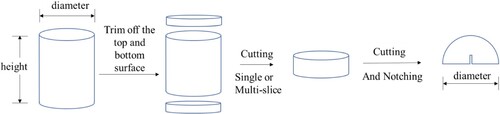
Figure 4. SCB test samples prepared in the laboratory.
3.2. Testing and property determination
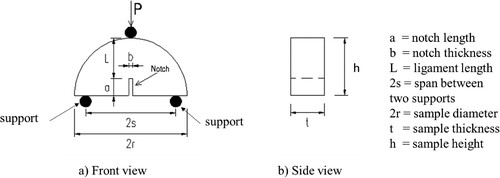
The SCB test scheme is illustrated in . The SCB test setup was based on a three-point bending loading, with spans (2 s) of 80 mm and 120 mm for the 100 mm and 150 mm diameter samples, respectively. This setup provides a similar span-to-diameter ratio (2s/2r) of 0.8 for both diameters.
Figure 5. Testing scheme of the SCB test and sample dimension explanation: a) front view, b) side view
Samples were conditioned at 25 °C for at least two hours before testing. A loading rate of 1 mm/min was used for all the samples. This loading rate was chosen based on previous works focusing on similar approaches (Lu Citation2016, Lu and Saleh Citation2017, Lu et al. Citation2020, Lu et al. Citation2021, Lu et al. Citation2021). Notably, in the study by Lu et al. (Citation2020), the SCB test using a 1 mm/min loading rate on 100 mm diameter samples showed a fairly good correlation between the flexibility index and the fatigue life in the four-point bending test. For further details on the effect of the loading rate on the SCB test, readers are recommended to refer to the study (Lu et al. Citation2021), which explores the effect of loading rates from quasi-static (0.5 mm/min) to 10 mm/min for 100 mm and 150 mm SCB samples. Additional discussion on the loading rate for 150 mm SCB samples, ranging from 0.1 mm/min to 10 mm/min, can be found in (Nsengiyumva et al. Citation2016), and faster loading rates up to 50 mm/min for 150 mm SCB samples were further explored by Fakhri et al. (Citation2018).
The study considered fracture toughness (mode I), fracture energy, and the cracking resistance index (CRI). Equations 1, 2, and 3, adopted by the work of Lim et al. (Citation1993), were used to calculate the plain strain fracture toughness, KI (N/mm1.5), of asphalt mixes.
(1)
(1)
(2)
(2)
(3)
(3) where:
(N/mm2) and Pmax (N) are the maximum applied stress and maximum applied load, respectively.
a is the notch length in mm
r is the radius in mm
EquationEquation 3(3)
(3) depicts the formulation of the normalised mode I stress intensity factor YI, which is used for the case of the support span-to-diameter ratio (s/r) of 0.8.
The fracture energy (Gf) is calculated as per EquationEquation 4(4)
(4) . Gf is the fracture work needed to fracture a ligament area of the SCB sample as per AASHTO TP 105-13 (AASHTO Citation2015) and AASHTO TP 124-18 (AASHTO Citation2018) standards. In EquationEquation 4
(4)
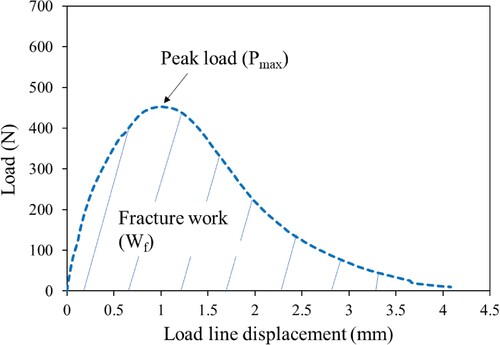
(4) , Wf is the fracture work or strain energy (N.mm), calculated as the area under the load‒load line displacement curve, as shown in . The ligament area is the product of the ligament length L (mm) and sample thickness t (mm).
(4)
(4) The fracture energy indicates the energy needed to fracture the samples considering the macro level of the sample without considering either linear or nonlinear elastic fracture mechanics (LFFM and N-LEFM), in which the fracture process zone could be an elastic dominant zone or elasto-plastic zone. In fact, the fracture energy indicates the work needed to fracture the samples, which could involve the fracture process of linear, nonlinear plastic or viscoelastic deformation. Although the fracture process zone relates to the relation of the meso-level of the material, the macro behaviour is of concern. The materials with higher fracture energy indicate greater energy needed to fracture the samples and thus greater cracking resistance.
Figure 6. A typical result from the SCB test depicting the load –displacement relationship
The CRI is determined as per EquationEquation 5(5)
(5) as the ratio of fracture energy (Gf) and peak load (Pmax). In its original study, this index was reported with high consistency in the test result and capability of differentiating the fracture resistance of different asphalt mixtures (Kaseer et al. Citation2018). Previous study by the authors also showed that this index has low variation with distinct differences between the mixtures, therefore, providing a clear ranking of asphalt mixtures (Lu et al. Citation2021).
(5)
(5)
4. Results and discussion
This section looks into the fracture behaviour of asphalt mixes considering the effect of aggregate size and gradation, sample thickness, sample diameter, and compaction method. plots the typical load‒displacement curves of the three asphalt mixes. displays the effect of sample thickness, while illustrates the effect of different compaction methods.
Figure 7. Typical load–displacement curves of SCB test samples of different asphalt mixes at a typical thickness of 30 mm.
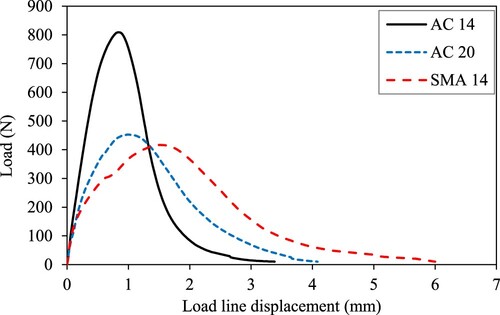
Figure 8. Typical results of SCB samples of different thicknesses.
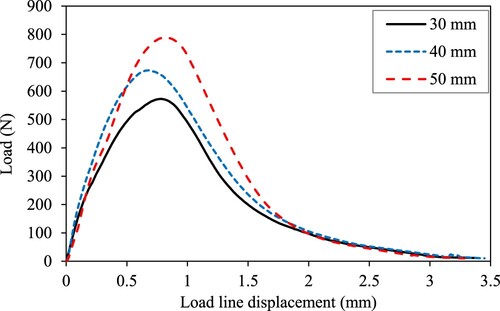
Figure 9. Typical load–displacement curves of SCB test samples of different compaction methods and diameters.
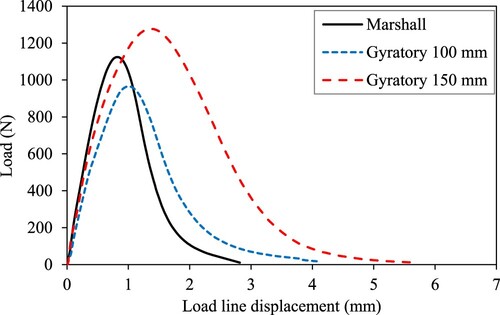
demonstrates the effect of the different types of asphalt mixes, with the SMA, which contains a higher binder content and a higher air void, tending to exhibit smaller peak loads, but the post peak curves are longer and flatter. The dense graded coarse mix AC20 tends to have a slightly higher peak load than SMA but reaches the peak load in a shorter time. AC14 tends to have a significantly higher peak load value than the other asphalt mixes but also has a higher rate of reduction in load resistance after the post peak, showing the cracking propagation process (). Changing the thickness of the specimens did not change the overall trend or the distinction between the mixes, as shown in . Different compaction methods indicate differences in the load‒displacement curves, especially when comparing 100 mm gyratory compaction with 101.6 mm Marshall compaction. The Marshall compacted specimens tend to result in samples with higher peak loads, and the curves tend to have sharper load reductions after the peak ().
Repeatability is one of the main concerns when using smaller samples for asphalt concrete tests, not only for the SCB test but also for other mechanical asphalt tests. This part investigates the repeatability first before examining the influencing factors on the test results of asphalt mixes in the SCB test, such as aggregate size and gradation, compaction method and diameter, and sample thickness. The repeatability of the test results is plotted in . The results show that the average coefficient of variation (CoV) of fracture toughness is 6.7%, and the sole value of CoV for the asphalt samples falls in the range of 1.1% and 12.5%, indicating the high repeatability of the test results. The average CoV of 150 mm is 6.5%, while this value for the 100 mm gyratory compactor is 6.6%, and for Marshall is 6.9%. The fracture energy also shows an average CoV of 9.9%, which is rather similar to the fracture toughness, although it is slightly higher. These results are generally expected because the fracture energy includes the fracture process of heterogeneous asphalt composites, normally resulting in higher randomness than the peak load-based parameter, as in the case of fracture toughness. The 150 mm specimens have an average CoV of 8.0%, while the 100 mm gyratory compacted specimens resulted in 10.9%, while the 101.6 mm Marshall samples gave 10.8%. Based on the t tests statistical analysis for the different diameters and compaction methods, the results indicate that the difference in CoV is not statistically significant based on a 0.05 level of significance. In summary, the fracture energy and fracture toughness results for both diameters indicated high repeatability.
Figure 10. Repeatability of the SCB test results measured by the coefficient of variation of (a) KI, (b) Gf, and (c) CRI for three different thickness of 30, 40, and 50 mm samples.
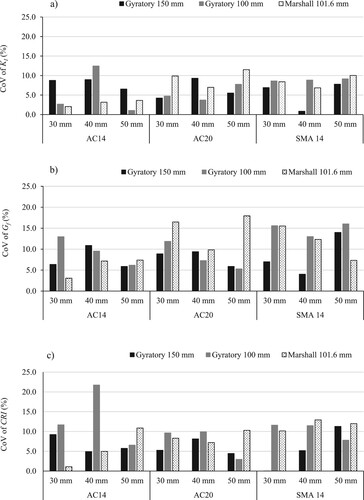
For the CRI, the average CoV was 6.0%, 10.4%, and 6.8% for the 150 mm, 100 mm compacted with the gyratory compactor, and 4 in. (101.6 mm) compacted with the Marshall compactor, respectively. The results indicate that both the Marshall and gyratory methods had similar consistency and slightly higher CoVs than the 150 mm diameter samples (in the case of 100 mm gyratory compaction), but the difference was not significant. Independent studies on the CRI using 150 mm samples from a gyratory compactor (Batioja-Alvarez et al. Citation2019, Nsengiyumva and Kim Citation2019, Majidifard et al. Citation2021, Seitllari et al. Citation2022) also confirmed the good repeatability of the CRI and comparable CoV values to the results in this study.
In summary, the repeatability of the test results calculated for two mechanical parameters and one cracking resistance index shows a reasonable comparison to 150 mm samples, also in the good range of consistency (normally lower than 15%).
4.1. Effect of aggregate size and gradation
The aggregate gradation and the NMAS of asphalt mixtures play a significant role in determining the mechanical properties of these materials. Practical codes and standards regulate the NMAS for mechanical testing, taking into account factors such as sample size, including diameter, thickness, and their combinations. In addition to NMAS, aggregate gradation also influences the mechanical behaviour of asphalt materials. Variations in aggregate gradation, such as dense graded, open graded, or gap graded stone mastic asphalt, result in different material properties. When reducing sample sizes for testing, it is crucial to ensure the consistency of test results while considering the effects of both NMAS and gradation. A previous study (Lu et al. Citation2021) found that for dense graded asphalt mixes with NMAS up to 19 mm, both 100 mm cores and 150 mm compacted samples exhibited similar repeatability. However, questions arise when dealing with smaller diameter samples, such as 100 mm, especially due to the potential near-wall effects of aggregates and variations in compaction methods. In this study, the fracture toughness of AC14 showed an average CoV of 5.5%, with a fracture energy of 7.7% and a CRI of 8.5%. For AC20, the CoVs for fracture toughness, fracture energy, and CRI were 7.1%, 10.3%, and 7.4%, respectively. Similarly, SMA14 exhibited CoVs of 7.5%, 11.3%, and 9.2% for fracture toughness, fracture energy, and CRI, respectively. These results indicate that while different gradations and NMAS may lead to slight variations in results, overall, there is no significant difference, and all mixtures demonstrate a satisfactory level of repeatability in the test results.
4.2. Effect of compaction method and mould diameter
Mechanical tests of asphalt concrete mixes are known to be size dependent. Additionally, different compaction methods can result in various orientations of aggregate structures, especially the near wall effect on aggregate structure (or sample structure) when altering the mould size, as well as in the case of impact compaction in comparison to continuous compaction with applied shear angle.
Samples compacted using the 100 mm diameter mould of the gyratory compactor had approximately 9% higher fracture toughness than the fracture toughness achieved from samples prepared with 150 mm mould gyratory compactor (a). Note that the ‘line of equity’ in the figure represents the data points where the horizontal value is equivalent to the vertical value.
Figure 11. Compaction method and mould size analysis based on fracture toughness (a), fracture energy (b), and cracking resistance index (c).
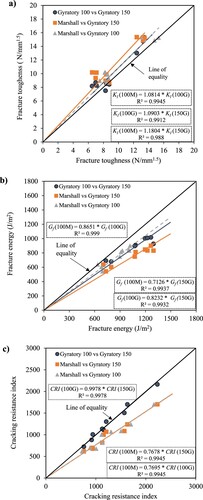
In past studies, for cores with a 100 mm diameter, the fracture toughness was found to be similar to the fracture toughness from 150 mm samples (Lu et al. Citation2021). Among the different compaction methods and sizes, samples compacted using the Marshall method exhibited the highest fracture toughness, approximately 8% and 18% higher than the 100 mm and 150 mm gyratory samples, respectively. The results indicate that both the compaction method and mould size have an influence on the test results, in which the compaction method was found to have a stronger influence than the mould size.
The fracture energy shows an opposite trend to that of the fracture toughness. Samples from the Marshall compactor displayed a fracture energy approximately 13% lower than that of samples from the 100 mm gyratory compactor and approximately 29% lower than that of the 150 mm samples (b). Among the gyratory compacted samples, it was observed that the 100 mm gyratory samples exhibited an approximately 18% lower fracture energy compared to the 150 mm samples. Note that in a previous study, when comparing the fracture energy from 100 mm cores and 150 mm compacted samples, it was found that the 150 mm compacted samples had a fracture energy 21% higher than that of 100 mm core samples (Lu et al. Citation2021). These findings indicate a similarity in the results between cores and compacted samples, with a mere 3% difference in the fracture energy results. A recent study on changes in the diameter of SCB test samples also concluded that increasing the diameter results in higher fracture energy values (Pirmohammad et al. Citation2024).
Regarding the mechanism behind the effect of compaction method and sample size on the mechanical properties (e.g. fracture toughness, fracture energy), it is thought that different compaction processes produce different aggregate orientations and material arrangements (material packing), resulting in varying microstructures (e.g. bitumen and mastic) and mesostructures (e.g. mastic and aggregate) within the SCB sample (Oliver Citation2008, Peng and Sun Citation2014). Furthermore, Peng and Sun (Citation2014) found that the horizontal cross-sections of samples from a Marshall compactor were more homogeneous than those from a gyratory compactor. These factors might contribute to the macro-behaviour of the SCB test at different levels. Wills et al. (Citation2019) conducted numerical simulations of the SCB test, considering the homogeneity of the materials in the samples. The study found that non-uniform distributions of materials within SCB specimens could produce variability of around 10%.
Regarding the CRI, samples from the 100 mm gyratory compactor had similar CRI results to samples from the 150 mm gyratory compactor (c). Meanwhile, the results from the Marshall compactor were approximately 0.77 times that of the CRI from the gyratory compactors. Recalling the results from a previous study, samples of 100 mm from cores had CRI values 8% higher than those of the 150 mm samples (Lu et al. Citation2021). Overall, the results indicate the interchangeability between different mechanical parameters when changing the compaction methods and mould size.
4.3. Effect of thickness
Three different sample thicknesses ranging from 30 to 50 mm were produced for both diameters and compaction methods to investigate the effect of sample thickness on the mechanical values (see ). Note that in a previous study (Lu et al. Citation2021), samples of 100 were obtained from cores compared with 150 compacted from the gyratory compactor. In this study, all samples were compacted samples and thus can provide information on the possible effect due to the aggregate arrangement near the walls of the mould rather than the case of the core in which the aggregate is trimmed and cut. In addition, the investigation at different thicknesses also provides a mapping exchange of the mechanical parameters when the sample thickness is changed.
Figure 12. Thickness dependency analysis for fracture toughness (a), fracture energy (b), and cracking resistance index (c).
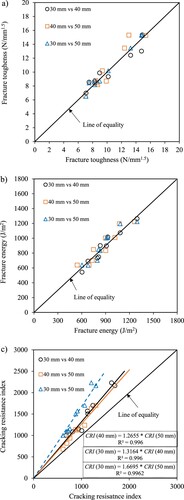
In terms of the fracture toughness, different thickness samples yielded average CoV values of 6.3%, 6.8%, and 7.0% for the 30 , 40 , and 50 mm thick samples, respectively. No significant difference was found in the CoV of the samples when changing the thickness. Comparison of the fracture toughness between different thicknesses shows that 30 mm samples had similar fracture toughness to 40 mm and to 50 mm, with p values of 0.966 and 0.904 when comparing pairs of 30 mm to 40 mm and 30 mm to 50 mm, respectively. Recalling the results in previous work of 150 gyratory compacted samples vs 100 mm cores (Lu et al. Citation2021), the finding in that study is also similar to this study, indicating that the fracture toughness is independent of the sample thickness within the investigated range (e.g. 30 to 50 mm thick samples), regardless of compacted and core samples with either diameter or compaction method used. This again concluded that the suitability of the theory developed by Lim et al. (Citation1993) for fracture toughness is applicable for bonded graded materials, such as in the case of asphalt concrete.
Regarding fracture energy, the 30 mm thick samples had an average CoV of 10.9%, while the 40 mm thick samples had an average CoV of 9.3%, and the 50 mm thick samples had an average CoV of 9.6%. No statistically significant difference was found in the CoV of the samples when changing the thickness, although the thicker thickness tends to be slightly better in the result consistency. A comparison of the fracture energy between different thicknesses shows that 30 mm samples had similar fracture energies to 40 mm and 50 mm, with p values of 0.94 and 0.873 when comparing pairs of 30 mm vs 40 mm and 30 mm vs 50 mm, respectively. Recalling the results in previous work of 150 gyratory compacted samples compared to 100 mm cores (Lu et al. Citation2021), the findings in that study for the comparison of 30 and 40 mm were similar to the findings of this current work. This indicates that the fracture energy is thickness independent for the investigated range from 30 mm to 50 mm, regardless of the compaction method or sample diameter. Past literature also reported similar findings when comparing the fracture energy from the SCB test using 150 mm gyratory compacted samples, using thicknesses from 30 mm to 60 mm (Nsengiyumva et al. Citation2016), or from 25 mm to 60 mm, as in another study (Rivera-Perez et al. Citation2018).
The CRI results show that the average CoV of the 30 mm thick samples was 7.4% for all the samples, while it was 9.6% for the value of 40 mm and 8.0% for 50 mm. No statistically significant difference was found in the CoV of the samples when changing the thickness. In contrast to the mechanical properties, the CRI is thickness dependent. It was found that the CRI (equivalent to the ratio of Gf/Ppeak) of a smaller sample was higher than that of a thicker sample because different thicknesses all have similar fracture energies, but smaller samples yielded lower peak loads. The approximation of the change in the 10 mm thick samples resulted in an average of 32% from 30 to 40 mm and 27% from 40 to 50%. A previous study with 150 mm and 100 mm cores indicated that the CRI changed by approximately 34% from 30 to 40 mm samples (Lu et al. Citation2021), which is rather similar to the results of this study. Comparison to independent research by other studies (Kaseer et al. Citation2018, Batioja-Alvarez et al. Citation2019) also reached a similar conclusion of thickness dependent of the CRI, noting that the comparison only went with 150 mm diameter using a gyratory compactor.
5. Conclusions
The study investigated the effect of the compaction method, aggregate size, gradation, sample diameter and thickness on the consistency of the test results and the fracture behaviour of asphalt concrete at intermediate temperature in the SCB test. Three asphalt mixtures with different aggregate gradations up to 19 mm NMAS, including two dense gradations and one SMA asphalt mix, were used. The samples were prepared using a Marshall compactor with mould diameter of 101.6 mm and a gyratory compactor using 100 and 150 mm mould diameters. Based on the results and analyses, the study concluded the following:
The testing scheme at 1 mm/min resulted in good consistency of the test results for smaller samples. Both the 100 mm gyratory and Marshall tests showed low CoV values. The 150 mm gyratory showed slightly lower variation, but the CoV was not significantly different from that of the 100 mm or 101.6 mm samples. Among the mechanical parameters and indexes, the variations in fracture toughness and CRI are low. The fracture energy has a slightly higher variation regardless of the diameter.
Between gyratory compaction methods, 100 mm shows approximately 10% higher fracture toughness than 150 mm samples and 18% lower fracture energy but similar CRI values. Between Marshall and 100 mm gyratory compaction, the Marshall method shows 8% higher fracture toughness, 13% lower fracture energy, and 23% lower CRI values.
The sample thickness shows a negligible effect on the fracture toughness of the samples considering thicknesses of 30 to 50 mm. The fracture energy also showed similar results, while the CRI of thicker samples had a significantly lower value than that of thinner samples.
Overall, the results of this study suggest that the SCB test can also be conducted on 100 mm compacted samples from a gyratory compactor or from a Marshall compactor using a 101.6 mm mould. The aggregate size and gradation were found to slightly affect the consistency of the test results. The NMAS study also indicates that NMAS up to 19 mm and the minimum thickness of 30 mm samples can be used with a loading rate of 1 mm/min. The study also found that the mechanical results from different compaction methods are not similar but correlated, providing the conversion of the mechanical parameters or index that are size dependent.
Disclosure statement
No potential conflict of interest was reported by the author(s).
References
- AASHTO, 2013. Standard method of test for determining the fracture energy of asphalt mixtures using the semicircular bend geometry (SCB). AASHTO TP 105-13. Washington, DC: American Association of State and Highway Transportation Officials.
- AASHTO, 2018. Standard method of test for determining the fracture potential of asphalt mixtures using the flexibility index test (FIT). AASHTO TP 124. Washington, DC: American Association of State and Highway Transportation Officials.
- AASHTO, T., 105-13 (2015), 2015. Standard method of test for determining the fracture energy of asphalt mixtures using the semicircular bend geometry (SCB). Washington.: American Association of State and Highway Transportation Officials.
- AASHTO, T., 124-18, 2018. Determining the fracture potential of asphalt mixturres using the flexibility index test (FIT). Washington.: American Association of State and Highway Transportation Officials.
- ASTM, 2016. D8044 - 16. standard test method for evaluation of asphalt mixture cracking resistance using the semi-circular bend test (SCB) at intermediate temperatures. West Conshohocken, PA: ASTM International.
- Batioja-Alvarez, D., Lee, J., and Haddock, J. E., 2019. Understanding the Illinois flexibility index test (I-FIT) using Indiana asphalt mixtures. Transportation Research Record, 2673 (6), 337–346.
- EN12697-44, 2010. “Bituminous mixtures - Test methods for hot mix asphalt. Part 44: Crack propogation by semi-circular bending test.” European Committee for Standardisation.
- Fakhri, M., et al., 2018. The effect of loading rate on fracture energy of asphalt mixture at intermediate temperatures and under different loading modes. Frattura e Integrita Strutturale, 12 (43), 113–132.
- Ghoroghi, S. S., et al., 2023. Comparative cracking resistance-cost study for the hot mix asphalt (HMA) mixtures made of natural and recycled asphaltic materials. Fatigue & Fracture of Engineering Materials & Structures, 46 (11), 4199–4217.
- Haghighatpour, P. J., and Aliha, M., 2023. The influence of recycled asphalt pavement materials on low and intermediate fracture behavior of asphalt concrete (AC) after exposing to different thawing and freezing periods. Engineering Fracture Mechanics, 293, 109715.
- Kaseer, F., et al., 2018. Development of an index to evaluate the cracking potential of asphalt mixtures using the semi-circular bending test. Construction and Building Materials, 167, 286–298.
- Kök, B. V., Yilmaz, M., and Alataş, T., 2014. Evaluation of the mechanical properties of field-and laboratory-compacted hot-mix asphalt. Journal of Materials in Civil Engineering, 26 (9), 04014064.
- Lim, I., Johnston, I., and Choi, S., 1993. Stress intensity factors for semi-circular specimens under three-point bending. Engineering Fracture Mechanics, 44 (3), 363–382.
- Lu, D. X., 2016. Evaluation of warm mix asphalt performance incorporating high reclaimed asphalt pavement content. Master's thesis. Canterbury University.
- Lu, D. X., Bui, H. H., and Saleh, M., 2021a. Effects of specimen size and loading conditions on the fracture behaviour of asphalt concretes in the SCB test. Engineering Fracture Mechanics, 242, 107452.
- Lu, D. X., et al., 2021b. Experimental and numerical investigations of non-standardised semi-circular bending test for asphalt concrete mixtures. International Journal of Pavement Engineering, 22 (8), 960–972.
- Lu, D. X., and Saleh, M., 2017. Investigation of applicability of the semicircular bending test for 100-mm diameter asphalt concrete specimens. Transportation Research Board 96th Annual Meeting. No. 17-00792.
- Lu, D. X., Saleh, M., and Nguyen, N. H., 2020. Evaluation of fracture and fatigue cracking characterization ability of nonstandardized semicircular-bending test for asphalt concrete. Journal of Materials in Civil Engineering, 32 (8), 04020215.
- Majidifard, H., et al., 2021. Development of a balanced cracking index for asphalt mixtures tested in semi-circular bending with load-LLD measurements. Measurement, 173, 108658.
- Nsengiyumva, G., and Kim, Y.-R., 2019. Effect of testing configuration in semi-circular bending fracture of asphalt mixtures: experiments and statistical analyses. Transportation Research Record, 2673 (5), 320–328.
- Nsengiyumva, G., You, T., and Kim, Y.-R., 2016. Experimental-statistical investigation of testing variables of a semicircular bending (SCB) fracture test repeatability for bituminous mixtures. Journal of Testing and Evaluation, 45 (5), 1691–1701.
- Oliver, J., 2008. A review of Austroads gyratory compaction research. Austroads. AP-T94/08.
- Peng, Y., and Sun, L.-J., 2014. Horizontal homogeneity in laboratory-compacted asphalt specimens. Road Materials and Pavement Design, 15 (4), 911–924.
- Pérez Madrigal, D., et al., 2017. Effect of mixing time and temperature on cracking resistance of bituminous mixtures containing reclaimed asphalt pavement material. Journal of Materials in Civil Engineering, 29 (8), 04017058.
- Pirmohammad, S., Momeni, R., and Khanghahi, S. H., 2024. Effect of SCB specimen size on mode I fracture parameters of asphalt concrete at low and intermediate temperatures. Theoretical and Applied Fracture Mechanics, 104314.
- Polaczyk, P., et al., 2018. Evaluation of the hot mix asphalt compactability utilizing the impact compaction method. Construction and Building Materials, 187, 131–137.
- Ribas, C. Y., and Thives, L. P., 2019. Evaluation of effect of compaction method on the macrostructure of asphalt mixtures through digital image processing under Brazilian conditions. Construction and Building Materials, 228, 116821.
- Rivera-Perez, J., Ozer, H., and Al-Qadi, I. L., 2018. Impact of specimen configuration and characteristics on Illinois flexibility index. Transportation Research Record, 2672 (28), 383–393.
- Seitllari, A., et al., 2022. Assessment of cracking performance indices of asphalt mixtures at intermediate temperatures. International Journal of Pavement Engineering, 23 (1), 70–79.
- Sreedhar, S., Coleri, E., and Haddadi, S. S., 2018. Selection of a performance test to assess the cracking resistance of asphalt concrete materials. Construction and Building Materials, 179, 285–293.
- Vacková, P., and Valentin, J., 2021. Comparison of fracture parameters obtained from modified semi-circular bending (SCB) test. Roads and Bridges-Drogi i Mosty, 20 (2), 173–187.
- Wills, J., Caro, S., and Braham, A., 2019. Influence of material heterogeneity in the fracture of asphalt mixtures. International Journal of Pavement Engineering, 20 (7), 747–760.
- Zhang, H., Yu, T., and Huang, Y., 2020. Comparative analysis of HMA aggregate variability based on impacting and gyratory compaction. Construction and Building Materials, 242, 118055.