ABSTRACT
This paper analyses the association between five prominent indicators of occupations’ exposure to the risk of automation owing to a greater use of artificial intelligence (AI) in goods and service provision or workforce management, and employment change between 2011 and 2021 in Australia. Whilst much of international research has focused on innovation leaders, notably the U.S.A. Australia is a more typical, moderately innovative economy. The study explores employment change in four industry sectors with rather different development trajectories, and for vacancy data. Indicators of automation risk that seek to capture current technological capacity rather than future potential are more frequently found to be associated with employment change. However, patterns vary between sectors, over time, and by the time spent performing specialist tasks in occupations. Whereas a frequent assumption is that AI may displace labour, the present analyses show occupations deemed to be at greater risk of automation to have expanded.
KEYWORDS:
1. Introduction
This paper reports on the findings of an exercise using automation risk indicators (ARI) to describe employment change in Australia between 2011 and 2021. These indicators share as their conceptual starting point that advances in digital technology and artificial intelligence (AI) place certain occupations at risk of automation, that is, replacing human workers with robotic or digital workers, or at least markedly changing the content of the work that humans perform.
Research into the impact of technological change on employment because of a changing composition of job tasks is not new but has regained attention with the growth in advanced digital technologies and, notably, AI. Prominent earlier studies looked, amongst others, at the role of introducing computers in workplaces in reshaping demand for routine manual and cognitive tasks (Autor, Levy, and Murnane Citation2003) and the polarisation into ‘lousy and lovely’ jobs because of skill-based technological change (Goos and Manning Citation2007).
The more recent surge in the production of ARI can be traced back to Frey and Osborne (Citation2013) who estimated that about 47% of US jobs were at risk of automation. Their study sent shockwaves around circles of policymakers and encouraged replications and modifications, resulting in alternative at-risk-of-automation estimates for the US (Brynjolfsson, Mitchell, and Rock Citation2018; Felten Raj, and Seamans Citation2018, Citation2019), OECD countries (Arntz, Gregory, and Zierahn Citation2016; Nedelkoska and Quintini Citation2018), and in various national studies (for example, Edmonds and Bradley Citation2015; Fossen and Sorgner Citation2019).
Early ARI suggested that mainly occupations at the lower end of the skills spectrum would be affected by automation – and potentially face displacement. The OECD (Citation2021, 6), for instance, concluded that employment in OECD countries ‘grew less’ (between 2012 and 2019) in occupations previously estimated (in 2012) to be at high risk of automation, and that ‘low-educated individuals’ appeared to be disproportionately affected. These findings were later revised when it was concluded that there was ‘no clear relationship between AI exposure and employment growth’ (Georgieff and Hyee Citation2022, 3). Instead, the authors linked exposure to AI to the current use of computers, suggesting a continuity in technology use across occupations. In a further update to earlier OECD studies, Lassébie and Quintini (Citation2022) concluded that advances in AI meant that higher level cognitive skills could now also be automated as well as those involving routine tasks. However, that would not result in entire jobs disappearing as they typically combined cognitive skills with other not (yet) automatable activities.
As the development and application of current and new ARI continue driven by both commercial (for example, Chui et al. Citation2023) and intellectual interest (for example, Adachi, Kawaguchi, and Saito Citationforthcoming; Klenert, Fernández- Macímacías, and Antón Citation2023), the discussion of ARI also led to critical reviews questioning methodologies and underlying ideological concepts (for example, Morgan Citation2019; Spencer Citation2018). These critiques point to the hyped techno-enthusiasm of advocates of digital advancement and their failure to recognise that ‘the pursuit of profit, rather than progress, shapes the development of digital technologies’, which has produced ‘the huge, casual, insecure, low paid workforce that powers the wheels of the likes of Google, Amazon and Twitter’ (Wajcman Citation2017: 124). Willcocks (Citation2020, 286) similarly warned against exaggerated claims that the capabilities of AI could be ‘seamlessly and quickly deployed’ and ‘whole jobs … be automated’.
2. Automation predictions for Australia
Australia has seen several replications and applications of ARI to predict occupations at risk of automation. This has occurred against a background of limited statistical information about automation or AI use in Australian business.
One of the early job automation risk estimates for Australia resulted from Edmonds and Bradley (Citation2015) cross-walking to the Australian and New Zealand Standard Classification of Occupations (ANZSCO) the ARI scores of Frey and Osborne (Citation2013), which had originally been applied to the US Standard Occupational Classifications (US SOC). The authors concluded that 44% of Australian jobs were highly automatable. In contrast, Borland and Coelli (Citation2017, 391) offered a more conservative estimate of ‘around 9% of Australian workers […] at high risk of their jobs being automated’. They had followed an alternative estimation approach previously proposed by Arntz et al. (Citation2016), who, like Nedelkoska and Quintini (Citation2018), had applied Frey and Osborne’s risk estimators to the OECD’s Survey of Adult Skills (also known as Program for the International Assessment of Adult Competencies, PIAAC) data, but also controlled in their risk estimations for socio-demographic, income and industry characteristics of PIAAC respondents.
Some automation projections for Australia offered estimates as to when that automation might occur and employment impacts might become noticeable. Thus, Durrant-Whyte et al. (Citation2015, 58, emphasis added), also replicating the approach taken by Frey and Osborne (Citation2013), concluded that ’40% of jobs in Australia have a high probability of being susceptible to computerisation and automation’ and that that would occur ‘in the next 10 to 15 years’.
More recently, a report commissioned by the Australian Computer Society (ACS) predicted that by 2034 ‘automation will displace 2.7 million Australian workers’, that is, 21% of the workforce, whilst ‘technology will augment 4.5 million Australian workers leading to a 15% capacity uplift to Australian businesses’ (ACS Citation2020, 7).
More conservatively, the technology company CISCO (Citation2019, 3) estimated that ‘630,000 jobs could be displaced by new technologies over the next decade’. CISCO explains that job displacement refers to ‘the reduction in Australia’s overall employment level that could be accommodated while still generating today’s level of economic output in 2028’ (CISCO Citation2019, 3). CISCO’s calculations used the United States Department of Labor O*NETFootnote1 database for its job task model and applied CISCO expert judgement as to their automatability.
3. This study
This study adds to the plethora of estimations of automation impacts on employment but with the difference that it contrasts five alternative, sometimes competing ARI in a single-country case study of Australia. This study furthermore examines the ARIs’ statistical association with employment patterns (a) in different industry sectors and (b) between three data points (namely the Australian Census of Population and Housing of 2011, 2016, 2021) for which employment and occupational data were collected nationally. The objective is to study which, if any, of the ARI might be statistically associated with observed changes in occupational employment, and what this might tell us about the kind of automation that might be occurring.
3.1. The five ARI
The five ARIs used in this study are those of (i) Frey and Osborne (Citation2013) (hereafter: F&O), (ii) two indicators estimated in Nedelkoska and Quintini (Citation2018) (hereafter: OECD1 [high risk of automation] and OECD2 [risk of significant change]), (iii) the AI Occupational Impact (AIOI) scores developed by Felten et al. (Citation2018), and (iv) the Work Task Automatability Model (WTAM) applied by the Australian National Skills Commission (NSC; since renamed Jobs and Skills Australia, JSA) and based on prior work by Duckworth et al. (Citation2019).
Their selection was informed by concern for the inclusion of the more widely cited, recent indicators (F&O, OECD1, OECD2) alongside alternative indicators based on different estimation methodologies and conceptual assumptions (AIOI, Duckworth, Graham, and Osborne Citation2019). The study also sought to include indicators adopted by government agencies in Australia (WTAM, by NSC/JSA).
All five ARI share the common characteristic of assuming technology-driven aggregate employment change (). Their main differences are their methodological premises. These separate AIOI and WTAM from F&O and OECD1/OECD2 as both former are concerned with present-day technological capabilities. In contrast, F&O and OECD1/OECD2 assume a longer, albeit not further specified time horizon for the automation-by-computerisation of currently available occupations.
Table 1. Automation risk indicators and NSC skills classification (as applied in this study).
Moreover, AIOI’s approach was distinct in that its starting point was the identification of AI tools and instruments to then determine their potential for use in completing work tasks. In contrast, the other ARI first identified work tasks to then ask if they may be automatable based on current but not further specified technological capability. AIOI’s inversion changed the focus of the automation risk assessment from one of generic but assumed AI capability to one of the utilities of known AI innovations.
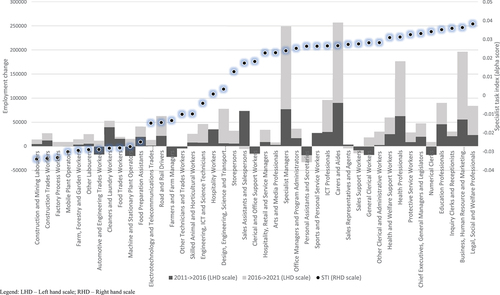
A by-product of these different approaches were different metrics, which also disagreed in their risk assessment of individual occupations relative to another. shows mean ARI scores, originally estimated at four- or two-digit ANZSCO level (see Appendix), but for presentational reason aggregated to the one-digit ANZSCO major group level. Noticeable is that, whereas ARI typically estimated automation risk to increase from managerial occupations to labourers, the reverse pattern was predicted by AIOI, as illustrated by the negative coefficients for AIOI in the correlation matrix (). The standard errors reported in the accompanying table indicate that some automation scores crossed over the major occupation groups, that is, their mean scores were statistically similar.
Figure 1. Mean automation and change risk scores, by occupation (ANZSCO major group).
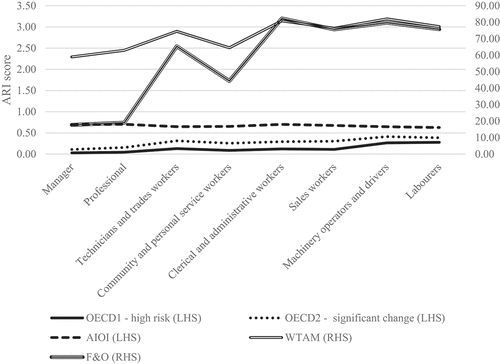
Table 2. Correlation of automation and change risk scores, at ANZSCO unit group level.
None of the ARIs’ authors unambiguously states how they anticipate automation to change occupations, which could entail displacement (and thus loss of employment), augmentation (with or without loss of employment) or the intensification of the work currently undertaken by humans (IFOW Citation2022). Nedelkoska and Quintini (Citation2018) come closest to such a statement. Their distinction between ‘significant change’ and ‘high risk of automation’ at least semantically suggests automation might involve more than augmentation or intensification, which was captured by ‘significant change’. Felten Raj, and Seamans (Citation2018) note that they are agnostic as to the type of employment effect that their ARI might capture.
3.2. Data and data analysis
To compare the ARI estimates and the association with the changing occupational structure of the Australian labour market between 2011 and 2021, this study accessed data from the Australian Bureau of Statistics’ (ABS) 2011, 2016 and 2021 Census of Population and Housing, Australia’s five-yearly population census, cross-tabulating employment at the four-digit ANZSCO unit group, resulting in 475 occupations (see ABS Citation2006, 26–34), by the Australian and New Zealand Standard Industrial Classification (ANZSIC) top-level of 19 industries. For trends in job vacancies, which should indicate technology-induced change in employment via shifts in the type of occupations that were being advertised, data were obtained from the NSC (now JSA) Internet Vacancy IndexFootnote2 (IVI). The five ARI were appended to all vacancy and occupation-employment data. This produced matches to 323 (AIOI), 327 (WTAM), 335 (F&O), 356 (OECD1) and 354 (OECD2) occupations.
Four additional variables were included to describe the skills profiles of occupations, allowing a more granular statistical analysis of interactions with ARI. The first variable defined the level of numeracy and literacy competencies required for a given occupation (labelled Core Competency 1); the other defined the level of collaborative working skills (Core Competency 2). The third profile variable described occupation-specific specialist tasks, based on the time typically spent on performing activities such as working with computers and electronics. The new variable ranked combinations of specialist task scores according to their prevalence in each occupation, measured in terms of percentage of time typically spent doing these tasks, and is labelled specialist task index, STI (see Appendix).
The fourth variable sought to capture momentum in the national economy as an essential, albeit unlikely sufficient requirement for decisions to invest in advanced technology (IMF Citation2023). In the absence of a direct measure (such as GDP by sector and occupation) that would have also fitted the ANZSCO/ANZSIC matrix, the chosen proxy measure was the proportion of employees who, at the previous Census, had lived overseas, calculated for each occupation.Footnote3
3.3. Analysis
The analysis used random effects panel regression in STATA 17, applying the STATA regression option robust, which adjusted standard errors in regressions for correlation between explanatory variables, including the ARI (cp. ). This allowed the simultaneous inclusion of all indicators and their presentation in one table. Separate regressions undertaken for each ARI individually found similar levels of statistical significance for those variable as the combined analysis did.
Five industry sectors were the focus of the analyses: manufacturing; financial and insurance services; information technology (IT) and professional services; public services; and retail and wholesale. The primary rationale for looking at individual sectors was that sectors innovate, digitalise and hence automate at different speeds – and an aggregate application of ARI across the economy would make it harder to detect such nuances (ABS Citation2019, Citation2020–21). Whilst an examination of each industry sector was considered beyond scope, the selection of the five for this study was informed by different considerations.
Manufacturing was of interest as it experienced a marked decline in Australia during the 2010s, including the demise of car manufacturing with the closure of Ford (2016), Toyota (2017) and General Motors Holden (2017) car plants. In total, manufacturing employment contracted by a fifth (20% or 185,000 employees) between 2011 and 2021. The employment contraction coincided with a doubling in the stock of operational robots in the sector from 853 in 2011 to 1750 in 2016, and last recorded in 2018 to have reached 2237 (Müller and Kutzbach Citation2019).Footnote4 This equated to an average of about 29 robots per 10,000 workers, about a third the global average.
In contrast, financial and insurance services increased their employee base by 18% (68,000) during the same time. They were also expected to be at the forefront of digitalisation, not least as the traditional banking sector faces fintech competition (OECD Citation2020), and thus was an obvious candidate for applying ARI as a potential means for detecting such change.
Likewise, IT and professional services are most directly exposed to digitalisation both as a producer of the required tools and as their users and were selected for that reason. The IT and professional services sector gained over 200,000 (or 22%) jobs between 2011 and 2021.
Public services included the ANZSIC sectors of public administration and safety, education and training, health care and social assistance, and arts and recreation services. They were included because of the Australian government’s reputation as leading in AI-readiness (Shearer, Stirling, and Pasquarelli Citation2020), demonstrated by novel and innovative applications of advanced digital and AI technologies – albeit reported anecdotally rather than as a systematic stocktake (Montoya and Rummery Citation2020), including in health care (Verspoor, Hansen, and Colera Citation2023), education (Southgate et al. Citation2018) and the arts (Birtchnell Citation2018). Public services had added nearly one million jobs (or 35%) to its 2011 baseline by 2021.
Finally, retail and wholesale services were selected because of their above-average increase in investment in computing and peripheral equipment (CPE) in the second half of the decade, when it rose from six per cent of all machinery investment in 2011–2016 to ten percent in 2016–2021 (own calculations using ABS 5204.0 Australian System of National Accounts). Retail and wholesale were also of interest because of widely documented automation potential, perhaps most vividly illustrated by Amazon (Del Rey Citation2019). The sectors contracted in the first half of the decade, losing about 100,000 jobs, before recovering in the second half, adding 50,000 jobs, thus reporting a net employment decrease of 3.4% between 2011 and 2021.
3.3.1. Job vacancies
Also examined were job vacancy data, which had previously been used in studies of emerging skills requirements in labour markets (for example, Cedefop Citation2019; Korbel Citation2018; NSC Citation2021b; Strack et al. Citation2021). This study shared their assumption that job vacancies might indicate evolving changes in skills needs and expectations, which may be linked to automation and AI use.
The vacancy data were obtained from the Internet Vacancy Index (IVI), a monthly count of new job advertisements on the online job boards of three private and public providers, SEEK, CareerOne and Workforce Australia. The statistics are available coded by occupational groups. The IVI does not record jobs advertised outside those three domains and only counts advertisements, not the number of jobs associated with them. It thus likely underestimates total labour demand but remains the most comprehensive source for vacancy data.
Two counts of job vacancies were prepared: first, the number of vacancies advertised between Census years, covering September 2006 to August 2011; September 2011 to August 2016; and September 2016 to August 2021; second, the number of vacancies advertised between January and August of each Census year. August was the cut-off point because it is the month in which the Australian Census is conducted, and the IVI data thus aligned with the Census data. The second more narrowly focused analysis was expected to be more sensitive to detecting new hiring patterns during the late-COVID-19-pandemic employment recovery.Footnote5
4. Findings
This section presents the findings from the industry and internet vacancy regression analyses conducted to estimate statistical associations of ARI with employment change. Unless otherwise noted, only those variables statistically significant at the five percent level will be reported in tables or text so to focus on the strongest associations.
4.1. Overview
Three ARI with different conceptual foundations were found to be statistically associated with employment change in different industry sectors, albeit with overlap (). OECD1, indicating high automation risk without timeframe, was statistically associated with employment change in financial and insurance services; AIOI, indicating current AI capability, with change in IT and professional services and also financial and insurance services; and WTAM, indicating current automation risk, with employment changes in manufacturing, retail and wholesale services, and again also financial and insurance services. AIOI was also statistically significantly associated with changes in advertised vacancies.
Table 3. Panel regression results for employment, 2011–2016–2021, various sectors.
Table 4. Panel regression results for vacancies advertised on internet, 2011–2016–2021.
Neither OECD2 (risk of significant change) nor F&O (probability of computerisation over the next decade or two) was statistically associated with employment change in Australia in the 2010s. Moreover, none of the ARI was statistically associated with change in public sector employment.
4.2. A look at the sectors
Examining first the public sector, the strongest association with the recorded employment expansion in that sector between 2011 and 2021 was with non-manual tasks (as indicated by the STI) and occupations emphasising collaboration competencies (as indicated by Core Competencies 2). Although the Australian public sector is said to be a leader in AI readiness, this readiness did not appear to be reflected in the sector’s employment composition, at least not in terms of job dis- or replacement according to ARI. Instead, employment change was linked to skills profiles and requirements typical for a sector engaged in administrative and managerial, coordinating, collaborative, consensual working (Sullivan Citation2022).
In the remaining sectors, a complex picture of statistical associations emerged. In manufacturing, undergoing dramatic decline in the 2010s, employment change was statistically associated with a growth in occupations identified by WTAM as automation prone across higher STI levels, which include professional and managerial, but also some clerical and care occupations (see ). In the case of occupations in the median to lower STI levels (that is, outside professional and managerial occupations), employment decreased in those with lower WTAM scores (assumed less prone to automation), whereas it increased in those with higher WTAM scores (assumed at greater risk of automation).Footnote6
These patterns did not vary over time. Thus, the more recent decline in manufacturing employment following car factory closures since 2016 did not appear to have shifted the sector’s occupational structure any further towards more or less automatable occupations.
Similarly, employment change in IT and professional services, a sector most likely to be exposed to technology that facilitates automation via digitalisation, was associated with growth in occupations identified by AIOI as likely to be impacted by AI. However, this association was only observed for the period 2016 to 2021, when employment in occupations that, according to AIOI, could use existing AI technologies, such as image recognition or language modelling, increased, whilst contracting in occupations deemed to have less use for such technologies. The IT sector may be producing AI tools, but to the extent that it was also using those tools, it would have spurred employment growth in affected occupations, if the AIOI risk detection was correct.
In contrast, in retail and wholesale, employment change was associated with a decrease in occupations identified by WTAM as automatable between 2011 and 2016 only, that is, prior to the sectors’ accelerated investment in CPE in the half-decade to 2021 ( – retail and wholesale). Over the entire decade, except for lower STI occupations (negative values in Figure A1), employment increased in occupations deemed by WTAM to be highly automatable. Occupations deemed at lowest automation risk contracted or, in the case of the lower STI occupations, grew slightly.
4.3. The special case of financial and insurance services
A yet more complex pattern emerges with respect to financial and insurance services. Multiple ARI (OECD1, AIOI and WTAM) were statistically associated with employment change in that expanding sector. Interaction analysis using OECD1 (indicating high automation risk without timeframe) suggests employment growth in (typically managerial, professional, clerical and care) occupations with higher STI (positive value range of 0 or above in Figure A1) but limited to those with lower OECD risk rating (below 0.4). In contrast, AIOI highlights a polarisation in employment change: growth in both high-STI/high-AI-impact occupations and in low-STI/low-AI impact occupations. AIOI also suggests that growth in high-AI impact occupations was particularly strong in the second half of the decade ( – financial and insurance services).
4.4. Vacancy data
Finally, vacancy data covering the entire period between 2011 and 2021 suggested increasing demand for higher-skilled occupations (managers, professionals) identified by AIOI as occupations with tasks that AI applications would have been capable of undertaking or facilitating if used ().
Analysis that only considered the first eight months of each Census year, however, suggested that this trend had lessened in the eight months to the 2021 Census night. Recruitment into occupations with tasks AIOI deems automatable continued to be high, but now also extended to occupations with lower AIOI impact ratings. An additional inspection of the share of occupations amongst all vacancies advertised in the first eight months of 2016 and 2021 confirmed this shift: the greatest percentage increase in advertisements was observed for occupations with low AIOI.Footnote7
This hiring into occupations with lower AIOI scores likely captured the late-COVID pandemic recovery at the time. For this reason, the findings from the analysis of all hires between Census years may be a more accurate description of the typical inter-censual recruitment market in Australia. Both, though, suggest continued hiring into occupations with task profiles that AIOI considered could be undertaken or assisted by currently available AI technologies, without AIOI making clear whether this then should increase or decrease employment.
5. Discussion and conclusion
The first conclusion from this review is that not one of the five ARI stood out as consistently associated with employment trends across industry sectors. Instead, we have three partial fits: AIOI, WTAM and OECD1. Of those three, OECD1 was a special case as its risk scores were only available at the more aggregate ANZSCO sub-major group (2-digit) level, whereas all other ARI were applied to 4-digit unit group occupation data (see ). OECD1 was thus less specific in pinpointing occupations it deemed subject to automation risks than the other ARI. This lack of granularity also made OECD1 more likely to return false positives or false negatives (see Appendix). It should hence be considered with added caution, leaving AIOI and WTAM as the potentially more relevant indicators.
The second conclusion is that associations between ARI and employment did not necessarily hold for the entire observation period (2011–2021) but for some sectors was limited to the first (retail and wholesale) or the second (financial and insurance, IT and professional services) inter-Census period. In the former case, this implied that employment change associated with the ARI had, in fact, preceded, rather than followed, increased investment in computer technology.
The third conclusion is that, based on vacancy data analysis, there appears to have been no slowing in the hiring into occupations that the ARI, AIOI, deemed automatable, - a finding that is unlike recent international evidence which shows that employers who consider using or increasing the use of AI in their business delay recruitment decisions (Milanez Citation2023). summarises the analysis findings for each industry sector and includes an assessment of their consistency with ARI predictions.
Table 5. Summary of ARI analysis and interpretation of emerging findings.
The table also identifies a fourth finding, namely that ARI’s statistical associations with employment in any given occupation become more complex when the measure of specialist skills, STI, is introduced as a more granular differentiator. Within the same industry, occupations with similar STI but different ARI scores may share similar employment trends (increasing or decreasing), whilst occupations with similar ARI scores but different STI display opposing shifts in employment. How these differences panned out in detail varied between sectors. In retail and wholesale, employment in some occupations at the lower end of the STI scale decreased as the WTAM automation prediction score increased, but the opposite occurred at some of the higher end STI, without a consistent pattern. In finance and insurance, occupations with lower STI (comprising cleaners and laundry workers, and technicians, amongst others) contracted across all OECD risk ratings, as did higher STI occupations with highest OECD risk ratings, more in line with its automatability prediction.Footnote8
In manufacturing, data on the growing use of robots, above all capable of substituting for routine tasks (Wacker et al. Citation2020), might have provided circumstantial support for associating the sector’s net employment decrease to automation. The evidence there was indeed of a reduction in occupations with higher, automatable manual routine task content (lower STI, which include factory process workers, plant operators, but also technicians). But within each of these occupations, it was those that WTAMFootnote9 predicted to be least likely to be automated that contracted. At the same time, those occupations that WTAM predicted to be at highest risk expanded. The initial observation of a decrease in occupations most likely replaceable by robotics across manufacturing was thus contradicted by the more detailed picture of growth in specific occupations deemed most highly automatable.
In short, regardless as to whether they look for ‘bottlenecks’ that cannot be automated (OECD1, cp. ) or tasks that can (AIOI, WTAM), the three ARI did not consistently account for variations within STI clusters (AIOI, WTAM) or between STI clusters (OECD1). This may be because automatability is not a property of an occupation (a critique of F&O which motivated OECD1/OECD2) nor of individual tasks but rather of the combination of automatable and not-(yet-) automatable tasks performed in an occupation (Lassébie and Quintini Citation2022).
5.1. A most-likely interpretation?
Across sectors, the inverse relationships between ARI scores and the occupational structure of the Australian labour market may, at best, be interpreted as consistent with automation if the latter was assumed to replace (and perhaps add to) rather than displace (and reduce) the workforce (, verdict).
That said, there remains a caveat to note: there is no sure way of telling whether ARI really pick up automation rather than structural occupational or sectoral shifts without any accelerated deployment of new technologies. The ARI authors’ agnosticism as to the employment impact of what their indicators claim to estimate (is technology displacing or assisting human workers?) renders employment itself inadequate for validating ARI without additional empirical substantiation.Footnote10
What does this mean for the value of ARI for understanding employment change in Australia? Australia’s economy is a reluctant innovator – an economy that selectively adopts and acquires new technologies as they become available, following an incremental innovation model (ECDP Citation2021; IBM Citation2022; Productivity Commission Citation2022; WIPO Citation2022). Australian business’s hesitant innovation is set against high and, since the 1970s, rising gross operating profits (La Cava Citation2019). Whilst this may have offered resources for investment, incentives for doing so appeared few outside the finance and insurance sector where access to large volumes of customer data and the competitive challenge of the fintech sector forced both opportunity and need for automation upon the sector. For the remaining sectors in the Australian economy, productivity growth slowed (Bogaards Citation2022) owing to ‘slower adoption of cutting-edge technologies and processes’ and ‘weaker incentives and imperatives for firms to improve’ (Andrews et al. Citation2022, abstract). With wages largely stagnating (Stewart, Stanford, and Hardy Citation2022), the capital share of national income rising (La Cava Citation2019) and business (entry and exit) dynamics low and decreasing (Leigh Citation2022), there has been little need for automation, although the manufacturing sector might have sought to stem its decline as it turned to robots.
In such a scenario, the ARI would indeed have picked up something other than AI or automation impacts. The regression models in this study displayed generally limited explanatory power as their coefficients of determination, R2, which measure the explained proportion of the variation in the dependent variable, rarely exceeded 10% (the equivalent of R2 = 0.1), not dissimilar to some of the original studies (for example, Felten, Raj, and Seamans Citation2019: ). Given that multiple technological, organisational and environmental factors (Malik et al. Citation2021) affect sectoral and business capacity to innovate (Cohen and Levinthal Citation1990), this is not unexpected. The present study could consider some of those factors (competences, tasks profiles, labour demand), but not account for micro-level or institutional influences.
The main take-away from this study to guide research in automation impacts going forward remains that ARI lack precision, whilst being ambiguous as to the employment outcome of automation. ARI more narrowly rooted in the present (notably AIOI, building on current rather than projected capabilities) may conceptually and empirically prove more valuable, but still run into problems of generalisability across their broad sweep of occupations deemed ‘at risk’.
This study’s introduction of STI added a typically overlooked aspect to the study of automation risk: that time as well as task matters. Decisions to introduce an automation tool in a workplace consider the amount of labour that might be saved, augmented or accelerated relative to the investment cost, - that is the return on investment that the acquisition of such tools offers. As the return (as well as the anticipated profit gain) is relative to the outlay it replaces or augments, it is a function of numbers (of workers) and time (spent on automatable tasks). Constructed from data on time spent on tasks, STI captures this complexity, pointing towards inconsistencies in the predictions of task-centric, but time-agnostic ARI.
As to the shockwaves that accompanied early predictions of automation, they would seem unjustified, at least for the period and country investigated here. But there remains uncertainty as to whether employment changes were limited to some sectors and occupations because automation did not happen or because it did happen, but without leading to large-scale labour shedding (though perhaps the opposite). In either case, there are other, more influential factors driving employment change than automation alone. ARI may contribute conceptually to capturing such change but have limited analytical value without a more granular risk assessment that accounts for labour time spent on combinations of automatable activities within job tasks.
5.2. Contributions and limitations of study
This study contributed to extant estimations of automation risks, which have typically focussed on one ARI in one or multiple economies, here applying multiple indicators to multiple sectors within one economy.
Whereas earlier studies had estimated broadly similar effects of automation risks on employment across countries (for example, Chang and Huynh Citation2016, Georgieff and Hyee Citation2022; OECD Citation2021), this study showed that the choice of indicators makes a difference as they signal different kinds of employment changes in different industry sectors. This allows for different interpretations of the nature of the observed employment change or changes and indicates one of the limitations of the present study, namely the absence of a robust empirical test which sets ARI against measures of actual, evidential automation in Australia, - information not available in the required detail.
A further limitation of the study was its narrow observation window. ARI’s job projections typically imply a longer time horizon well into the 2020s (CISCO Citation2019; IBM Citation2022). Even for AIOI and WTAM, which focussed on available AI capability by the mid-2010s, an additional data point of a future Census may be insufficient for automation to occur and employment impacts to become observable.
As noted earlier, the estimated models also lacked explanatory power (R2), suggesting omission of independent variables, typically because they were unavailable at the required ANZSCO/ANZSIC disaggregation. Alternative models should be examined to improve on current estimations.
Finally, whilst this study demonstrated that ARI do not produce consistent evidence across industry sectors and may thus benefit from further differentiation and theoretical elaborations, the study lacked granularity regarding Australia’s diverse economic geography. Recent analysis of AI-related patenting activities found them geographically concentrated (Bratanova et al. Citation2022). A spatially focussed study of employment trends may add further insights as to the utility of ARI and their capacity to inform our understanding of automation and the adoption of frontier technology in Australia.
Acknowledgement.docx
Download MS Word (13.3 KB)Title page.docx
Download MS Word (13.9 KB)Additional Summary Table.docx
Download MS Word (34.9 KB)Acknowledgments
The author would like to thank Glenda Quintini, OECD, for sharing the OECD automation risk indicators and Jobs and Skills Australia for allowing its Work Task Automatability Model to be used in this study.
Disclosure statement
No potential conflict of interest was reported by the author(s).
Supplemental data
Supplemental data for this article can be accessed online at https://doi.org/10.1080/10301763.2024.2363573.
Correction Statement
This article has been corrected with minor changes. These changes do not impact the academic content of the article.
Additional information
Notes on contributors
Andreas Cebulla
Andreas Cebulla is Associate Professor – Future of Work in the Digital Age. His research focusses on automation and innovation in Australian business, the ethics of AI in the workplace, youth and migrant labour markets.
Notes
2. Available at https://www.jobsandskills.gov.au/data/internet-vacancy-index.
3. In 2021, the proportion of employees who had lived overseas at the previous Census (including international migrants and Australians abroad) ranged from about two percent of protective service workers, farmers and farm managers, and office managers and program administrators, to more than ten percent of hospitality workers, factory process workers, cleaners and laundry workers, food trades workers and ICT professionals. Percentages and occupations had remained broadly unchanged since 2011.
4. Manufacturing was the only sector in the Australian economy with a sizeable robotics stock at the time.
5. The COVID-19 pandemic resulted in national employment decreasing by almost seven per cent (or 856,900 people in employment) between March 2020 and May 2020 (NSC Citation2021a, 4), before the trend reversed in the following 13 months. Job mobility also slowed as fewer people changed jobs but also returned to pre-pandemic levels by mid-2021 (Black and Chow Citation2022). By the time of the last Census in August 2021, the country’s labour market was close to regaining pre-pandemic characteristics.
6. These findings emerged from the interaction analysis as shown in . More detailed information, including margin estimations are available upon request, but subject to sharing restrictions affecting NSC/JSA WTAM data.
7. The correlation between the percentage change in each occupation’s share of all advertised vacancies in the first eight months of 2016 and the first eight months of 2021 on one hand, and AIOI scores on the other was R2=-0.0337. This increased to R2=-0.1197 when including only occupations that at least doubled or at least halved their share of all advertisement.
8. This may be an example of a false negative owing to the application of OECD1 at the more aggregate level of ANZSCO sub-major groups.
9. To construct WTAM, Duckworth et al. (Citation2019) included robotics experts amongst those consulted.
10. Empirical substantiation requires new primary firm-level data collection of the types of technologies finding their way into business in Australia or elsewhere.
References
- Adachi, D., D. Kawaguchi, and Y. U. Saito. Forthcoming. “Robots and Employment: Evidence from Japan, 1978-2017.” Journal of Labor Economics: ja. https://doi.org/10.1086/723205.
- Andrews, D., J. Hambur, D. Hansell, and A. Wheeler. 2022. “Reaching for the Stars: Australian Firms and the Global Productivity Frontier.” Treasury Working Paper 2022#01. Commonwealth of Australia.
- Arntz, M., T. Gregory, and U. Zierahn. 2016. “The Risk of Automation for Jobs in OECD Countries: A Comparative Analysis.” OECD Social, Employment and Migration Working Papers, No. 189. Organisation for Economic Cooperation and Development, Paris.
- Australian Bureau of Statistics. 2006. Australian and New Zealand Standard Classification of Occupations. First ed. Canberra: Commonwealth of Australia.
- Australian Bureau of Statistics. 2019. Digital Activity in the Australian Economy, Ausralian Bureau of Statistics. https://www.abs.gov.au/articles/digital-activity-australian-economy.
- Australian Bureau of Statistics. 2020. Technology Impacts on the Australian Workforce. Sydney: Australian Computer Society.
- Australian Bureau of Statistics. 2020–21. Innovation in Australian Business. Australian Bureau of Statistics. https://www.abs.gov.au/statistics/industry/technology-and-innovation/innovation-australian-business/2020-21.
- Autor, D. H., F. Levy, and R. J. Murnane. 2003. “The Skill Content of Recent Technological Change: An Empirical Exploration.” The Quarterly Journal of Economics 118 (4): 1279–1333. https://doi.org/10.1162/003355303322552801.
- Baumgarten, D., I. Geishecker, and H. Görg. 2013. “Offshoring, Tasks, and the Skill-Wage Pattern.” European Economic Review 61:132–152. https://doi.org/10.1016/j.euroecorev.2013.03.007.
- Baum, C. F., H. Lööf, A. Stephan, and I. Viklund-Ros. 2022. “The Impact of Offshoring on Technical Change: Evidence from Swedish Manufacturing Firms.” Review of International Economics 30 (3): 796–818. https://doi.org/10.1111/roie.12586.
- Birtchnell, T. 2018. “Arts and Culture. Input Paper for the Horizon Scanning Project ‘The Effective and Ethical Development of Artificial Intelligence: An Opportunity to Improve Our Wellbeing’ on Behalf of the Australian Council of Learned Academies.” https://acola.org/wp-content/uploads/2019/07/acola-ai-input-paper_arts-and-culture_birtchnell.pdf.
- Black, S., and E. Chow. 2022, June. “Job Mobility in Australia During the COVID-19 Pandemic.” Reserve Bank of Australia Bulletin 24–34. https://www.rba.gov.au/publications/bulletin/2022/jun/job-mobility-in-australia-during-the-covid-19-pandemic.html.
- Blinder, A. S. 2007. “How Many U.S. Jobs Might Be Offshorable?” CEPS Working Paper No. 142, March. https://www.princeton.edu/~blinder/papers/07ceps142.pdf.
- Bogaards, R. 2022. Australia’s Productivity Slowdown. Parliamentary Library Briefing Book. https://www.aph.gov.au/About_Parliament/Parliamentary_departments/Parliamentary_Library/pubs/BriefingBook47p/AustraliasProductivitySlowdown.
- Borland, J., and M. Coelli. 2017. “Are Robots Taking Our Jobs?” Australian Economic Review 50 (4): 377–397. https://doi.org/10.1111/1467-8462.12245.
- Bratanova, A., H. Pham, C. Mason, S. Hajkowicz, C. Naughtin, E. Schleiger, C. Sanderson, C. Chen, and S. Karimi. 2022. “Differentiating Artificial Intelligence Activity Clusters in Australia.” Technology in Society 71. https://doi.org/10.1016/j.techsoc.2022.102104.
- Brynjolfsson, E., T. Mitchell, and D. Rock. 2018. “What Can Machines Learn and What Does it Mean for Occupations and the Economy?” MIT Initiative on the Digital Economy Research Brief. https://ide.mit.edu/wp-content/uploads/2018/12/2018-08-MITIDE-researchbrief-Erikb.final_.pdf.
- Cedefop. 2019. Online Job Vacancies and Skills Analysis: A Cedefop Pan-European Approach. Luxembourg: Publications Office. http://data.europa.eu/doi/10.2801/097022.
- Chang, J.-H., and P. Huynh. 2016. ASEAN in Transformation: The Future of Jobs at Risk of Automation. Geneva: ILO.
- Chui, M., E. Hazan, R. Roberts, A. Singla, K. Smaje, A. Sukharevsky, L. Yee, and R. Zemmel. 2023. The Economic Potential of Generative AI: The Next Productivity Frontier. https://www.mckinsey.com/capabilities/mckinsey-digital/our-insights/the-economic-potential-of-generative-ai-the-next-productivity-frontier#introduction.
- Cohen, W. M., and D. A. Levinthal. 1990. “Absorptive Capacity: A New Perspective on Learning and Innovation.” Administrative Science Quarterly 35 (1): 128–152. https://doi.org/10.2307/2393553.
- Computer Information System Company. 2019. Technology and the Future of Australian Jobs. What Will Be the Impact of AI on Workers in Every Sector? CISCO and Oxford Economics. https://www.cisco.com/c/dam/m/en_au/cda/cisco-future-of-australian-jobs-report2019.pdf.
- Del Rey, J. 2019. How Robots Are Transforming Amazon Warehouse Jobs — for Better and Worse, Open Sources Reporting Network. https://www.vox.com/recode/2019/12/11/20982652/robots-amazon-warehouse-jobs-automation.
- Duckworth, P., L. Graham, and M. A. Osborne. 2019. “Inferring Work Task Automatability from AI Expert Evidence.” AIES ’19 (Artificial intelligence, ethics, and society), Honolulu.
- Durrant-Whyte, H., L. McCalman, S. O’Callaghan, A. Reid, and D. Steinberg. 2015. “The Impact of Computerisation and Automation on Future Employment.” In Australia’s Future Workforce?, edited by CEDA - Committee for Economic Development of Australia, 56–64. Canberra: Committee for Economic Development of Australia.
- Edmonds, D., and T. Bradley. 2015. Mechanical Boon: Will Automation Advance Australia? Research Paper 7/2015. Department of Industry, Innovation and Science, Canberra. https://www.industry.gov.au/publications/mechanical-boon-will-automation-advance-australia.
- European Customs Dynamic Platform. 2021. Digital Riser Report 2021. Berlin, Germany: European Center for Digital Competitiveness. https://digital-competitiveness.eu/digitalriser/.
- Felten, E. W., M. Raj, and R. Seamans. 2018. “A Method to Link Advances in Artificial Intelligence to Occupational Abilities.” AEA Papers and Proceedings, 1–4 108. https://doi.org/10.1257/pandp.20181021.
- Felten, E. W., M. Raj, and R. Seamans. 2019. The Occupational Impact of Artificial Intelligence: Labor, Skills, and Polarization. New York: NYU Stern School of Business. Accessed September 8, 2019 from. https://doi.org/10.2139/ssrn.3368605.
- Fossen, F., and A. Sorgner. 2019. “Mapping the Future of Occupations: Transformative and Destructive Effects of New Digital Technologies on Jobs.” Foresight and STI Governance 13 (2): 10–18. https://doi.org/10.17323/2500-2597.2019.2.10.18.
- Frey, C. B., and M. A. Osborne. 2013. The Future of Employment: How Susceptible Are Jobs to Computerisation?. Oxford University Programme on the Impacts of Future Technology, Oxford. https://www.oxfordmartin.ox.ac.uk/downloads/academic/The_Future_of_Employment.pdf.
- Georgieff, A., and R. Hyee. 2022. “Artificial Intelligence and Employment: New Cross-Country Evidence.” Frontiers in Artificial Intelligence 5:832736. https://doi.org/10.3389/frai.2022.832736.
- Goos, M., and A. Manning. 2007. “Lousy and Lovely Jobs: The Rising Polarization of Work in Britain.” The Review of Economics and Statistics 89 (1): 118–133. https://doi.org/10.1162/rest.89.1.118.
- Institute for the Future of Work. 2022. Case for Importance. Understanding the Impacts of Technology Adoption on ‘Good work’. Putting People First. London: Institute for the Future of Work.
- International Business Machines. 2022. IBM Global AI Adoption Index 2022, Armonk, NY. https://www.ibm.com/watson/resources/ai-adoption.
- International Monetary Fund. 2023. Accelerating Innovation and Digitalization in Asia to Boost Productivity. Washington DC: International Monetary Fund. https://www.imf.org/en/Publications/Departmental-Papers-Policy-Papers/Issues/2023/01/08/Accelerating-Innovation-and-Digitalization-in-Asia-to-Boost-Productivity-523807.
- Klenert, D., E. Fernández- Macímacías, and J.-I. Antón. 2023. “Do Robots Really Destroy Jobs? Evidence from Europe.” Economic and Industrial Democracy 44 (1): 280–316. https://doi.org/10.1177/0143831X211068891.
- Korbel, P. 2018. Internet Job Postings: Preliminary Skills Analysis. Adelaide: NCVER.
- La Cava, G. 2019, March. “The Labour and Capital Shares of Income in Australia.” Bulletin of the Reserve Bank of Australia 36–47.
- Lassébie, J., and G. Quintini. 2022. “What Skills and Abilities Can Automation Technologies Replicate and What Does it Mean for Workers?: New Evidence.” OECD Social, Employment and Migration Working Papers, No. 282. https://doi.org/10.1787/646aad77-en. OECD Publishing, Paris.
- Leigh, A. 2022. A More Dynamic Economy – FH Gruen Lecture, Canberra. https://www.andrewleigh.com/a_more_dynamic_economy_fh_gruen_lecture.
- Malik, S., M. Chadhar, S. Vatanasakdakul, and M. Chetty. 2021. “Factors Affecting the Organizational Adoption of Blockchain Technology: Extending the Technology–Organization–Environment (TOE) Framework in the Australian Context.” Sustainability 13 (16): 9404. https://doi.org/10.3390/su13169404.
- Milanez, A. 2023. “OECD Social, Employment and Migration Working PapersNo. 289.” The Impact of AI on the Workplace: Evidence from OECD Case Studies of AI Implementation. OECD, Paris.
- Montoya, D., and A. Rummery. 2020. The Use of Artificial Intelligence by Government: Parliamentary and Legal Issues, New South Wales, Australia: NSW Parliamentary Research Service. https://www.parliament.nsw.gov.au/researchpapers/Pages/The-use-of-AI-by-government-parliamentary-and-legal-issues.aspx.
- Morgan, J. 2019. “Will We Work in Twenty-First Century Capitalism? A Critique of the Fourth Industrial Revolution Literature.” Economy and Society 48 (3): 371–398. https://doi.org/10.1080/03085147.2019.1620027.
- Müller, C., and N. Kutzbach. 2019. World Robotics 2019 – Industrial Robots. Frankfurt am Main, Germany: IFR Statistical Department, VDMA Services GmbH.
- Nedelkoska, L., and G. Quintini. 2018. “Automation, skills use and training.” OECD Social, Employment and Migration Working Papers No. 202. https://doi.org/10.1787/2e2f4eea-en. OECD, Paris.
- NSC. 2021a. Australian Jobs 2021. National Skills Commission. https://www.nationalskillscommission.gov.au/publications/australian-jobs-2021.
- NSC. 2021b. The State of Australia’s Skills 2021: Now and in the Future, National Skills Commission. Accessed July 11, 2022. https://www.nationalskillscommission.gov.au/.
- Organisation for Economic Co-operation and Development. 2020. Digital Disruption in Banking and Its Impact on Competition. http://www.oecd.org/daf/competition/digital-disruption-in-financial-markets.htm.
- Organisation for Economic Co-operation and Development. 2021. What Happened to Jobs at High Risk of automation? Policy Brief on the Future of Work. https://www.oecd.org/els/what-happened-to-jobs-at-high-risk-of-automation-10bc97f4-en.htm.
- Productivity Commission. 2022. 5-Year Productivity Inquiry: Innovation for the 98%. Interim Report. Canberra, Australia. https://www.pc.gov.au/inquiries/completed/productivity/interim3-innovation.
- Shearer, E., R. Stirling, and W. Pasquarelli. 2020. Government AI Readiness Index 2020. Canada: Oxford Insights and International Development Research Centre. https://www.oxfordinsights.com/government-ai-readiness-index-2020.
- Southgate, E., K. Blackmore, S. Pieschl, S. Grimes, J. McGuire, and K. Smithers. 2018. Artificial Intelligence and Emerging Technologies in Schools: A Research Report. Australia: Newcastle: University of Newcastle.
- Spencer, D. A. 2018. “Fear and Hope in an Age of Mass Automation: Debating the Future of Work.” New Technology, Work and Employment 33 (1): 1–12. https://doi.org/10.1111/ntwe.12105.
- Stewart, A., J. Stanford, and T. Hardy. 2022. The Wage Crisis: Revisited. Canberra: The Australia Institute.
- Strack, R., M. Carrasco, P. Kolo, N. Nouri, M. Priddis, and R. George. 2021. The Future of Jobs in the Era of AI. Boston Consulting Group. https://www.bcg.com/publications/2021/impact-of-new-technologies-on-jobs.
- Sullivan, H. 2022. Collaboration and Public Policy. Agency in the Pursuit of Public Purpose. Cham: Palgrave Macmillan.
- Verspoor, K., D. Hansen, and E. Colera. 2023. “‘AI Is Already Being Used in Healthcare. But Not All of it Is ‘Medical grade’.” The Conversation. June 20. https://theconversation.com/ai-is-already-being-used-in-healthcare-but-not-all-of-it-is-medical-grade-207912.
- Wacker, K. M., E. Gentile, S. Miroudot, and G. de Vries. 2020. “Robots Replace Routine Tasks Performed by Workers.” https://cepr.org/voxeu/columns/robots-replace-routine-tasks-performed-workers.
- Wajcman, J. 2017. “Automation: Is it Really Different This Time?.” The British Journal of Sociology 68:119–127. https://doi.org/10.1111/1468-4446.12239.
- Willcocks, L. 2020. “Robo-Apocalypse Cancelled? Reframing the Automation and Future of Work Debate.” Journal of Information Technology 35 (4): 286–302. https://doi.org/10.1177/0268396220925830.
- World Intellectual Property Organization. 2022. Global Innovation Index 2022: What Is the Future of Innovation-Driven Growth?. Geneva: World Intellectual Property Organization. https://doi.org/10.34667/tind.46596.
Appendix
Data
ABS 5204.0 Australian System of National Accounts (Table 67. Machinery and Equipment Gross Fixed Capital Formation, by Industry)
ABS Cat. no. 1220.0 ANZSCO – Australian and New Zealand Standard Classification of Occupations, Version 1.3
Data preparation
ARI were appended to the four-digit Australian and New Zealand Standard Classification of Occupations (ANZSCO) unit group occupation-by-industry employment data, downloaded from the Australian Bureau of Statistics TableBuilder, and to data from the NSC/JSA Internet Vacancy Index (IVI). In the case of the ABS data, occupations and industries ‘inadequately described’ or ‘not stated’ by Census completers were excluded, leading to a loss of about two percent of enumerated cases.
Frey and Osborne’s (Citation2013) and Duckworth, Graham, and Osborne’s (Citation2019) automation indices were readily available appended to ANZSCO data, however, the risk scores from Felten et al. (Citation2018) needed to be cross-walked from their originators’ US SOC to ANZSCO. Nedelkoska and Quintini’s (Citation2018) scores were cross-walked from the International Standard Classification of Occupations (ISCO) to ANZSCO. Not all occupations could be matched one-on-one across the more aggregate ANZSCO sub-group (2-digit) levels for which Nadelskoska and Quintini’s indicator was available, resulting in 95 of the 356 matched occupations having duplicate (or more) matches. Two versions of the same indicator were hence created: one using the higher/highest ARI score and another using the lower/lowest ARI score. In the regressions, only the ARI with the higher scores was statistically significantly associated with employment changes.
Identical sub-major group level risk scores of Nedelkoska and Quintini’s were applied to the unit group level occupations that made up the sub-major groups. This means that some occupations were judged to be at equal risk of automation (OECD1) or change (OECD2) when alternative risk indicators might have assigned differential risk propensities. This lesser granularity can lead to false positives when a high-risk value pertaining to a sub-major level occupation is also assigned to a unit group, which, had more detailed risk ratings been available, would have been given a lower risk rating. Likewise, it can lead to false negatives when a low-risk value that is true at the aggregate sub-major level is also assigned at unit group level, when, with more detailed information, a higher risk rating might have been applied.
Skills profiles
Skills profiles of occupations were taken from the NSC/JSA Skills Classification and defined (i) core competencies and (ii) specialist tasks associated with each occupation. Core competencies include numeracy, digital engagement, teamwork, writing, reading, learning, problem solving, oral communication, planning and organising, and initiative and innovation, with each item’s relevance to an occupation scored on a scale from 1 (low) to 10 (high). Factor analysis reduced the number of items to two: Core Competency 1 captured numeracy and literacy skills, alongside planning and problem-solving skills; Core Competency 2 captured collaborative working skills, notably team-working and initiative.
The Specialist Tasks Index (STI) was estimated for each occupation based on relative time typically spent performing activities relating to one or more of 29 task families. The task families (for example, [working with] computers and electronics) are aggregates of 279 task clusters (in this example: develop websites or software), which in turn are aggregates of 1925 activities (here: design websites or applications; develop specifications or procedures for website development or maintenance; write computer programming code). Factor analysis failed to reduce the 29 specialist task families to a manageable number, estimating 18 factors. Instead, using the STATA command alpha, a new variable was derived that ranked occupations according to their interitem correlation of combinations of time spent doing specialist task. The overall Cronbach alpha was 0.5293, indicating low internal consistency, which was exploited for this ranking. alpha estimated negative and positive interitem correlations, starting with a low for manual, labourer-type occupations to a high for professional or clerical and administrative workers, with managerial occupations taking a middling position (cp. Figure A1).
Labour demand data
International research suggests that globalisation and technological change may result in the offshoring of certain types of jobs, albeit the evidence is mixed (for example, Baum et al. Citation2022; Baumgarten et al. Citation2013)., With the intention to account for such potential movement, the present study cross-walked Blinder’s (Citation2007) US SOC offshore ability scores to ANZSCO but could only match them to 122 ANZSCO unit group occupations and, hence, did not further pursue this point of investigation.
Figure A1. Change in employment, 2011–2016, and 2016–2021, by occupation, and Specialist Task Index.