
 ?Mathematical formulae have been encoded as MathML and are displayed in this HTML version using MathJax in order to improve their display. Uncheck the box to turn MathJax off. This feature requires Javascript. Click on a formula to zoom.
ABSTRACT
We use a sample of 78,160 cases involving adults who pleaded guilty to drunk driving in a New South Wales (NSW) court between 2014 and 2019 to assess the contribution of neighbourhood disadvantage to charge dismissal. Data are analysed using a multilevel random effects model with controls for magistrate identity and legal factors that must be considered by the magistrate when deciding whether to dismiss a PCA charge against an offender. Findings indicate that magistrates with a higher dismissal rate are more lenient towards individuals from advantaged or highly advantaged socio-economic neighbourhoods. Magistrates with a lower dismissal rate, are less lenient toward those from advantaged or highly advantaged socio-economic neighbourhoods. Neighbourhood disadvantage has a statistically significant effect on judicial willingness to dismiss a charge of drink driving and record no conviction. The effect is small but affects many people.
Introduction
There have been persistent suggestions over many years that those who are poor, and disadvantaged are treated more harshly by sentencing courts than those who are better off. Reiman (Citation2007) put the point very pithily when he declared ‘The rich get rich, and the poor get prison’. The claim appeals to Marxist theorists who see the criminal justice system as a tool employed by the ruling class to control the working class. You do not have to be a Marxist, however, to be concerned about the possibility that those at the bottom end of the income distribution may be treated more harshly by the courts at the upper end. The mere fact that so many prisoners are drawn from the ranks of those who are poor, black, or members of a minority group is enough to generate the impression that justice is lopsided in the way it deals with offenders.
The claim of social or economic bias in the treatment offenders by the courts is not limited to serious offenders facing a sentence of imprisonment. There have been recurring claims in Australia and elsewhere that defendants from wealthier suburbs who are charged with drunk-driving offences are treated less harshly by the courts than defendants from poorer suburbs (Broderick, Citation2013; Douglas, Citation1989, Citation1994; Ferri, Citation2022; Kerr, Citation2004; Quora, Citation2022; The Daily Telegraph, Citation2014). The issue is important. Around a third of all fatal road accidents are alcohol related (Garrisson et al., Citation2021). While there is little evidence that penalty severity exerts a specific deterrent effect (Rahman & Weatherburn, Citation2021; Weatherburn & Moffatt, Citation2011), there is evidence that the penalties associated with conviction for drunk-driving function act as a general deterrent (Hansen, Citation2015). Even if court outcomes had no effect on the prevalence of drunk-driving, unwarranted disparities in sentencing have the potential to undermine public confidence in the administration of the criminal justice system.
There are several a priori considerations which suggest sentencing courts may treat offenders from poor neighbourhoods more harshly than those who hail from middle- or upper-class neighbourhoods. Proponents of Focal Concerns Theory have argued that sentencing courts tend to fall back on age, race and gender stereotypes when making judgements of dangerousness or community safety (Steffensmeier et al., Citation1998). If this is true, it would not be surprising if they also fell back on stereotypes concerning the criminal proclivities of those who are poor and unemployed, or who live in areas that are socially disadvantaged. After all, recorded crime rates are typically higher in poorer areas than in wealthier areas (Devery, Citation1991). Drunk-drive re-offending rates are also generally higher among those who live in socioeconomically deprived areas than among those who live in better-off areas (Impinen et al., Citation2011; Trimboli & Smith, Citation2009). These stylised facts may cause magistrates to believe that offenders from poor neighbourhoods are inherently more likely to reoffend and, for this reason, should be dealt with more severely.
Harsher treatment of defendants from disadvantaged neighbourhoods, however, is not the only possibility. The factors that prompt one judge to sentence an offender more harshly, may prompt a different judge to sentence an offender more leniently. Several studies have found that the direction of bias in sentencing depends on characteristics of the sentencing judge. Welch et al. (1988; cited in Wooldredge, Citation1998), for example, found that Anglo judges were more likely than African American judges to send African Americans to prison while African American judges sentenced Anglos and African Americans to prison at the same rate. Judges concerned about the over-representation of a minority group in prison may also place less weight on characteristics of the minority group likely to result in imprisonment. Snowball and Weatherburn (Citation2007), for example, found that magistrates in NSW Local Courts placed less weight on an offender’s prior criminal record if the offender was Aboriginal than if he or she was non-Aboriginal.
This paper attempts to answer two important questions surrounding neighbourhood disadvantage and drunk driving. The first concerns the question of whether residents of poorer neighbourhoods are more or less likely than those from wealthier neighbourhoods to have a charge of drunk driving dismissed. The second concerns the question of whether the effect of neighbourhood disadvantage is dependent on the general sentencing proclivities of the magistrate. To get at these effects we use a multi-level modelling approach, where the level 1 variables control for relevant legal considerations when sentencing a person for drunk-driving and level 2 controls for the magistrate identity. This approach allows us to test whether the effect of neighbourhood disadvantage depends on the general willingness or unwillingness of a magistrate to dismiss a charge of drunk driving.
Institutional background
Police powers
Anyone in control of a vehicle or attempting to drive a vehicle can be asked by NSW police to submit to a breath test. The tests are usually conducted at temporary roadside checkpoints set up in locations and at times where police believe drunk driving is prevalent. A positive test results in immediate arrest. Arrested offenders are conveyed back to the nearest police station where a separate more accurate test of their blood alcohol concentration (BAC) is undertaken. If the test confirms a BAC over 0.05, the offender is charged with a ‘prescribed concentration of alcohol’ (PCA) offence and released with a requirement to appear in court later to face the charge. NSW Police conduct around five million breath tests each year (Centre for Road Safety, Citation2022), or around one for every five licensed drivers (Australian Government, Citation2022; Centre for Road Safety, Citation2022).
The offences and penalties
The NSW Road Transport Act (2013) identifies five major PCA offences, based on features of the driver, his or her prior driving record and his or her blood alcohol concentration (BAC):
Novice range: A learner or provisional driver with a BAC above zero
Low-range PCA: A driver with a blood alcohol level of between 0.05 and 0.079
Mid-range PCA: A driver with a blood alcohol level between 0.08 and 0.149
High-range PCA: A driver with a BAC above 0.15
Special range PCA: A special category driver with a BAC limit over 0.02
In addition to automatic loss of license for three months, the maximum fine for a low-range PCA offence is $581. This increases to $2,200 for a mid-range offence and $3,300 for a high-range PCA offence. The maximum penalties are more severe for repeat offenders than for first-time offenders. Being convicted for the first time of a mid-range PCA offence, for example, attracts a maximum fine of $2,200; a maximum prison term of 9 months, and a minimum driver license disqualification period of 6 months. The corresponding maximum penalties for a second or subsequent mid-range offence are: $3,300, 12-months imprisonment and 12 months minimum disqualification. These penalties are onerous and create a strong incentive to find some way of having the charges dismissed.
Section 10 dismissals
One frequently used option is to seek a ‘section 10 dismissal’. Under section 10 of the NSW Crimes (Sentencing Procedure) Act (1999), courts in certain circumstances can find a person guilty of an offence and yet direct that the relevant charge be dismissed, or the offender discharged without conviction. There are three subsections to section 10. Section 10(1)a is an order dismissing the charges. Section 10(1)b is an order discharging the person under a conditional release order. Section 10(1)c is an order discharging the person on condition that [the person] enter into an agreement to participate in an intervention program and to comply with any intervention plan arising out of the program. In this study, we focus solely on cases where the court order is a section 10(1) order.
There is no limit, in principle, to the matters that the court can attend to when deciding whether to dismiss a PCA charge, however the defendant’s BAC and prior driving record are key considerations. Other potentially relevant factors include remoteness of residence (because loss of license may be expected to have a greater impact on those living in remote areas), the existence of other offences concurrent with the PCA offence (because this increases the culpability of the offender), the absence of any prior convictions (because this is a factor in mitigation) and whether or not the offender is legally represented (because this may result in a stronger case for charge dismissal). In addition to these factors, s.10 requires a consideration of several other factors. In deciding whether to dismiss a charge under s.10, courts must have regard to:
the person’s character, antecedents, age, health, and mental condition,
the trivial nature of the offence,
the extenuating circumstances in which the offence was committed,
any other matter that the court thinks proper to consider.
Previous research
We have been unable to find any studies examining the possibility of social or economic bias against persons convicted of drunk driving. Indeed, compared with research on the effect of racial bias on sentencing, studies of the impact of socioeconomic bias for any offence are comparatively rare. Early efforts to investigate the effect of social disadvantage on sentencing outcomes (eg, Chapman, Citation1968; Chiricos & Waldo, Citation1975; Douglas, Citation1989; Jankovic, Citation1978; Quinney, Citation1979; Wald, Citation1967) were hampered by a paucity of good data, weak controls, and rudimentary analytical tools (Ulmer, Citation2012). Douglas (Citation1989), for example, was unable to control for the prior criminal record of the offender and had no objective measure of offence seriousness. Chiricos and Waldo (Citation1975) were unable to control for the offender’s plea and treated all offences within the same general category as equally serious. These are serious limitations. Judges are legally obliged to take several factors into account when imposing a sentence. Among other factors, they include the defendant’s plea, the seriousness of their offence, whether they have been convicted of multiple offences, and the number of times they have previously been convicted of a criminal offence. Socioeconomic status may be correlated with any of these factors. Failure to control for legally relevant factors could lead to incorrect inferences being drawn about the influence of socioeconomic status on court sentencing decisions.
There is one other important limitation in much of the prior research on bias in sentencing. Many studies of such bias (whether in relation to race or socioeconomic status) proceed on the assumption that if there is bias, it will operate in only one direction (viz. harsher penalties for minorities or those who are socially disadvantaged). Judges, however, often differ widely in sentencing leniency/harshness; a fact routinely exploited in instrumental variable analyses of the impact of penalties on re-offending (eg, Green & Winik, Citation2010; Williams & Weatherburn, Citation2022). As Wooldredge (Citation1998) pointed out more than 20 years ago, the impact on sentencing of variables such as race or disadvantage may depend on the characteristics of a judge (eg, his or her race) and the attitudes she or he holds toward minority group offenders and/or those who are economically or socially disadvantaged. Some may see minority group offenders and those who come from poverty-stricken neighbourhoods as a social threat and deserving of harsher punishment. Others may see these same people as deserving of leniency precisely because their straightened circumstances. These divergent attitudes may cancel out in the aggregate, leaving the impression that race or socioeconomic status have little or no effect on sentence choice.
The current study
In this article we report the results of a multi-level investigation into whether the socioeconomic status of an offender’s neighbourhood influences the likelihood of escaping any sanction for a proven drunk-driving offence. We choose drunk driving because it has an objective measure of seriousness (the blood alcohol concentration of the offender) and thus prevents unmeasured variation in offence seriousness clouding our results. We employ a multi-level modelling approach to break the correlation between case outcomes and magistrates (the outcomes of cases dealt with by the same magistrate are likely correlated). It has the added advantage of allowing us to test for an interaction between socioeconomic status and magistrate. More specifically, it allows us to test whether the effect of socioeconomic status on the likelihood of escaping a sanction for drunk driving varies depending on the proclivity of a magistrate to dismiss a charge of drunk driving.
As a further defence against omitted variable bias we employ an extensive set of controls; including age sex, area (remoteness), socioeconomic disadvantage, blood alcohol concentration (BAC), number of concurrent offences, whether the defendant was legally represented, number of prior convictions, whether the defendant had a prior traffic conviction in the last five years, whether the defendant’s driving licence had been suspended or cancelled in the last five years and the year in which the case was heard. In the next section we describe the study in more detail.
Method
The study reported here was approved by the University of New South Wales Human Research Ethics Committee. Approval No. HC220060.
Data
Data for the study were sourced from the New South Wales (NSW) Bureau of Crime Statistics and Research reoffending database (ROD). Each time a person in New South Wales is detained by police as a suspected offender (referred to hereafter as a CJS contact), a record is created in ROD containing details of the way the person was dealt with (viz. whether cautioned, referred to a youth justice conference or charged and required to appear in court), the charge or charges laid, the defendant’s plea (guilty, not guilty, no plea), the court that dealt with the case (where applicable), the court outcome (eg, convicted/not convicted) and the penalty (type and quantum).
Additional data collected at each CJS contact include the defendant’s age; gender; Indigenous status; number and type of concurrent offences; and the socioeconomic status of the postcode in which each defendant lived at the time of their court appearance. Successive CJS contacts are linked using a matching algorithm based on surname, date of birth and criminal names index (a fingerprint-based identifier). In essence, to be matched under the ROD matching criteria, two records must have the same surname, first name and date of birth (DOB); or the same surname, first name, middle name and two components of the DOB; or the same criminal names index (CNI) and DOB; or the same CNI, surname and two components of the DOB; or the same CNI, first name and two components of the DOB. Further details of the matching procedure can be found in Hua and Fitzgerald (Citation2006).
For the purposes of this study, BOCSAR provided the authors with a file containing details of all persons who appeared in a NSW court charged with a PCA offence between 2014 and 2019. For individuals with multiple appearances for a PCA offence, only one record was randomly kept; to maintain the assumption of independence between observations. Records that involved special range PCA offences were excluded because these offences can arise from very different factual circumstances. Records were also discarded if it was not clear whether the PCA charge had been dismissed under s.32 of the Mental Health (Forensic Provisions Act) or under section 10 of the Crimes (Sentencing Procedure) Act, or if it involved ‘not guilty’ pleas (since no persons pleading ‘not guilty’ were granted a s.10 dismissal). In addition, cases dealt with by the NSW Children’s Court were excluded from the analysis because the principles of sentencing differ between juveniles and adults (see section 6 of the Children (Criminal Proceedings Act 1987)). To ensure each magistrate included in the study had significant experience dealing with PCA cases, we focused on records involving magistrates who, over the study period, had dealt with 50 such cases or more. Finally, only cases with complete information were kept, yielding a sample of 78,160 cases involving adults who pleaded guilty to either a low-range, mid-range, or high-range PCA offence in a NSW Magistrates Court between 2014 and 2019.
Variables
The dependent variable in the study is labelled ‘outcome’ and takes the value ‘1’ if the defendant’s charges were dismissed under s.10 and ‘0’ otherwise. Our controls in the analysis include age sex, area (remoteness), socioeconomic disadvantage, BAC, number of concurrent offences, whether the defendant was legally represented, number of prior convictions, whether the defendant had a prior traffic conviction in the last five years, whether the defendant’s driving licence had been suspended or cancelled in the last five years, the year in which the case was heard and whether the defendant indicated they report being Indigenous at any court appearance.
Remoteness is measured using the Australian Bureau of Statistics ARIA index (Australian Bureau of Statistics, Citation2018). The index scores were grouped into four categories: major cities, inner regional, outer regional, remote/very remote. Disadvantage is measured using the SEIFA index of relative socioeconomic advantage/disadvantage. The SEIFA index was developed by the Australian Bureau of Statistics (Citation2011) using a principal components analysis of factors drawn from the Australian census that are considered indices of neighbourhood disadvantage, including income, education, occupation, employment status and number of dependent children. The SEIFA value employed in the study is determined from their address at the first court appearance. SEIFA values are normally grouped into four categories (highly advantaged, advantaged, disadvantaged, and highly disadvantaged). Preliminary analysis revealed little difference in outcomes for the two middle categories. For the purposes of this study, therefore, SEIFA values were coded into two groups; those classified as disadvantaged or highly disadvantaged, and those classified as advantaged or highly advantaged.
The covariates and their coding are shown in , below:
Table 1. Study variables and their coding.
Analysis
Our aims in this study are three-fold. First, we wish to determine whether the socioeconomic status of a defendant’s neighbourhood influences the likelihood of having a PCA charge dismissed. Second, we wish to know to what extent magistrates dealing with similar PCA cases differ in their propensity to dismiss the charge. Third, we wish to know whether the magistrate’s propensity to dismiss a PCA charge is affected by the socioeconomic status of a defendant’s neighbourhood.
If each magistrate dealt with only one case, we could answer these questions by running a standard regression model, such as logistic regression. However, because we expect magistrates to differ in their propensity to dismiss a PCA offence, the outcomes from cases dealt with by the same magistrate are likely to be correlated. This would violate the assumption of observational independence underpinning most regression models. To address this problem, we employ a multilevel model in which the first level captures the influence of legal factors specific to each case (eg, age, gender, charge, prior convictions) while the second level measures the contribution of the magistrate after controlling for those first-level factors. This model allows us to quantify the magistrate’s contribution to the likelihood of charge dismissal as well as determine whether this contribution is affected by the socioeconomic status of a defendant’s neighbourhood.
More formally, let represent the probability of the case of individual to be dismissed by magistrate
. We first consider the two-level:
(1)
(1) where
is the magistrate (random) effect and
denote the between-magistrate variance. A likelihood ratio testFootnote1 was performed to test whether the variance of the magistrate effect is significantly different from zero. The small p-value associated with this test shows that magistrates do differ in their willingness to dismiss a drunk driving charge and confirms our hypothesis of the need for a multilevel model. This is reinforced by the magistrate intraclass correlation coefficient (ICC) which indicates that more than 39% of the variation in getting a case dismissed can be explained by between-magistrate differences. We then refine the model by including the explanatory variables. Since these are factor variables, sum-to-zero constraints are imposed on the parameters, resulting in the intercept (
) representing the effect of a reference category of individuals. The selected reference category corresponds to 18–24 years non-Indigenous old males, from a major city and a highly advantaged socioeconomic background, charged with a low-range PCA offence in 2014 and with no concurrent offences, legal representation, prior convictions, or prior traffic offence. Since we have no a priori reason to believe magistrates respond differently to any legal variable, we begin by considering the following random-intercept model:
(2)
(2) where
is an indicator function taking value
if the condition is met and
otherwise. Parameter estimates are obtained through likelihood maximisation using bound optimisation by quadratic approximation.Footnote2 The need for a random effects model is evaluated using a likelihood ratio test. Wald tests were also conducted to evaluate whether each coefficient is significantly different from zero. Both tests indicated that the random effects model was superior to the fixed effects model.
The effect of disadvantage on the likelihood of charge dismissal may vary across magistrates. In order test this possibility, we next considered a random-slope model where the effect of disadvantage is allowed to vary between magistrates. More specifically, we add the term in (2) where we now make the following assumption.
(3)
(3) meaning that the random intercept and slope for a magistrate
are normally distributed with mean vector
and variance-covariance matrix
. We use a likelihood ratio test to determine whether the effect of disadvantage varies across magistrates. The null hypothesis is that the two new parameters
and
are simultaneously equal to zero. A p-value below the nominal 5% level of significance indicates that the random-slope model provides a better fit over the random-intercept model, and we therefore select it to analyse the decision-making process.
Results
Descriptive statistics
shows the frequencies of the variables included in the study.
Table 2. Sample description.
All variable values are amply represented. The ages and level of disadvantage are evenly distributed (a likely outcome of random breath testing). Most are males, have no concurrent offences, have been charged with a mid- or high-range PCA offence and have no prior convictions, traffic offences or periods of license suspension/disqualification. Just over half have legal representation. Only about 1 in 50 had their PCA charge dismissed.
Bivariate relationships with outcome
shows the bivariate relationships between study covariates and the outcome (whether the charge was dismissed). Using a Chi-square test highlights evidence of an association for all bivariate relationships, with p-values of 0.001 or lower.
Table 3. Bivariate relationships with outcome.
Defendants are significantly more likely to have their PCA charge dismissed if they are older, female, reside in a major city, reside in a highly advantaged area, have no or only one concurrent offence, and have no prior convictions, traffic offences or periods of licence disqualification. The key point to note about , however, is that the likelihood of dismissal for anyone charged with a mid- or high-range BAC is less than half of 1%. In fact, although not shown in the table, 94% of those whose charges were dismissed had been charged with a low range PCA offence.
Multivariate analysis
gives a summary of the estimated fixed effects from the random-slope model, where we recall that the reference category of individuals corresponds to 18–24 years old males, from a major city and a highly advantaged socioeconomic background, charged with a low-range PAC offence in 2014 and with no concurrent offences, legal representation, prior convictions, or prior traffic offence. Each row of indicates the change in the odds of getting a charged dismissed when a specific predictor value changes. An odds ratio of 1 indicates that the odds of getting a charge dismissed do not change, a value less than 1 indicates a reduction of the odds and a value greater than 1 indicates an increase of the odds. Row-wise information is completed by a 95% confidence interval for the odds ratio and a p-value indicating whether there is evidence that it is different from 1.
Table 4. Model for odds of charge dismissal.
As expected, the odds of a s.10 dismissal increase with age and are higher for women than men. Also as expected, the odds of dismissal are lower for those who have higher-range BAC, prior convictions, or a prior traffic offence. Being legally represented lowers the odds of a s.10 dismissal. This was already observed in where a s.10 dismissal occurred for 2.75% of the individuals with no legal representation, while it was the case for only 1.69% of those legally represented. Contrary to expectations, there is no effect of disadvantage, remoteness of a person’s residence or prior licence disqualification (although the latter can be explained by its strong correlation with the prior traffic offence predictor). Furthermore, there appears to be evidence of a decrease in the odds of a s.10 dismissal in the later years of the study period (2018–2019). Finally, the odds of a s.10 dismissal do not change between individuals who declared themselves as Indigenous and non-Indigenous.
The random-slope model has an adjusted ICC (Nakagawa et al., Citation2017) of 0.469, indicating that a substantial proportion of the variance in the likelihood of a s.10 dismissal is explained by the magistrate (random) factor. The estimated variance-covariance matrix of the random effects is given by:
(4)
(4) which indicates a much greater amount of variability in the random intercept. When we do a likelihood ratio test between the random-intercept and random-slope models we get a p-value of 0.013. This is evidence against the null hypothesis that both
and
are equal to zero and suggests that the effect of socio-economic status varies across magistrates when deciding to apply s.10. The estimated intercept variance,
, can be interpreted as the between-magistrate variance in the log-odds of s.10 dismissal for individuals from advantaged or highly advantaged socioeconomic backgrounds. The negative correlation (−0.385) between magistrate-level intercept (
) and slope (
) can be observed in the right panel of and explains the fanning in pattern observed in the left panel of : the lines with the largest slopes have smaller intercepts. The red coloured magistrates are those for which there is evidence that the (log)-odds of a s.10 dismissal differ from the mean due to either the intercept or the slope being different from zero ().
Figure 1. Summary of the random effects for each of the 171 magistrates. Left panel: random effects as function of socio-economic advantage. Right panel: scatterplot of the intercept () and slope (
). Red colour indicates magistrates for whom there is evidence of difference from the mean log-odds of s.10 dismissal.
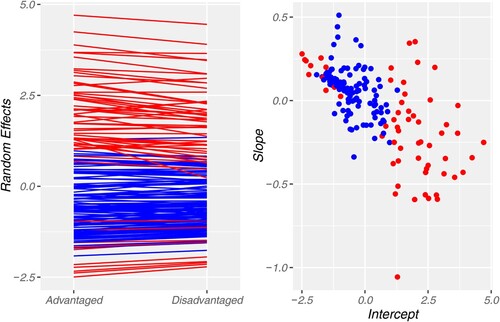
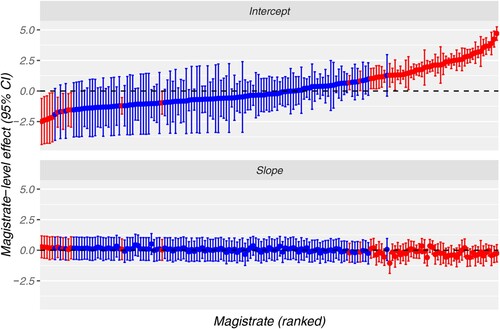
Figure 2. Magistrate-level effects (Top panel: intercept; Bottom panel: slope) on the likelihood of having a charge dismissed under s.10. Dots represent the pointwise estimates and error bars give a 95% confidence interval. Red colour indicates magistrates for whom there is evidence of difference from the mean log-odds of s.10 dismissal. NSW Local Court: 2014–2019.
Discussion
The aim of the current study was to see whether the socioeconomic status influenced the likelihood of charge dismissal after adjusting for factors legally relevant to the exercise of this power. When considering only fixed effects, we find no evidence of neighbourhood disadvantage on a magistrate’s willingness to dismiss a charge. The random intercept analysis, however, revealed that neighbourhood disadvantage does influence the likelihood a magistrate will dismiss a charge of drunk driving. The direction of that effect depends on whether the magistrate has a high or low proclivity to dismiss the charge. Magistrates with a higher dismissal rate are more lenient towards individuals from advantaged or highly advantaged socio-economic neighbourhoods. Magistrates with a lower dismissal rate, on the other hand, are less lenient toward those from advantaged or highly advantaged socio-economic neighbourhoods.
One way to explain these findings is to assume that magistrates who take a dim view of driving under the influence of alcohol (or, perhaps, of all offending), are especially disinclined to show any leniency to those who, in their view, ‘ought to know better’ (viz. those who are regarded as better educated or more privileged). Magistrates, on the other hand, who take a less condemnatory view of driving under the influence of alcohol, may be especially lenient toward those who, they believe, are unlikely to repeat the offence. While these conjectures are testable, they can only really be examined through research that explores the association between case outcomes and the personal attitudes of judicial officers toward offending and crime. Although a few studies have examined the influence of judicial personality on sentencing (eg, Hogarth, Citation1971; Shitrit, Citation1972), we have been unable to find any research on the issue discussed here. This is unfortunate because conventional wisdom and legal theory both proceed on the assumption that judicial decision making is entirely determined by legislation and appellate decisions.
The effects found in this study are small in absolute terms. For the 49 magistrates with higher dismissal rate, the mean predicted probability of dismissal drops from 9.16% for those living in advantaged areas to 7.18% (in relative terms a difference of 22%) for those living in disadvantaged areas. Conversely, for the 11 magistrates with a significantly lower than average dismissal rate, the mean predicted probability of dismissal increases slightly from 0.14% for those living in advantaged areas to 0.16% (in relative terms a difference of 9%) for those living in disadvantaged areas.
These small effects are reassuring and are probably attributable in large part to the fact that PCA offences have an objective indicator of seriousness (viz. the BAC level).Footnote3 It is important to understand, however, that while the absolute differences in the predicted probability of dismissal appear small, the NSW Local Court deals with on average approximately 13,000 cases of drunk driving every year (NSW Bureau of Crime Statistics and Research, Citation2022). If the rate of dismissal was equal across defendants at 9.16%, 1,359 additional individuals from disadvantaged areas would have had their drunk-drive charges dismissed.Footnote4 For individuals convicted of drunk driving, they involve the difference between having a criminal record; with all that the possession of a criminal record entails, and having no criminal record, by reason solely of your address. It is also important to remember that, because the maximum penalties for PCA offending are tightly structured around the BAC of the offender, the biases observed in the current study are likely much smaller than might be found for offences where magistrates or judges exercise a greater degree of discretion in the penalty they choose to employ. It would therefore be a mistake to assume that the present case of bias is isolated, either in terms of offence type, or jurisdiction.
The effects of other factors on the risk of dismissal are largely unsurprising. We see higher odds of charge dismissal among offenders who are older, those with a low BAC, those with no or only one concurrent offence and those who have no prior traffic offence or driver licence disqualification. These findings are entirely in accord with what the statute and common law require in relationship to the use of s.10. The finding that males are less likely to have a PCA charge dismissed has no direct legal justification but may reflect a view among magistrates that males are more likely to reoffend than females. There are, however, two surprising results. The first concerns the fact that those with legal representation are less rather than more likely to have the PCA charge dismissed. We suspect that this is because defendants facing more serious charges (and therefore more severe penalties) are both more likely to seek legal representation and less likely to have their PCA charge dismissed. In other words, it is the anticipated penalty that is driving the decision to obtain legal representation rather than legal representation influencing the decision not to dismiss the drunk drive charge.
The second concerns our expectation that PCA defendants living in remote or very remote areas would be more likely to have the charges dismissed because the burden of losing a driving licence where a defendant lives in a regional or remote area is much more onerous than where the defendant lives in a city or regional area. The bi-variate analysis did reveal that defendants living in major cities were less likely to receive the benefit of a s.10 dismissal than those living outside major cities, particularly if they lived in very remote areas. This effect, however, disappeared in the multilevel analysis, possibly because we combined remote and very remote areas to boost the sample size on which the analysis was based.
All research is subject to caveats and ours is no exception. Earlier we mentioned that, under s.10 of the NSW Crimes (Sentencing Procedure) Act (1999), a court must have regard to a person’s character, antecedents, age, health, and mental condition; the trivial nature of the offence; the extenuating circumstances in which the offence was committed; and any other matter that the court thinks proper to consider. We have endeavoured to control for the influence of these factors by ensuring each magistrate in our sample had dealt with many cases, and by including an extensive battery of legal controls. The minimum number of PCA cases disposed by a magistrate in the current study was 50, the average across all magistrates was 457, and the maximum was 2,153. One legally relevant factor we were unable to control for was the health of the defendant. It is possible that unmeasured differences in the mental or physical health of the offender explain our results. If poor physical or mental health increases the likelihood of charge dismissal, however, it is hard to see why the effect of socioeconomic status would differ, depending on the overall rate at which a magistrate dismisses charges of drunk driving.
A second limitation of the current study is that we had no direct measure of the defendant’s level of advantage or disadvantage. We assume that offenders living in areas of higher disadvantage are more disadvantaged on average than those residing in areas with lower levels of disadvantage, but it is possible that some individuals classed as disadvantaged will be better off than some individuals classed as advantaged. Our principal defence against mismeasurement of disadvantage is our large sample size. We have more than 39,000 cases in each of the two categories of disadvantage we employ. It is, we would argue, highly unlikely that, by chance alone, we have ended up with two nominally different levels of disadvantage that are actually very similar. It is worth noting that differences between neighbourhoods in the level of disadvantage are likely to understate differences between individuals in their income because the SEIFA score of an LGA is based (among other things) on the average income for the area. It would be interesting to see whether the current results change if the measure of disadvantage/advantage was based on income or employment status.
Conclusion
There have been repeated suggestions over many years that courts treat defendants from wealthier suburbs more leniently than defendants from poorer suburbs. The research reported here confirms this suspicion but also shows that magistrates react to the socioeconomic status in different ways. This finding underscores the often-overlooked fact that the direction of any bias in sentencing may depend on a complex interaction between judicial officer and defendant characteristics.
Access to data
Access to the ROD data employed in this study can be obtained on application to the NSW Bureau of Crime Statistics and Research at [email protected]. Copies of the data specification can be obtained from the first author.
Acknowledgements
The authors would like to thank the NSW Bureau of Crime Statistics and Research for access to the data required for this research. We would also like to thank the reviewers for their helpful feedback on the first draft of the article.
Disclosure statement
No potential conflict of interest was reported by the author(s).
Notes
1 Here and throughout the manuscript, the model is fitted using maximum likelihood estimation using the glmer procedure available in the R package lme4.
2 The argument control = glmerControl(optimizer = ‘bobyqa’) is specified within the glmer function. To ensure convergence of the algorithm, one may want to set a high number of function evaluation in the opitmizer by adding, eg, optCtrl = list(maxfun = 2e5).
3 Indeed, while we may have gained greater control over omitted variable bias in choosing an offence that had an objective measure of seriousness, the constraints in sentencing for an offence with this characteristic may have limited the scope for sentencing bias to emerge.
4 The 49 magistrates highlighted to have a higher dismissal rate dealt with 25,480 cases across a 6-year span, i.e., an average of 88 cases per year per magistrate. Of the cases dealt with, 11,009 concern individuals from advantaged areas and 14,831 from disadvantaged areas. According to the model, it is expected that 1,008 individuals from advantaged areas will be dismissed whereas 1,065 from disadvantaged areas will be dismissed. If the rate of dismissal was equal across defendants at 9.16%, there would be 1,359 individuals from disadvantaged areas who would be dismissed.
References
- Australian Bureau of Statistics. (2011). Census of Population and Housing: Socio-Economic Indexes for Areas (SEIFA). Cat. no. 2033.0.55.001. Canberra. https://www.abs.gov.au/ausstats/[email protected]/mf/2033.0.55.001.
- Australian Bureau of Statistics. (2018). Australian Statistical Geography Standard (ASGS): Volume 5 - Remoteness structure. Canberra. https://www.abs.gov.au/websitedbs/d3310114.nsf/home/australian+statistical+geography+standard+(asgs).
- Australian Government. (2022). Drivers licences in Australia. Bureau of Infrastructure, Transport and Regional Economics. https://www.bitre.gov.au/publications/2017/is_084.
- Broderick, R. (2013). Massive uproar over the teenager who won freedom in a drunk driving case by arguing he was too wealthy for prison. https://www.buzzfeednews.com/article/ryanhatesthis/massive-uproar-over-the-teenager-who-won-a-drunk-driving-cas.
- Centre for Road Safety. (2022). Random breath testing. https://roadsafety.transport.nsw.gov.au/stayingsafe/alcoholdrugs/drinkdriving/rbt/index.html#:~:text=Police%20conduct%20about%205%20million,random%20to%20test%20for%20alcohol.
- Chapman, D. (1968). Sociology and the stereotype of the criminal. Tavistock.
- Chiricos, T., & Waldo, G. P. (1975). Socioeconomic status and criminal sentencing: An empirical assessment of a conflict proposition. American Sociological Review, 40(6), 753–772. https://doi.org/10.2307/2094178
- Devery, C. (1991). Disadvantage and crime. NSW Bureau of Crime Statistics and Research. https://www.bocsar.nsw.gov.au/Publications/General-Series/r24.pdf.
- Douglas, R. (1989). Does the magistrate matter? Sentencers and sentence in the Victorian magistrates’ courts. Australian & New Zealand Journal of Criminology, 22(1), 40–59. https://doi.org/10.1177/000486588902200103
- Douglas, R. (1994). Social class and court outcomes. Making sense of the empirical literature. Law in Context: A Socio-Legal Journal, 12(1), 97–108.
- Ferri, L. (2022). Patricia Hadjia: Instagram influencer ‘Torpedo Trish’ avoids prison for high-range drink-driving. https://www.news.com.au/national/nsw-act/crime/patricia-hadjia-instagram-influencer-torpedo-trish-avoids-prison-for-highrange-drinkdriving/news-story/dc0affb539c91db3e3c152cd76a7d608.
- Garrisson, H., Scholey, A., Ogden, E., & Benson, S. (2021). The effects of alcohol intoxication on cognitive functions critical for driving: A systematic review. Accident Analysis & Prevention, 154, 1–11. https://doi.org/10.1016/j.aap.2021.106052
- Green, D. P., & Winik, D. (2010). Using random judge assignments to estimate the effects of incarceration and probation on recidivism. Criminology; An interdisciplinary Journal, 48(2), 357–387. https://doi.org/10.1111/j.1745-9125.2010.00189.x
- Hansen, B. (2015). Punishment and deterrence: Evidence from drunk driving. American Economic Review, 105(4), 1581–1617. https://doi.org/10.1257/aer.20130189
- Hogarth, J. (1971). Sentencing as a human process. University of Toronto Press.
- Hua, J., & Fitzgerald, J. (2006). Matching court records to measure reoffending. Crime and Justice Bulletin 95. Sydney: NSW Bureau of Crime Statistics and Research. https://www.bocsar.nsw.gov.au/Pages/bocsar_publication/Pub_Summary/CJB/cjb95-Matching-Court-Records-to-Measure-Reoffending.aspx.
- Impinen, A., Makela, P., Karjalainen, K., Haukka, J., Lintonen, T., Lillsunde, P., Rahkonen, O., & Ostamo, A. (2011). The association between social determinants and drunken driving: A 15-year register-based study of 81,125 suspects. Alcohol and Alcoholism, 46(6), 721–728. https://doi.org/10.1093/alcalc/agr075
- Jankovic, I. (1978). Social class and criminal sentencing. Crime and Social Justice, 10, 9–16.
- Kerr, J. (2004). Drink-drivers pour through loophole. Sydney Morning Herald Weekend Edition, February 28–29, 2004. https://www.smh.com.au/national/drink-drivers-pour-through-loophole-20040228-gdifxn.html.
- Nakagawa, S., Johnson, P., & Schielzeth, H. (2017). The coefficient of determination and intra-class correlation coefficient from generalized liner mixed-effects models revisited and expanded. Journal of the Royal Society Interface, 14(134), 20170213. https://doi.org/10.1098/rsif.2017.0213
- NSW Bureau of Crime Statistics and Research. (2022). Criminal Court Statistics 2021–2022. https://www.bocsar.nsw.gov.au/Pages/bocsar_publication/Pub_Summary/CCS-Annual/Criminal-Court-Statistics-Jun-2022.aspx.
- Quinney, R. (1979). The social reality of crime. Little Brown.
- Quora. (2022). Why do celebrities and rich people who can afford to be driven around get arrested for DUI? URL:https://www.quora.com/Why-do-celebrities-and-rich-people-who-can-afford-to-be-driven-around-get-arrested-for-DUI.
- Rahman, S., & Weatherburn, D. (2021). Does prison deter drunk-drivers? Journal of Quantitative Criminology, 37(2), 979–1001. https://doi.org/10.1007/s10940-020-09476-4
- Reiman, J. (2007). The rich get rich and the poor get prison. Pearson.
- Shitrit, S. (1972). The impact of the personality of the judge on sentencing policy. Criminology, Criminal Law, & Police Science, 1(2), 125–145.
- Snowball, L., & Weatherburn, D. (2007). Does racial bias in sentencing contribute to indigenous overrepresentation in prison? Journal of Criminology, 40(3), 272–290.
- Steffensmeier, D., Ulmer, J., & Kramer, J. (1998). The interaction of race, gender, and age in criminal sentencing: The punishment cost of being young, Black, and male. Criminology; An interdisciplinary Journal, 36(4), 763–798. https://doi.org/10.1111/j.1745-9125.1998.tb01265.x
- The Daily Telegraph. (2014). Injustice on drink driving is a bit rich. Opinion. July 3, 2014. https://www.dailytelegraph.com.au/news/opinion/injustice-on-drink-driving-is-a-bit-rich/news-story/52231e73a6352a38269b38fbe0885edd.
- Trimboli, L., & Smith, N. (2009). Drink-driving and recidivism in NSW. Crime and Justice Bulletin 135. Sydney: NSW Bureau of Crime Statistics and Research. www.bocsar.nsw.gov.au/Publications/CJB/cjb135.pdf.
- Ulmer, J. T. (2012). Recent developments and new directions in sentencing research. Justice Quarterly, 29(1), 1–40. https://doi.org/10.1080/07418825.2011.624115
- Wald, P. (1967). Poverty and criminal justice. In US President’s Commission on law enforcement and administration (1967). Task Force Report: The Courts. Washington, D.C., US Government Printing Office. https://catalog.archives.gov/id/10450672.
- Weatherburn, D., & Moffatt, S. (2011). The specific deterrent effect of higher fines on drink-driving offenders. The British Journal of Criminology, 51(5), 789–803. https://doi.org/10.1093/bjc/azr043
- Williams, J., & Weatherburn, D. (2022). Can electronic monitoring reduce reoffending? The Review of Economics and Statistics, 104(2), 232–245. https://doi.org/10.1162/rest_a_00954
- Wooldredge, J. D. (1998). Analytical rigor in studies of disparities in criminal case processing. Journal of Quantitative Criminology, 14(2), 155–179. https://doi.org/10.1023/A:1023076104837