Abstract
Hazards are taught with the belief that knowing something about their occurrence might help us avoid their consequences. The integrative nature of hazards – physical and social systems bound together – is attractive to the student and the instructor alike. Answering why we teach hazards is fairly straightforward. A more pressing question at present is this: how should we teach about hazards? To a large degree, attention towards how we teach hazards in a K-12 environment has been sparse. In this paper we explore the challenges faced when introducing hazards geography in a pre-collegiate setting. Following a review of the status of teaching hazards and the use of geographic information systems as an instructional aid, we outline a hazards course taught successfully for middle school students and discuss implementation obstacles for the traditional classroom.
Teaching About Hazards
‘Let it not be said that geographers have become so habituated to talking about the world that they are reluctant to make themselves a vital instrument for changing the world.’ (CitationWhite, 1972)
Why do we teach about hazards? Simply put, at the most basic level we do so with the belief that knowing something about their occurrence might help us avoid their consequences. The late Gilbert F. White pressed the geographic community on this issue in no uncertain terms. Turning this knowledge into action lies at the core of much applied geographic work within the field of hazards, and it has been so for more than 30 years. This ethical imperative drives our research to a large degree, but a practical, inescapable fact also pushes the hazards teaching enterprise: students are excited and intrigued by the subject matter. The integrative nature of hazards – physical and social systems bound together – is attractive to the student and the instructor alike.
At the collegiate level, hazards geography appears healthy. Of the 266 geography programs listed in the Guide to Geography Programs in the Americas, 93 universities specify that hazards is a program specialty by virtue of course offerings and/or faculty expertise (CitationAssociation of American Geographers, 2006). This number is assuredly conservative as hazards courses, although potentially missing a significant human component, are taught in other academic units – geology departments in particular. The USA's Federal Emergency Management Agency (FEMA) similarly documents disaster and emergency management coursework available elsewhere (FEMA, 2006).Footnote 1 Clearly the demand from students exists, and the globally mounting disaster losses suggest that there is still much to teach and learn. Answering why we teach hazards is fairly straightforward. A more pressing question at present is this: how should we teach about hazards?
To a large degree, attention towards how we teach hazards in a K-12 environment has been sparse. In the most recent reassessment of natural hazards in the United States,Footnote 1 CitationMileti (1999) highlights ‘innovative paths and new directions’ and includes education, albeit only higher education. Collegiate faculties, however, have considerably more leeway in approaching how hazards courses are taught when compared to K-12 educators. In this paper, we explore the challenges faced when introducing hazards geography in a pre-collegiate setting, and suggest that a successful strategy may be to use geographic information science (GIScience) approaches to support the integration of human and hazard event systems. Following a review of the status of teaching hazards and the use of geographic information systems (GIS) as an instructional aid, we outline a hazards course taught successfully for middle school students.
Hazards Geography in the K- 12 Classroom
Taking advantage of the ‘teachable moment’ or the use of current events topics to illustrate important concepts is an oft-used instructional strategy (CitationVirtue, 2007). The East Asian/Indian Ocean tsunami of 2004 and the U.S. Gulf Coast's Hurricane Katrina in 2005 are two recent examples of events where students and teachers alike explored the physical devastation and society's response to it. The concepts discussed depended upon the following: 1) the time available; 2) the teacher's own educational background; 3) the ages of the students (and their developmental level); and 4) whether hazards instruction fits within a larger curriculum and testing environment. The discussions were undoubtedly varied, and in many instances, incomplete. A complete understanding of disaster is imperative as young people themselves face different challenges according to their ages (CitationFrost, 2005).
A review of the existing literature suggests that two main areas of focus have been developed for hazards education. The first focus has been the creation of materials to teach hazards, or an appraisal of existing resources for said use. Over the past 20 years educators have been shown how to use hazards maps in the classroom (CitationCross, 1988), how geographic principles can be demonstrated by snow avalanches (CitationButler, 1988), volcanoes (CitationAnderson, 1987) and tornadoes (CitationLewis, 2006), and how hazard events may be altered in response to global change (CitationMitchell & Cutter, 1997). A digital hazards atlas of a U.S. state has also been developed for classroom use (CitationCutter et al., 1999; CitationThomas et al., 1999). Other recent efforts have appeared after the East Asian/Indian Ocean tsunami and Hurricane Katrina (CitationLintner, 2006; CitationAsh, 2007). These are but a few examples.
The second area of focus has been an appraisal of what should be taught in a hazards course. Work in this latter area is decidedly limited and scant. One early study suggests that people are often unaware of their local hazards and ‘not familiar enough with the K-12 curriculum to offer an opinion on the adequacy of hazard education’ (CitationVitek & Berta, 1982: 228). In another dated study, Valussi found, among other things, that students were not able to distinguish between ‘pure’ natural hazards and those in which human intervention was responsible, and that students were confused about disasters that could be forecasted (CitationValussi, 1984). Appropriately a course on hazards should therefore convey the links between human activities and disaster vis-à-vis risk and exposure. An understanding of the physical characteristics of events is also necessary, clarifying for example that earthquakes cannot be forecast as hurricanes can. Another appraisal of hazards geography indicates a bias towards physical geography pervades school curricula (CitationLidstone, 1996), a bias that extends internationally. Vulnerability – an understanding of social group resiliency and marginalisation – is rarely touched upon, if at all. A variety of teaching approaches are available, but many are technocratic and emphasise primarily structural mitigation as opposed to humanistic or non-structural interventions (CitationLidstone, 1990).
Should teaching hazards geography go beyond the description of hazards, the mapping of their occurrence and the emphasis on structural solutions? We believe so. What, then, should a geographical study of hazards include?
As early as 1982, Oliver (cited in CitationLidstone, 1990) suggested five components:
-
an analysis of the potentially threatening physical event;
-
the identification of other physical circumstances which may modify the behaviour of the hazard and the severity of its impact;
-
an analysis of the community social structure;
-
an analysis of the economic system; and
-
a study of environmental sensitivity.
We too utilise aspects of these components in our course model, and also emphasise current understanding in both physical and social vulnerability along with new geographic tools (e.g. GIS) to better comprehend the dynamics of disaster. We also engage the more complicated world we live in today – one that consists of natural events and those of human causation such as chemical spills.
But where is the geography? If one works with the assumption that geography, by virtue of its concern in both the physical and social domains, is the natural home to teach about hazards, then one must find where geography lies within the K-12 curriculum. Therein lays the problem. Scattered, perfunctory, uneven, ignored: all might describe the position of geographic inquiry in many K-12 schools. Natural disasters may be taught within regional geography (i.e. volcanoes when discussing Italy, floods while discussing China), but this is infrequent. An example from our home state of South Carolina is illustrative.
South Carolina mandates both science and social studies academic standards. Geography is allied with the social studies, as are history, economics and civics. Hazards, however, are mentioned primarily within the science standards. The treatment of hazards is therefore likely to be physical in orientation and technocratic in solution. Should disaster instruction occur within a social studies context, the geographic perspective still is not guaranteed as most teachers' content background lies within history. A broad interpretation of hazards in the South Carolina science and social studies standards is shown in and .
Table 1 Hazards within South Carolina science academic standards (CitationSCDE, 2005a)
Table 2 Hazards within South Carolina social studies academic standards (CitationSCDE, 2005b)
What guarantee exists for a geographic perspective? Beyond the course model suggested here, teachers themselves must be prepared in the content, willing to work cooperatively across disciplinary boundaries and consider alternative approaches to teaching.
GIScience in the K- 12 Classroom
The ability to think in spatial terms is essential to understanding the interactions between natural and cultural phenomena (CitationGershmehl & Gershmehl, 2006), the intersection represented by hazards. The teaching of geospatial skills in pre-collegiate settings is, therefore, highly valuable and desirable. It is crucial that K-12 students learn how to use technology and reason spatially so that they are prepared to understand and address economic, political and environmental issues at the local, national and global scale. We extend this understanding to hazards education and suggest that geographic technology such as GIS may provide a successful approach.
GIScience refers to technologies for collecting and analysing spatial information (CitationGoodchild, 1997). The main types of technology are global positioning systems (GPS), remote sensing, cartography/visualisation and GIS. GIScience is a science as it has a fundamental theoretical base for geographic data modelling, earth modelling (e.g. map projections, datums), cartographic communication and spatial data analysis. The GIScience foundation material is now mature and can be (and is for selected schools) offered in a pre-collegiate setting.
Computer technologies increasingly have been explored for their role in fostering the development of student's critical thinking, analysis and inquiry skills (CitationAudet & Abegg, 1996; CitationMontgomery, 2000; CitationRoschelle et al., 2000; CitationTinker, 1992). Educators have found that interactive technologies such as GIScience are particularly appropriate for conveying many spatial concepts (CitationKerski, 2001; CitationMeyer et al., 1999; CitationNellis, 1994; CitationThomas et al., 1999; CitationWest, 2003) and increase student's interest in technology-based learning (CitationLinn, 1997). GIScience, as an interactive teaching technology, can foster a rich student learning environment as students are immersed in project-based learning (learning by doing). Rather than listening to a discussion of soil types and their relationship to crop location, for example, a student may interactively engage the same data for further inquiry. Through project-based learning, factual retainment (CitationCamp, 1996), problem solving skills (CitationGallagher et al., 1992) and critical thinking are improved.
Several attempts have been made to introduce GIS within the K-12 curriculum (CitationAudet & Ludwig, 2000; CitationMalone et al., 2002) or to use GIScience concepts as a teaching tool. However, using computer-based cartographic, remote sensing or GIS approaches in the K-12 environment has serious impediments. These include software purchase, installation and maintenance; the availability of GIScience-based lesson plans; local school context; and teacher training, adoption and support. If these constraints can be surmounted, then GIS can support spatial thinking in a K-12 context by being ‘useful in solving problems in a wide range of real-world contexts’, by facilitating ‘learning transfer across a range of school subjects’ and by ‘providing a rich, generative, inviting, and challenging problem-solving environment for the users’ (CitationNational Research Council, 2006: 183).
Historic approaches to the use of GIScience in the K-12 curriculum have adopted the model ‘here is the technology, now how can it be used?’ This approach is commonly seen in the attempt by a class to use a fully functional GIS to support course modules. CitationMeyer et al. (1999) notes two major impediments with this approach – hardware requirements and the learning curve. Our approach reverses the actors and adopts the model ‘here are the learning goals, what GIScience technologies can be used to support these goals?’
Course Content and Implementation
The Carolina Master Scholars Program, a scholastically challenging summer program for academically talented students, provided the venue for implementing this course. The youth scholars program is designed to offer an educational experience that exceeds and complements what students are learning in school through hands-on experiences. Participants must be rising 6th through 12th graders, be academically qualified and identified by professionals at their school as talented students. This specific course included nine rising sixth graders and one rising eighth grader.
With only nine 2.5-hour teaching blocks available during the entire course, great care was taken to spend enough time to communicate basic ideas while also leaving time for hands-on investigation. For example, basic hazards terminology introduced on day 1 formed the basis for the final project presented on day 5. Any GIS activity culminated in output that could be utilised for the final project. All discussions and activities reinforced each other to maximise our time with the students. The following describes the basic structure of the course () and the content delivered.
Table 3 Topic presentation within the courseFootnote∗
Hazards content
We began with the initial premise that children long to learn about the relationships between people, places and their environments. Children are especially excited about their local environments – their physical world, their culture and their environment in which these activities exist. Once students are equipped with the skills and resources to appreciate their local geographies, they begin to care more about the geographies that lay outside their ‘local’ maps and understanding. Accordingly we began the course with a hazards tour of our community.
Given only the following information – ‘hazards are threats to people and the things they value’ – students were sent in two groups for a one-mile walk through the city. They were to record anything they believed fit that hazard definition, identify its location and suggest a consequence of that threat. As expected, a limited view of threats was evidenced. Broken curbs, glass and speeding cars summed up their experience. Missing from their observations: the large dam just north of the city, the presence of a floodplain, an active (but recently calm) seismic zone, the potential for tornadoes, hurricanes and other meteorological events, and so on. The experience allowed students to understand the interactions between places and events, even those they could not immediately see.
This exercise was followed by a brief discussion introducing students to some basic concepts in hazards research. The theoretical topics and terms presented to the students provided a base knowledge and familiarity with the field that served as the foundation from which the rest of the class was constructed. Specific topics covered are listed in .
Table 4 Major hazard concepts introduced
To provide a ‘real world’ example of the hazard concepts introduced earlier, we discussed Hurricane Katrina's impact on the U.S. Gulf Coast in 2005. This example demonstrated how the theoretical concepts (i.e. hazard, disaster, risk, vulnerability) applied to a specific event.
Again, to reinforce the progressive knowledge building throughout this class, the links between theory and practice were built into the rest of the course curriculum. Two case-study hazard events were analysed using the concepts discussed earlier. Events for this analysis included the Graniteville, SC, train derailment and chlorine release of January 2005, and Hurricane Katrina as experienced in Harrison County, MS. These events provided a range of differences in event type, scale and magnitude that allowed the students to experience how such variety would influence their approach in understanding those events. The analysis of each event was an ongoing process using a combination of hazards theory and GIS applications, which will be discussed in the next section.
As a final wrap-up activity, students participated in a role-playing game. Here a hypothetical disaster event was assigned to each group and students took on a variety of community roles to better understand the challenges faced before, during and after a disaster. Different scenarios (lesser vs. more developed areas) and varied hazards allowed students to consider the different parameters of events and the resources of people to respond.Footnote 3
GIS content
The GIS content included in the course was designed to illustrate the hazards principles taught. GIS was treated as a valuable analytic toolset rather than as the primary focus of investigation. We began designing the GIS content by considering how these approaches could be used to support the broad teaching goals for the course, helping students understand the relationships between hazard events and human populations in the creation of disasters. It was decided that these linkages could be best demonstrated by having students identify which populations would likely be most adversely impacted by specific hazard events. This goal was the foundation of students' course work and more specifically of their final project presentation. GIS data, including base map data (road and rail networks, city locations, river networks), hazard event parameters (storm surge for Hurricane Katrina and the modelled plume for the Graniteville chlorine release) and U.S. census data at the tract level were provided to students for the two case study locations, Harrison County, MS, and Aiken County, SC. Each GIS-focused course period was divided into two components: a lecture that introduced GIS topics or hazard event parameters, and a guided lab that gave students hands-on experience and created an output for the final project and presentation. A list of the specific GIS concepts taught is given in . The first GIScience topic introduced to students focused on GPS and their use in hazard and disaster events. This exercise provided students with experience using technology instrumental in the data collection process that could later be imported into a GIS. It also gave students the opportunity to see how GPS receivers work in the field, and how they can be useful for navigation purposes. The lecture portion for this topic covered basic conceptual definitions, GPS application in hazards research and disaster settings, and finally specific instructions on operating a GPS receiver. Students then participated in a geocaching exercise (GPS-based treasure hunt) to give them hands-on experience in operating a GPS receiver and a greater familiarity with GPS in general.
Table 5 Major GIS concepts introduced
Basic introductory GIS concepts were next introduced to students. The second lecture period was designed to expose them to linking attribute and spatial data, the value of data overlay, basic spatial data models and structures, and examples of GIS concepts used in hazards and disasters applications. This exposed students to what spatial data are and how they are different from non-spatial data, the different types of spatial data and how to work with and manipulate them. These fundamental spatial data concepts served as the foundation for all subsequent GIS exercises. An introductory GIS lab was designed to give students applied experience with these concepts through the creation of a base map for each study area, including roadways, railroads, river networks and city locations ().Footnote 4 The GIS labs were taught in the Department of Geography's Training Lab, using PC's running Windows XP and ESRI's ArcMap 9.1 GIS software.
Figure 1 Base map of Graniteville, SC

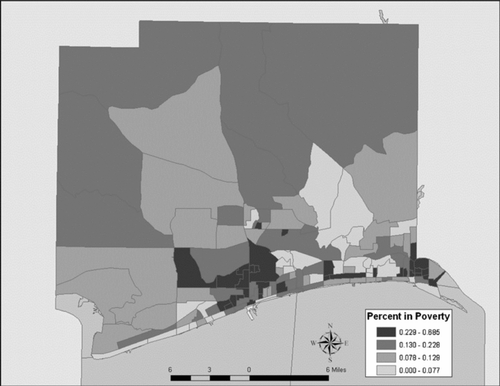
Because visualising elements of social vulnerability is such an important part of hazards research, students were next taught various approaches to thematic mapping, with a particular emphasis on choropleth mapping. In addition to lecturing on this topic, the next class session included a lab in which students prepared a series of choropleth maps of variables related to social vulnerability for Harrison County, MS, and Aiken County, SC. The specific variables mapped were the percentage of elderly (older than 65) residents, the percentage of children under 5, the percentage of population below the poverty level and the density of population per census tract within both counties (some examples are given in and ). Course instructors discussed the relationship of these variables to hazard vulnerability and the utility of these maps in identifying the location of vulnerable populations. Students were next introduced to attribute data processing to gain further knowledge about the locations of vulnerable populations. They were taught important GIS tabular functions such as how to perform attribute queries, create new attribute fields and populate records with values for these new attributes. These exercises not only increased students' repertoire of GIS skills, but also directly related to their final project assignments.
Figure 2 Vulnerability for Harrison County, MS – children vulnerability space
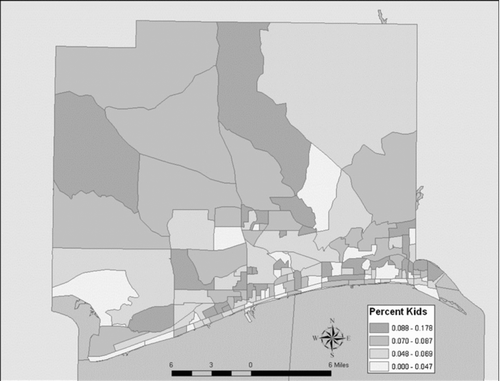
Figure 3 Vulnerability for Harrison County, MS – poverty vulnerability space
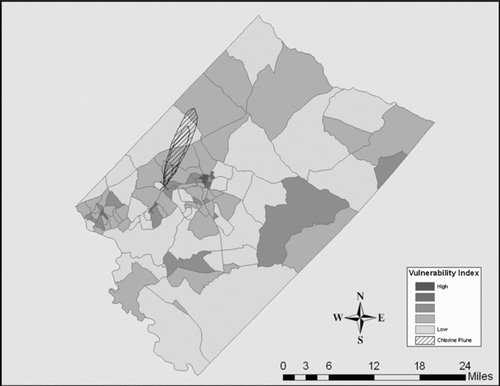
The final project of the course was introduced to students at this point. Students were to identify those places most likely to be adversely impacted by the two case study hazard events considered in the course. While it was not explicitly integrated into the course, the Hazards of Place model of vulnerability (CitationCutter, 1996) provided the conceptual basis for the final lab. In this model, the spatial extent of hazardous conditions and the distribution of social vulnerability combine to create place vulnerability. The students' final project involved creating a simple model of social vulnerability based on the variables they had previously mapped, and performing a spatial query to identify socially vulnerable tracts that were located in the case study hazard zones.
To model social vulnerability, students created a set of four new variables by determining if tracts had values in the top quartile for each of the four vulnerability variables introduced earlier. A value of one was assigned if the tract was in the top quartile and a zero otherwise. Total social vulnerability was then modelled by summing these four new variables. In this model, tracts that had a social vulnerability value of 4 were considered the most vulnerable, as they had values in the top quartile for all four vulnerability variables. While this model was extremely simplistic, it provided students with a basic understanding of creating new information (quantifying vulnerability) from existing data.
Finally, a spatial query was performed to identify which tracts were located within the hazard zones in the county. The hazard zones considered were the SLOSH modelled storm surge from Hurricane Katrina in Harrison County, MS, and the modelled release plume from the chlorine spill in Aiken County, SC. Another variable was created, and tracts which intersected the hazard zones were assigned a value of one, while tracts which did not were assigned a zero. This variable was multiplied by the social vulnerability variable to create an overall place vulnerability variable. Values of zero for this variable signified that the tract was either located outside the hazard zone, or had values that were not in the top quartile of any of the vulnerability variables. A choropleth map displayed the social vulnerability and overall vulnerability variables, with an overlay of the hazard zone area for reference on the final map ( and ).
Figure 4 Overall place vulnerability for Harrison County, MS
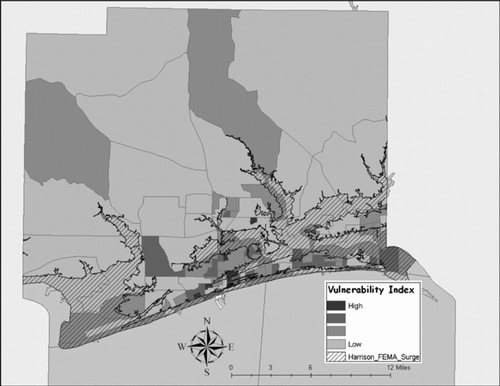
Figure 5 Overall place vulnerability for Graniteville, SC
Final product – student presentations
In the final two lectures of the GIS portions of the course, instructors modelled the presentations students would give through introductions of the timelines and parameters of the case study events. Students were assigned to one of two groups: one giving a presentation on Hurricane Katrina in Biloxi, and the other presenting on the Graniteville train wreck and chlorine spill. We wish to note that although students presented on only one hazard event, each student completed the analysis for both events over the one-week course. Course instructors helped the students to develop the layout and content of their presentations. The presentations included sections on event timelines and descriptions, as well as on the analysis of vulnerability they conducted in the course. Visual aids for the students' presentations were developed using the Microsoft Office PowerPoint software. A raster image of a map prepared by each student was included in the presentations. Presentation outlines followed a standard template: after introducing the event and its parameters, students displayed choropleth maps of the four vulnerability variables analysed, and described both the impact of those variables on vulnerability, as well as their spatial distributions. The modelled social vulnerability map was displayed, and students described the spatial patterns and the process through which it was created. Finally, students displayed the overall vulnerability map with a hazard zone overlay, described the spatial patterns shown and explained how they created the maps. The presentation concluded with a general discussion of how these approaches could apply to emergency planning and management.
The presentations were each about 20 minutes in length, and were given to an audience consisting of the student's family members and friends, as well as course instructors and staff. Each student took a turn at giving a portion of the group's presentation. Students then responded to questions from the audience regarding their presentations.
Discussion and Conclusions
In simple terms the integrated hazards-GIScience approach taken here appears successful. The positive feedback from the students and their parents (once they had seen what their children had accomplished), and a request from the Carolina Master Scholars Program that the course be taught again implies satisfaction with the outcome and the experience. Other evaluative concerns, however, remain. Among these concerns are the hazards content, the utility of GIScience as appropriate for instruction and the ability to integrate this experience within a traditional classroom setting.
We began this effort by asking how we should teach about hazards. A review of the literature and our own teaching and research backgrounds suggested that student's understanding would be best fostered by using an approach that equally considered natural and human processes. Appropriately, we demonstrate the advantages of teaching this subject through a geographic lens, focusing on the variations in places that give rise to hazard exposure (physical), vulnerability and resilience. Importantly, care must be taken to advance these topics at a grade-appropriate level. We chose, for example, to look at vulnerability from two easily understood positions: poverty and age. We avoided the complexity that would ensue from other social distinctions such as gender, race or ethnicity, topics more suitable for older students. While it is arguable still how much time or emphasis should be placed upon either the physical or human domains, the neglect of either clearly threatens the comprehensive understanding we desire.
Much less clear is whether GIScience concepts advance hazards learning in the many ways we hope. These concerns are laid out perhaps no better than by CitationBednarz (2004), who details three justifications for incorporating GIS in K-12 education: the educative, the workplace and the place-based. The educative justification argues that GIS incorporation will enhance spatial thinking skills.Footnote 5 As GIS models spatial thinking processes, its use will strengthen such skills, or so the reasoning asserts. CitationBaker and White (2003) reported modest improvements in student data analysis skills with GIS and improvements in technology attitudes and science self-efficacy compared to a non-GIS control group. On this point, we have no evidence, nor did we test for, improvement in spatial skills with this small student group. We can relate anecdotally that our students were excited to work with the software and believe that increased engagement did enhance the learning process. While this enthusiasm could be attributed to engagement with any hands-on activity, we note that student commentary focused specifically on the desire to work with computers. Another important observation of CitationBaker and White (2003), one we too detected, was that GIS use and its rapid mapping capability freed more time to move beyond the ‘where does the phenomenon occur’ questions to begin asking the ‘why does it occur there’ questions. The workplace justification – meeting workplace needs and making science and engineering careers attractive – was at no point considered as an outcome of this course given the age group taught.
The third justification, the place-based, does have important value for the study of hazards. This approach is attractive as many teachers believe that grounding learning in local environments and experiences has tremendous value (CitationBednarz, 2004). We were able to demonstrate GIS as a useful tool by uncovering relationships between different groups of people and hazardous locations that was not readily apparent otherwise. One desired outcome was for our students to view hazards as normal occurrences, not just events existing elsewhere. By investigating two specific events within their local geographies, students could begin to identify spatial analogues (CitationGershmehl & Gershmehl, 2006) between those events and the geographies of their own communities. Whether using GIS positively affected spatial skill building as related to hazards requires more research.
A final concern in this discussion is how to integrate this experience within a traditional classroom setting. This experience involved advanced students who selected the course in their ‘free’ summer school break. They were motivated, interested in the subject matter and had no school distractions other than this course. Accordingly, it was possible to push them a bit harder.
We believe that the middle school level is most appropriate for this introduction for a variety of reasons. First, middle school teachers are specialists in interdisciplinary teaching, and often team together with common planning sessions (CitationBeane, 1993, Citation1997). They are actively looking for ways to connect the various disciplinary curriculums. Much of this relates to the middle level learner who does well by doing, not just listening (CitationAlexander, 2006). Active learning for this age cohort helps facilitate other higher learning skills. Middle school students are transitioning from concrete to formal operational stages and are beginning to be able to make connections, arrive at deep understandings and think critically. This is precisely the stage at which it is appropriate to engage them in the kind of learning we describe. This experience introduces abstract concepts through very concrete examples and contexts. The appeal for middle level students can be found in this application of learning to a local and pressing example, through the use of computers and by working cooperatively in groups. As noted by Virtue (Citation2007: 17), these ideas about curriculum ‘resonate with the philosophy of curriculum and curriculum integration widely endorsed in the middle level literature’ and are further reinforced by the National Middle School Association (NMSA) which endorses curriculum that ‘is distinguished by learning activities that appeal to young adolescents and create opportunities to pose and answer questions that are important to them’ (NMSA, 2003: 19).
The middle school model also provides opportunities for ‘exploratory courses’ where students experiment with shortened courses (e.g. nine weeks). The key remaining obstacle for teachers is to find connections within the mandated state academic standards so that their efforts engaging this material in this manner are worthwhile. Ideally, the next step for this course (after additional refinement within the Master Scholars program) is to pair with a middle school willing to offer the course on a trial basis and to target a more heterogeneous group, not just academically gifted students.
To conclude, the hazards course taught through the Carolina Master Scholars Program illustrates two major issues regarding hazards education at the K-12 level. How should we teach about hazards? First, geography as the base discipline is well suited to integrate both the physical and the social aspects of hazards and disasters, and it is through this framework that we should be teaching about this subject. Second, we see that the familiarity of technical tools such as GIS facilitates a unique hands-on learning environment for students that can also work to strengthen geospatial literacy. More work is necessary for successful implementation. Hardware constraints, teacher training and standards compatibility remain problematic (CitationBednarz & van der Schee, 2006). We are nonetheless optimistic that achieving the twin goals of improving hazards understanding and geospatial skills is possible through this experience.
Acknowledgments
The authors wish to thank the editor and the three reviewers who provided constructive critiques of this paper. Additional thanks are due to Susan Wise, Monti Caughman and David Virtue for their helpful comments. The course on which this paper is based on was made possible by the Carolina Master Scholars Program within the Summer and Youth Academic Programs at the University of South Carolina.
Notes
∗Earth Science (ES) is typically taught in the ninth grade, but this does vary in some parts of the state.
∗All sessions were 2.5 hours in length; additional time was made available for project preparation.
∗The components of each GIS&T body of knowledge topics listed were not comprehensively taught; rather, those topics related to concepts taught in the course are identified. CitationDiBiase et al. (2006).
1 .FEMA has worked recently to determine the education needs of professional emergency managers as well. See CitationThomas and Mileti (2003).
2. The track record is not much better in other countries as only 33 of 82 nations that have reported to the United Nations International Strategy for Disaster Reduction indicate that disaster-related subjects form a part of their national school curricula. See Briceno (2007).
3. The simulation game instructions can be found in CitationMitchell and Cutter (1997). A variation on this theme is found in CitationValussi (1984).
4. All maps displayed within this paper were constructed by the students.
5. WhetherGIS is capable on this point is debatable.Aconsiderable amount of attention is now focused on identifying spatial thinking skills for assessment and subsequent training and materials development. See CitationGershmehl and Gershmehl (2006).
Related Research Data
References
- Alexander , W. M. 2006 . Student-Oriented Curriculum , Westerville, OH : National Middle School Association .
- Anderson , J. 1987 . Learning from Mount St. Helens: Catastrophic events as educational opportunities . Journal of Geography , 86 ( 5 ) : 229 – 233 .
- Ash , K. 2007 . College offers lessons tied to Katrina documentary . Education Week , 26 ( 20 ) : 17
- Association of American Geographers . 2006 . Guide to Geography Programs in the Americas, 2005–2006 , Washington, DC : Association of American Geographers .
- Audet , R. and Abegg , G. 1996 . Geographic information systems: Implications for problem solving . Journal of Research in Science Teaching , 33 : 21 – 45 .
- Audet , R. and Ludwig , G. 2000 . GIS in Schools , Redlands, CA : ESRI Press .
- Baker , T. R. and White , S. H. 2003 . The effects of G.I.S. on students' attitudes, self-efficacy, and achievement in middle school science classrooms . Journal of Geography , 102 ( 6 ) : 243 – 254 .
- Beane , J. A. 1993 . A Middle School Curriculum: From Rhetoric to Reality, , 2nd ed , Columbus, OH : National Middle School Association .
- Beane , J. A. 1997 . Curriculum Integration: Designing the Core of Democratic Education , New York : Teachers College Press .
- Bednarz , S. W. 2004 . Geographic information systems: A tool to support geography and environmental education? . GeoJournal , 60 : 191 – 199 .
- Bednarz , S. W. and van der Schee , J. 2006 . Europe and the United States: The implementation of geographic information systems in secondary education in two contexts . Technology, Pedagogy, and Education , 15 ( 2 ) : 191 – 205 .
- Boehn , D. L. 1996 . “ Geographic education in Germany on natural disasters ” . In International Perspectives on Teaching about Hazards and Disasters , Edited by: Lidstone , J. 33 – 38 . Clevedon, , UK : Channel View Publications .
- Briceno , S. 2007 . Reducing vulnerability to disasters through education and school safety . Natural Hazards Observer , 31 ( 3 ) : 1 – 3 .
- Butler , D. R. 1988 . Teaching natural hazards: The use of snow avalanches in demonstrating and addressing geographic topics and principles . Journal of Geography , 87 ( 6 ) : 212 – 227 .
- Camp , G. 1996 . “ Problem-based learning: A paradigm shift or a passing fad? ” . In Medical Education Online On WWW at http://www.med-ed-online.org
- Cross , J. A. 1988 . Hazard maps in the classroom . Journal of Geography , 87 ( 6 ) : 202 – 211 .
- Cutter , S. L. 1996 . Vulnerability to environmental hazards . Progress in Human Geography , 20 ( 4 ) : 529 – 539 .
- Cutter , S. L. , Thomas , D. S.K. , Cutler , M. E. , Mitchell , J. T. and Scott , M. S. 1999 . South Carolina Atlas of Environmental Risks and Hazards , Columbia, SC : University of South Carolina Press .
- DiBiase , D. , DeMers , M. , Johnson , A. , Kemp , K. , Luck , A. T. , Plewe , B. and Wentz , E. Geographic Information Science & Technology Body of Knowledge , Washington, DC : Association of American Geographers .
- Federal Emergency Management Agency . 2006 . “ Syllabi Compilation ” . In Emergency Management Institute On WWW at http://training.fema.gov/EMIWeb/edu/syllabi.asp
- Frost , J. L. 2005 . Lessons from disasters: Play, work, and the creative arts . Childhood Education , 82 ( 1 ) : 2 – 8 .
- Gallagher , S. , Stepien , W. and Rosenthal , H. 1992 . The effects of problem-based learning on problem solving . Gifted Child Quarterly , 36 : 195 – 200 .
- Gershmehl , P. J. and Gershmehl , C. A. 2006 . Wanted: A concise list of neurologically defensible and assessable spatial-thinking skills . Research in Geographic Education , 8 : 5 – 38 .
- Goodchild , M. 1997 . “ What is geographic information science? ” . In NCGIA Core Curriculum in Geographic Information Science On WWW at http://www.ncgia.ucsb.edu/giscc/units/u002/u002.html
- Kerski , J. 2001 . A nationwide assessment of GIS in American high schools . International Research in Geographical and Environmental Education , 10 : 72 – 84 .
- Lewis , T. 2006 . The Tornado hazard in southern New England: History, characteristics, student and teacher perceptions . Journal of Geography , 105 ( 6 ) : 258 – 266 .
- Lidstone , J. 1990 . Geography and hazard education: Same content, different agendas . Asian Geographer , 9 ( 2 ) : 99 – 111 .
- Lidstone , J. 1996 . International Perspectives on Teaching About Hazards and Disasters , Clevedon, , UK : Channel View Publications .
- Linn , S. 1997 . Effectiveness of interactive maps in the classroom: A selected example in studying Africa . Journal of Geography , 96 : 164 – 170 .
- Lintner , T. 2006 . Hurricanes and tsunamis: Teaching about natural disasters and civic responsibility in elementary classrooms . Social Studies , 97 ( 3 ) : 101 – 104 .
- Malone , L. , Palmer , A. and Voigt , C. 2002 . Mapping Our World: GIS Lessons for Educators , Redlands, CA : ESRI Press .
- Meyer , J. W. , Butterick , J. , Olkin , M. and Zack , G. 1999 . GIS in the K-12 curriculum: A cautionary note . Professional Geographer , 51 ( 4 ) : 571 – 578 .
- Mileti , D. 1999 . Disasters by Design , Washington, DC : Joseph Henry Press .
- Mitchell , J. T. and Cutter , S. L. 1997 . Global Change and Environmental Hazards: Is the World Becoming More Disastrous? , Washington, DC : Association of American Geographers .
- Montgomery , K. 2000 . Children's media culture in the new millennium: Mapping the digital landscape . The Future of Children , 10 ( 2 ) : 145 – 167 .
- National Middle School Association . 2003 . This We Believe: Successful Schools for Young Adolescents , Westerville, OH : Author .
- National Research Council . 2006 . Learning to Think Spatially , Washington, DC : National Academies Press .
- Nellis , D. 1994 . Technology in geographic education: Reflections and future directions . Journal of Geography , 93 : 36 – 39 .
- Oliver , J. 1982 . “ Natural hazard studies in a geography teaching framework ” . In Proceedings: Meeting of Geography Teachers Association In-Service Teams , Brisbane : Geography Teachers Association of Queensland .
- Roschelle , J. , Pea , R. , Hoadley , C. , Gordin , D. and Means , B. 2000 . Changing how and what children learn in school with computer-based technologies . The Future of Children , 10 ( 2 ) : 76 – 101 .
- South Carolina Department of Education . 2005a . South Carolina Science Academic Standards , Columbia, SC : SCDE .
- South Carolina Department of Education . 2005b . South Carolina Social Studies Academic Standards , Columbia, SC : SCDE .
- Thomas , D. S.K. and Mileti , D. 2003 . Designing Educational Opportunities for the Hazards Manager of the 21st Century Workshop Report, FEMA Higher Education Project
- Thomas , D. S.K. , Mitchell , J. T. , Scott , M. S. and Cutter , S. L. 1999 . Developing a digital atlas of environmental risks and hazards . Journal of Geography , 98 ( 5 ) : 201 – 207 .
- Tinker , R. 1992 . Mapware: Educational applications of geographic information systems . Journal of Science Education and Technology , 1 ( 1 ) : 35 – 48 .
- Valussi , G. 1984 . “ The perception of hazards in geographical education: Research methods ” . In Research and Research Methods in Geographical Education , Edited by: Graves , N. 82 – 97 . Brussels, Belgium : International Geographical Union .
- Virtue , D. C. 2007 . Seizing critical teachable moments to develop integrative middle level curriculum: A generative approach . Middle School Journal , : 14 – 20 . March
- Vitek , J. D. and Berta , S. M. 1982 . Improving perception of and response to natural hazards: The need for local education . Journal of Geography , 81 ( 6 ) : 225 – 228 .
- West , B. 2003 . Student attitudes and the impact of GIS on thinking skills and motivation . Journal of Geography , 102 : 267 – 274 .
- White , G. F. 1972 . Geography and public policy . The Professional Geographer , 24 ( 2 ) : 101 – 104 .