
ABSTRACT
Creative thinking is an important aspect of education. However, students differ widely in their ability to think creatively. Working memory might explain these differences. Therefore, this study focuses on how different aspects of WM can explain differences in divergent thinking, both separately and conjointly. To do so, latent profile analysis was used. Working memory profiles of 561 primary school students (Mage = 10.10 years) were investigated in relation to divergent thinking and as a moderator of the relationship between divergent thinking and academic achievement. Four profiles were identified: a low verbal – medium visual, a medium verbal-low visual, a medium verbal – medium visual, and a high verbal – high visual profile. Visual divergent thinking scores differed between three of the profiles. Furthermore, these profiles were analyzed as a moderator in the relationship between divergent thinking and academic achievement, given the inconsistent relationships found between the two in previous research. Working memory profiles did not moderate the relationship between divergent thinking and academic achievement. Verbal divergent thinking was related to mathematics and visual divergent thinking to reading comprehension. We discuss the need for educators to be aware of differences between children in working memory.
Introduction
Creative thinking has been emphasized by researchers as an important skill in contemporary society, specifically in education (e.g., Collard & Looney, Citation2014; Karwowski & Soszynski, Citation2008; Shaheen, Citation2010). However, teachers struggle to support creative thinking in education (Schacter et al., Citation2006). An important reason for this struggle is that education targets heterogeneous groups of children, who differ in a variety of cognitive skills. To effectively teach children to think creatively, we first need to unravel how differences in creative thinking can be explained. An important explanatory factor might be working memory (WM), as research has found clear relations between WM and divergent thinking, an important aspect of creativity (Ansburg & Hill, Citation2003; Benedek et al., Citation2014; Runco, Citation2010; Takeuchi et al., Citation2011; Wiley & Jarosz, Citation2012). Students with good WM capacity can better store and manipulate information, which could help them to generate multiple original ideas.
Different components of WM can be distinguished, including verbal WM and visual WM (Baddeley, Citation2000, Citation2003). Each of these separate WM components might be related to divergent thinking, but verbal and visual WM could also be related to divergent thinking together. For example, children with strong verbal WM but weaker visual WM might struggle more with divergent thinking than a child that has both strong verbal and visual WM because these children are able to update their WM with both verbal and visual information and use this information to generate original ideas (Stolte et al., Citation2020; Takeuchi et al., Citation2011). Different combinations of WM might thus lead to different divergent thinking outcomes. Previous research has solely focused on how separate aspects of WM influence divergent thinking, while we propose that it is a student’s profile of WM skill that drives individual differences in divergent thinking. By taking a person-centered approach, this study aims to identify different WM profiles and relate these profiles to divergent thinking. Furthermore, given inconsistent findings concerning the strength and direction of relations between divergent thinking and academic achievement (Gajda et al., Citation2017), WM profiles are also investigated as a possible moderator of this relation. WM plays an important role in both divergent thinking and academic achievement (e.g., Benedek et al., Citation2014; Jacob & Parkinson, Citation2015). Because different combinations of WM could give way to different divergent thinking outcomes, it seems plausible that divergent thinking is related differently to academic achievement for students with different WM profiles. In all, these findings could provide more insights into how a child’s unique composition of skills affects their ability to think creatively.
Working memory profiles
WM can be described as “a brain system that provides temporary storage and manipulation of the information necessary for such complex cognitive tasks as language comprehension, learning, and reasoning” (Baddeley, Citation1992, p. 556). WM is proposed to consist of a central executive, episodic buffer, phonological loop and visuo-spatial sketchpad (Baddeley, Citation2000, Citation2003). The central executive is concerned with controlling capacity of attention and the episodic buffer offers storage capacity to integrate information, for example chunking of serial information. The phonological loop and visuo-spatial sketchpad are specialized systems, representing respectively storage of auditory (e.g., verbal) information and visuo-spatial information. Consequently, verbal and visuo-spatial WM involve the storage and processing of verbal and visuo-spatial information by these specialized systems (Van de Weijer-Bergsma et al., Citation2015). Importantly, it is this component of storage that differentiates WM from a more general measure like intelligence. Although the two constructs are related, they are clearly distinguishable since WM refers to the storage and manipulation of information while intelligence refers to processes like reasoning and problem-solving (Ackerman, Beier, & Boyle, Citation2005; Chooi, Citation2012). Accordingly, WM training has no effect on measures of intelligence (Melby-Lervåg et al., Citation2016).
Verbal and visuo-spatial WM systems can be distinguished in children, with relatively low positive correlations between the two (i.e., correlations of small-medium strength, r = .19–.37; Jarvis & Gathercole, Citation2003). Both the verbal and visuo-spatial WM system seem to draw upon the central executive’s control of attention, and the integration of information through the episodic buffer when processing specific information. However, verbal and visuo-spatial codes are stored separately in the WM system (Alloway et al., Citation2006), explaining why the correlation between the two is relatively low and the two can be considered separate systems.
Students oftentimes may not demonstrate a similar level of skill in both WM domains (Jarvis & Gathercole, Citation2003). Therefore, it is likely that different subgroups of children can be distinguished, with some having a strong verbal working memory, but a weaker visuo-spatial working memory, while others for example demonstrate high skills in both, and other combinations are possible. These different subgroups based on combinations of verbal and visuo-spatial WM could also be called “profiles.” Person-centered analyses are aimed at identifying these different profiles to distinguish relevant WM subgroups (Crockett et al., Citation2006). Using more common variable-centered approaches, the association between individual verbal and visual WM and divergent thinking could be assessed. However, such an approach could misrepresent individuals in a sample because individual WM scores are aggregated to investigate relationships among variables (Von Eye & Bergman, Citation2003). Instead, a person-centered approach focuses on identifying naturally occurring combinations of verbal and visual WM at the level of the individual.
However, to our knowledge little to no research focused on such within-person WM differences as of yet. One study has looked into WM profiles, but focused specifically on children with learning difficulties (Pickering & Gathercole, Citation2004). Based on measures of the phonological loop, visuo-spatial sketchpad and central executive, they identified three groups of children with different WM profiles. These profiles included a profile with deficits in the phonological loop and the central executive but not the visuo-spatial sketchpad, a profile with deficits in all systems and a profile with no deficits in any system. These profiles were not just hierarchically ordered (i.e., no WM deficits, medium deficits, large deficits), but illustrate how each component of WM can vary in the different profiles. For example, the deficit to the phonological loop was a lot smaller in the profile with deficits to all three components than in the profile with deficits to two components. This shows that the profiles are a reflection of within-person differences, rather than general differences of WM as a single variable.
Moreover, these profiles were associated with type of learning difficulty. That is, deficits in the phonological loop and the central executive but not the visuo-spatial sketchpad were associated with language impairments, while deficits in all WM systems were associated with general learning difficulties. Children with literacy or behavioral problems on the other hand, showed an average level of WM in general. Another study, conducted in a typically developing population, also points to within-subject differences in WM that relate to differences in processing efficiency and storage capacity on complex span tasks (Bayliss et al., Citation2003). However, this study did not investigate the occurrence of specific profiles. Thus, there are indications that different WM profiles can be distinguished and have predictive value for individual outcomes, but research to illustrate this is lacking.
Working memory profiles and divergent thinking
The occurrence of WM profiles could be an explanatory factor for differences between children in divergent thinking. Divergent thinking can be defined as the ability to generate different ideas (Brophy, Citation2001) and is generally seen as a cognitive aspect of creative potential (Barbot, Besancon, & Lubart, Citation2015). WM in general is an important characteristic when it comes to divergent thinking and learning. For example, WM explains a significant part of the shared variance between divergent thinking and intelligence (Benedek et al., Citation2014). Storage and manipulation of information through WM might be beneficial to divergent thinking as one could expect this storage and manipulation to facilitate the generation of original and effective ideas. Indeed, research has found positive associations of students’ general WM with divergent thinking (Stolte et al, Citation2020; Takeuchi et al., Citation2011).
However, there are differences between students regarding how WM affects divergent thinking (Wiley & Jarosz, Citation2012). This might be dependent on a child’s specific composition of verbal and visuo-spatial WM. On the one hand, students with a profile composed of low verbal WM and high visuo-spatial WM might be able to think divergently more easily. Reduced verbal WM has been shown to be related to higher divergent thinking scores (Lin & Lien, Citation2013). A possible explanation is that verbal WM is associated with controlled attention and thinking, which might harm the more spontaneous process of associative thinking necessary in creativity (Lu et al., Citation2022). High visuo-spatial WM seems to aid divergent thinking performance on the other hand, because information presented in creativity tasks seems to be processed predominantly visually (Lu et al., Citation2022). However, different relations between WM profile and divergent thinking could also be possible. One might expect children with low verbal and low visuo-spatial WM to be good at divergent thinking, because these children’s attention process would be more diffuse, allowing them to make use of several visual and verbal cues to come to creative ideas (Ansburg & Hill, Citation2003). Yet a different possibility might be that children with high verbal and visuo-spatial WM demonstrate the highest divergent thinking scores, because they are able to update their WM with verbal and visual information, which serves as input to generate creative ideas (Stolte et al., Citation2020; Takeuchi et al., Citation2011). All in all, results are inconsistent and little is known about these processes, since previous research does not provide insight into how WM profile might affect concurrent creative ability, also referred to as creative potential (Barbot et al., Citation2015). One could expect that rather than general WM driving differences in creativity, it might be more subtle differences as reflected in a student’s WM profile that relate to differences in divergent thinking.
A study by Kell and colleagues (Citation2013) that investigated different abilities in 13-year old intellectually gifted students provides preliminary evidence that specific differences in verbal/(visuo)spatial abilities could be related to differences in creative achievement. Kell et al, (Citation2013) identified students with low verbal but high spatial abilities, higher verbal and lower spatial abilities, high verbal and high spatial abilities and low verbal and low spatial abilities. Next, they examined how these abilities were related to creative achievement later in life and found that students with different patterns of ability showed different creative achievements. That is, students with low verbal but high spatial abilities were more likely to secure a patent later in life, while students with higher verbal but lower spatial abilities showed better creative achievements in biology and medicine. On the other hand, students with high verbal and high spatial abilities attained creative achievements in the STEM field, and students with low verbal and low spatial abilities attained creative achievements that did not fit a predefined category. Furthermore, spatial ability explained more variance in differences between students’ creative outcomes than verbal ability. Although this study did not focus on WM directly, it does illustrate how differences in verbal and (visuo)spatial ability are related to creativity. In the same way, students with different patterns of WM achievement might show different creative outcomes.
When investigating WM profiles in relation to divergent thinking, it is important to distinguish between verbal and visual divergent thinking. Students’ creative abilities might differ between domains, calling upon different underlying skills (Silvia et al., Citation2009). An important difference between creativity measures is whether they have a verbal or figural nature. Verbal tasks require a response in the form of language (e.g., writing a story) and measure verbal creativity or divergent thinking, while figural tasks require a visual product (e.g., a drawing) and measure visual creativity or divergent thinking (Gajda et al., Citation2017). One could imagine that verbal WM mostly predicts verbal divergent thinking, while visuo-spatial WM mostly predicts visual divergent thinking. However, research that has investigated the link between verbal and visuo-spatial WM and verbal and visual divergent thinking has found that while students’ visual divergent thinking is predicted mostly by visuo-spatial WM and other visual skills, verbal divergent thinking is sensitive to both verbal and visuo-spatial WM (Palmiero et al., Citation2010). Studies that simultaneously investigate verbal and visuo-spatial WM in relation to divergent thinking are scarce, thus ignoring potential differences in WM profile between participants (Alloway et al., Citation2006; Pickering & Gathercole, Citation2004). Thus, the current study explores how students’ WM profiles might be related to their visual and verbal divergent thinking.
Working memory profile as a moderator
In addition, in this study we also examine whether WM profiles moderate the relationship between divergent thinking and academic achievement. Students’ divergent thinking is proposed to have a mutually supportive relationship with learning (Beghetto, Citation2016). A recent meta-analysis indicated that overall, measures of creativity (including divergent thinking) are positively related to academic achievement (r = .22; Gajda et al., Citation2017). This result is similar to the result of a meta-analysis on the relation between creativity and intelligence (r = .14, Kim, Citation2005). Nonetheless, findings of different studies on creativity, divergent thinking and academic achievement are inconsistent. Some studies have found a positive relationship between the two constructs (e.g., Niaz et al., Citation2000), while others have found a negative relationship (e.g., Habibollah et al., Citation2010), or found no relationship (e.g., Grigorenko et al., Citation2009). These findings relate to previous research by Karwowski (Citation2017), who demonstrated that there is variation between students in the extent to which creativity can adequately be converted to academic achievement. Specifically, Karwowski postulated that creativity can aid academic achievement as thinking of original and effective ideas might help students notice and connect different new knowledge elements, and integrate them with existing knowledge. However, although some students might be able to think of original ideas, integration with existing knowledge might be more difficult for them. This means that high creativity scores might not always go together with high academic achievement scores. Gajda et al., (Citation2017) found that several moderating factors affected these inconsistent results, like the type of measurement (a stronger relationship between divergent thinking and academic achievement was found when divergent thinking tests are used as opposed to self-report scales) and student’s educational stage (stronger relation between divergent thinking and academic achievement for middle school than for elementary students). However, what was not considered in their study, or any other study to our knowledge, is whether differences between children in characteristics other than type of measurement and educational stage might have caused differences in this relationship. We propose that differences in WM may account for the inconsistency in findings.
WM could play different roles in the relationship between divergent thinking and academic achievement. First of all, one could expect a positive relationship between divergent thinking and academic achievement for students with strong verbal and visuo-spatial WM. Specifically, students who are good at divergent thinking might be able to translate this to high academic achievement only when they have strong verbal and visuo-spatial WM. Creativity is not always encouraged within education, and therefore thinking of original ideas can hinder academic performance when the focus lies predominantly on standardized testing (Sternberg, Citation2015). However, when children can store and manipulate verbal and visual information well, thinking of different ideas could aid their academic achievement (Benedek et al., Citation2014; Stolte et al., Citation2020; Takeuchi et al., Citation2011). Moreover, such a positive relation might also be possible for students who have a profile with high verbal but low visuo-spatial WM, or the other way around. Possibly, when students do well in one aspect of WM, they are able to compensate for low performance on the other aspect. Indeed, children who score well on visuo-spatial WM but low on verbal WM may compensate for this by relying predominantly on visual processing when confronted with academic tasks (Pickering & Gathercole, Citation2004). Similarly, children with such a discrepant WM profile might choose to focus on strong storage and manipulation of information in the format (i.e., verbal or visual) that suits them best. Using this information they will come to creative ideas that can support their academic achievement. If students are indeed able to compensate for low verbal or visuo-spatial WM with high skill in the other aspect, this might explain contradictory results from previous research on the relation between WM and divergent thinking, as the effect of each aspect of WM might depend on the level of skill in the other.
The current study
Using latent-profile analysis, different WM profiles can be distinguished. This study aims to fill a gap in the current literature by identifying WM profiles and relating these profiles to verbal and visual divergent thinking and academic achievement, whilst taking the certainty with which an individual can be placed in a certain profile into account. For academic achievement, the domains of reading comprehension and mathematics are investigated as these are relatively complex domains, requiring a combination of different skills (Gathercole et al., Citation2004). The following hypotheses will be tested: 1) Different profiles of verbal and visuo-spatial WM can be found, including balanced profiles with students who score low, high or average on both aspects of WM, and discrepant profiles with different levels of verbal and visuo-spatial WM, 2) Students with different WM profiles differ in verbal and visual divergent thinking, and 3) WM profiles moderate the relation between divergent thinking and academic achievement.
Method
Participants
Participants were 746 primary school students in grade 4 (71.8%) and 5 (28.2%) from regular schools across the Netherlands. Grade 4 and 5 students were selected because certain aspects of creative thinking, like the ability to produce unique ideas, are estimated to peak around this age (Kim, Citation2011). These students were dispersed through 40 classes from 25 schools. In total, 50.1% boys and 49.7% girls participated in the study. The students were between 8 and 12 years old (Mage = 10.10 years, SDage = 0.73) and included both typically developing children (91.5%), children with dyslexia (6.2%), dyscalculia (0.4%) and ADHD (1.9%).
Instruments
Divergent thinking
Visual divergent thinking was measured using the Test for Creative Thinking – Drawing Production (TCT-DP, Urban & Jellen, Citation1996), while verbal divergent thinking was measured using the subtest unusual uses of the Torrance Test of Creative Thinking (TTCT, Torrance, Citation2008). In the TCT-DP, students received a paper with different shapes. Students were explained that they had to finish an incomplete drawing that an artist had started. Visual divergent thinking of the students’ drawing was determined based on 14 elements: continuations, completion, new elements, connections with lines, connections that contribute to a theme, use of the element outside of the frame, drawing outside of the frame, perspective, humor, manipulation of the material, abstract elements, use of symbols, unconventional use of given fragments and speed (max. 15 minutes). Adding up the scores of these 14 elements resulted in a total divergent thinking score (with a maximum of 72), which was then transformed to a z-score. Test-retest reliability for the TCT-DP is between r = .62 and r = .70 (Urban & Jellen, Citation1996). Three raters with a background in educational psychology or pedagogy scored students’ responses. Interrater reliability for the TCT-DP in this study as indicated by the ICC was .81, which can be classified as good (Portney & Watkins, Citation2000). In the subtest unusual uses of the TTCT, students were asked to think of many possible uses for a cardboard box. Students’ ideas were scored on three subscales following the TTCT manual: Fluency (number of ideas), flexibility (amount of used categories of ideas) and originality. The TTCT manual specifies ideas that are non-original, and students receive a point for every idea that is not on this list. The originality score is the sum of these points. The scores on the three subscales were standardized, and added up to form one total divergent thinking score which was then transformed to a z-score. Again, three raters scored students’ responses. Interrater reliability for the TTCT in this study as indicated by the ICC was .97, .87 and .92 for fluency, flexibility and originality respectively. This can be classified as good to excellent (Portney & Watkins, Citation2000). Test-retest reliability for the TTCT ranges between r = .71 and r = .81 (Urban, Citation2005). Because the creative abilities measured in the unusual uses subtest of the TTCT as a verbal test differ from the abilities measured in the TCT-DP as its visual counterpart, we perceive the unusual uses subtest of the TTCT and TCT-DP as measures of verbal and visual divergent thinking (, ; Clements, Citation1991; Torrance, in Cramond et al., Citation2005; Willemsen et al., Citation2020).
Visuo-spatial and verbal WM
Visuo-spatial WM was measured with a visuo-spatial updating task called the lion game (Van de Weijer-Bergsma et al., Citation2015). The lion game takes 10 minutes. Students were shown lions in different colors in a 4 × 4 matrix and had to remember where a lion of a certain color was seen last. Difficulty increased throughout the task as students had to remember one more color in each level. A proportional correctness score was calculated per level, and averaged over the whole task. The lion game has shown an internal consistency of .86 to .90, and a test-retest reliability of r = .71 in previous research (Van de Weijer-Bergsma et al, Citation2015). Verbal WM was measured with a verbal backwards recall task called the monkey game (Van de Weijer-Bergsma et al., Citation2016). The test took around 10 minutes, and students were asked to remember words and click them in backwards order in a 3 × 3 matrix. Like the lion game, the monkey game increased in difficulty as students had to remember an increasing number of words. Again, a proportional correctness score was calculated per level, and averaged over the task. The monkey game has shown an internal consistency of .89 in previous research (Van de Weijer-Bergsma et al., Citation2016).
Academic achievement
For academic achievement, test scores on two key domains from the National Institute for Educational Measurement (CITO) were obtained: mathematics and reading comprehension. The mathematical test included 96 questions (open and multiple-choice) related to different mathematical domains like arithmetic, geometry, fractions and proportions. Some questions included basic numerical questions, while other questions were contextualized (e.g., calculating an amount that needs to be paid based on given information). The reading comprehension test consisted of 74 multiple-choice questions on five informal and 12 formal texts. An example of a question would be to match a text with a summary. These tests are part of the national Dutch student assessment system, which involves assessment of these skills at multiple moments throughout the year. For children in both grades, the most recent CITO scores were used, either from the end of grade 4 or the middle of grade 5. In recent years, a new version of the CITO (CITO 3.0) has been implemented, meaning that some schools used the old version while others used the new version. To correct for differences based on grade and version, and bring all scores to one scale, scores were equated. First, all CITO-scores were standardized for each version in each grade (leaving a score on two scales, the old and the new version). Next, each score on the old version was transformed to a score on the new version that was the same number of standard deviations above or below the mean of the group. Previous research showed good internal consistency for the CITO mathematics (KR-20 = .95, GLB =.97; Hop et al., Citation2016) and CITO reading comprehension (MAcc = .89–.88; Tomesen et al., Citation2018).
Procedure
Data were gathered by trained research assistants from June 2016 until March 2017 as part of a larger research project (Suijkerbuijk et al., Citation2018). Schools from the professional network of the researchers were invited to participate. Teachers of the participating classes received a gift card. Given the age of the participating children, their parents gave written informed consent in accordance with the Declaration of Helsinki and code of ethics by the National Ethics Council for Social and Behavioral Sciences. Principals of the schools participating in the study gave written consent. Of the initially approached parents of the primary school students, 98.8% signed active consent for participation in the study and access to academic achievement scores. The other 1.2% of students did not participate in the study. Prior to the data collection, ethical consent was obtained. During data collection, several individual tests (including the divergent thinking tests) were first administered plenary, taking around 90 minutes. Next, students were taken to a smaller room in groups of four or five to do individual WM tasks behind the computer. The computer tasks took around 45 minutes in total. The tests were conducted in one or two days, with a maximum of one week in between.
Data analyses
Prior to analyses, data were screened for errors, missing values, and a normal distribution. Extreme values that were inconsistent with other data were removed (i.e. more than two standard deviations removed from the mean), resulting in deletion of 20 cases. Visual inspection of histograms and boxplots, as well as the values for skewness and kurtosis (being between −1.96 and+1.96), indicated a normal distribution for all of the variables.To identify profiles of verbal and visuo-spatial WM, latent profile analysis (LPA) was performed using Mplus 8.0 (Muthén & Muthén, Citation2017; Vermunt & Magidson, Citation2002). LPA is a model-based technique that provides fit statistics as a result of the analysis. This allows for a comparison of different constellations of profiles, and choice of the model that fits the data best, which is a great advantage of the technique over non-model based techniques, such as cluster analysis (Vermunt & Magidson, Citation2002). Children with missing values on one of the two working memory tasks were automatically removed by Mplus, as it was not possible to determine a profile for these students (n = 165). This left 561 children to conduct profile analysis with. Regarding power, previous analyses have shown that for latent profile analysis, a sample size of around 500 is sufficient (Tein et al., Citation2013; Wolf et al., Citation2013).
For most variables, missing values concerned a maximum of around 5% of data, except for the mathematics and reading comprehension scores, which showed 23% missing values. Missing data were not missing completely at random (MCAR), as Little’s test was significant (χ2 (61) = 105,035., p < .01). However, missingness was shown to reflect a missing at random (MAR) pattern, as missing values were found to be related to other observed variables (Heitjan & Basu, Citation1996). Specifically, six Pearson Chi-square tests showed that for all variables, missingness was related to the specific class a child was in (χ2 = 474,00–693,68, p < .01). This was taken into account by using full maximum likelihood estimation (FIML) with maximum likelihood with robust standard errors (MLR) as an estimator, which yields the most effective and unbiased results in case of MAR. Besides, FIML leads to less convergence failure and lower type-1 error rates (Enders & Bandalos, Citation2001; Muthén & Asparaouhov, Citation2002). To determine the most optimal class solution, various models were run, estimating one to eight classes. These different solutions were compared using the Vuong Lo – Mendell–Rubin Likelihood Ratio Test (VLMRT), Lo – Mendell–Rubin Adjusted Likelihood Ratio Test (LMRT) and the Parametric Bootstrapped Likelihood Ratio Test (BLRT). These measures allow for a comparison between the current class solution and a solution with one less class. Furthermore, the Akaike information criteria (AIC) and (sample-size adjusted) Bayesian information criteria (BIC), as well as the entropy were inspected to determine the quality of the model. AIC and BIC should ideally be as low as possible, while entropy should be .80 or higher (Geiser, Citation2013). Solutions with small classes (<5% of the total sample) were also considered because small groups can represent meaningful exceptions that are of substantive interest in this study (Geiser, Citation2013). Simulation studies have shown that statistics like BLRT and BIC are able to identify the correct number of classes across various models (including ones with small classes) with high accuracy (Nylund et al., Citation2007). Therefore, we are confident that both bigger and smaller classes can be identified in a statically accurate manner.
After the LPA, the profiles that were found were related to verbal and visual divergent thinking using the three-step Bolck, Croon and Hagenaars (BCH) method in Mplus (Asparouhov & Muthén, Citation2014; Bolck et al, Citation2004). The three-step BCH method is a statistical method consisting of three steps: 1) definition of a measurement model and its parameter estimation, 2) computation of individual latent scores, 3) estimation of parameters from the structural model. A three-step BCH method takes the output file of the profile analysis containing class information, and corrects for the inaccuracy of class estimation before connecting class information to a distal outcome. Therefore, a three-step BCH method is sensitive to the fact that not each individual is placed within a class with similar accuracy (Asparouhov & Muthén, Citation2014). A BCH method was therefore preferred to for example a pseudo-class (PC) or three-step method, because it outperforms such methods in terms of bias when class membership is related to a continuous distal outcome (Asparouhov & Muthén, Citation2014). In this three-step BCH method, we corrected for effects of age and gender by including these as covariates. Models were compared using AIC, BIC and sample-size adjusted BIC, as chi-square values and noncomparative fit indices (e.g., RMSEA) are not given for a BCH-method.
Finally, the potential moderating role of WM profiles regarding the relationship between divergent thinking and academic achievement was examined by performing multiple group path analyses in Mplus with groups defined on the basis of profiles. Profile membership was determined by the profile for which the student showed the highest probability. Achievement scores for mathematics and reading comprehension formed the dependent variables, which were predicted by verbal and visual divergent thinking scores. Again, age and gender were included as covariates. Differences between students with different WM profiles were tested for the relationship of verbal and visual divergent thinking with mathematics and reading comprehension, using equality constraints. In these analyses, the parameters of the relations between divergent thinking measures and achievement measures were constrained to be equal across the groups, and the constraints were released one-by-one. These models were then compared using model fit statistics, including chi-square, standardized root mean square residual (SRMR), root mean square error of approximation (RMSEA) and comparative fit index and Tucker Lewis index (CFI/TLI). As cutoff scores, we used an SRMR of <.05, RMSEA of <.05, and CFI/TLI of >.95 to indicate good model fit (Geiser, Citation2013; Schermelleh-Engel et al., Citation2003). Furthermore, chi-square difference tests were computed to determine if models differed significantly from each other. If model fit significantly improved by releasing an equality constraint, the parameter was considered to differ across the WM profiles. To determine effect sizes for the relations between divergent thinking and academic achievement, unstandardized regression coefficients were transformed to standardized regression coefficients. In terms of effect size, these standardized coefficients can be interpreted as a correlation, where around .10 represents a small correlation, .30 a medium correlation and .50 a large correlation (Cohen, Citation1988).
Results
Descriptive statistics and correlations of verbal and visuo-spatial WM, verbal and visual divergent thinking and scores for mathematics and reading comprehension are given in . It stands out that both working memory measures are moderately positively correlated, and that mathematics and reading comprehension achievement are highly correlated, but that the two divergent thinking measures are not. Furthermore, both working memory measures are positively correlated with mathematics and reading comprehension, and verbal divergent thinking and visual divergent thinking are positively correlated with mathematics and reading comprehension respectively.
Table 1. Descriptive Statistics of Raw Test Scores.
Table 2. Correlations for WM, Divergent thinking and Academic Achievement .
Working memory profiles
Latent profile solutions containing one to eight classes were fit to the data. The model fit values for each profile solution are shown in . The VLMRT and LMRT were significant for the 2, 3, 4, 5 and 6-class solution, indicating that these models fitted better than models with one class less. The BLRT was significant for all of these, except the 6-class solution. The AIC, BIC, and SA-BIC also indicated that models with more classes fitted better, as their values were lower with more classes (values were lower up to five classes for BIC, and up to eight classes for AIC and SA-BIC). Note that AIC, BIC and SA-BIC values are negative. Thus, higher negative values indicate lower AIC, BIC or SA-BIC, and better model fit (Anderson & Burnham, Citation2004). However, despite good fit values, the entropy values indicated that only in a 2- and 4-class solution children could be placed into profiles with adequate accuracy. When comparing the two, it was determined that the 4-class solution fitted the model better because the AIC, BIC and SA-BIC were lower. Furthermore, substantive interpretation was easier for the 4-class solution than for the 2-class solution.
Table 3. Model Fit Values for the Different Profile Solutions.
The sample means and estimated class means are shown in . The classes were not quite equally divided over the sample, with 3.2% of the students in class 1, 3.2% in class 2, 22.9% in class 3, and 70.8% in class 4. Class 1 is named low verbal – medium visual, and represented a group of students scoring around average on visuo-spatial WM, while scoring low on verbal WM. This was the most discrepant class. Class 2 is named medium verbal – low visual and consisted of individuals who scored relatively low on both WM tasks, although there was still some discrepancy shown as verbal WM was clearly higher than visuo-spatial WM. Class 3 is named medium verbal – medium visual and represented individuals that scored close around the average on both WM tasks, while class 4 is named high verbal – high visual and represented individuals that scored above the average on both tasks. The labels low, medium and high were derived from a comparison of the mean class scores, and as such represent relative differences. For easier interpretation, see also , showing the class means.
Figure 1. Class means for verbal and visuo-spatial working memory, including standard error bars.
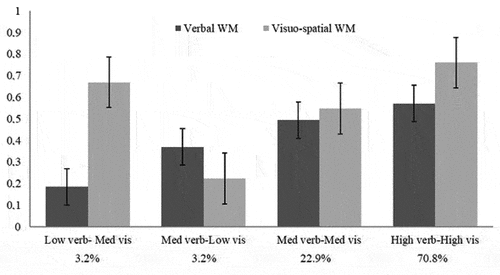
Table 4. Sample means (SD) and Estimated Class Means (SD) for Verbal and Visuo-Spatial WM.
To check whether profiles differed significantly in terms of WM, a one-way between groups analysis of variance (ANOVA) was run. For this ANOVA, students were assigned to the WM profile with the highest posterior probability. Significant differences were found between the profiles in visuo-spatial WM, F(3, 533) = 483.25, p < .001, η2 = .73. Next, post-hoc comparisons using the least significance difference (LSD) test were performed (Dodge, Citation2008), which compares different groups to each other in pairs to identify which group means are statistically different. LSD testing showed that all groups differed significantly from each other after the alpha level was corrected for multiple comparisons using Holm-Bonferroni correction (Holm, Citation1979). For verbal WM, the profiles were also found to differ significantly, F(3, 526) = 93.78, p = <.001, η2 = .35. Both partial eta-squared values show a large effect (Cohen, Citation1988). Again, post-hoc Games-Howell comparisons showed that all profiles differed significantly on verbal WM after applying Holm-Bonferroni correction, except for the low verbal-medium visual and the medium verbal-medium visual profile. For the post-hoc tests, LSD was used when equal variances could be assumed, and Games-Howell was used when equal variances could not be assumed (Allen & Bennett, Citation2010).
Working memory profile and relations with divergent thinking
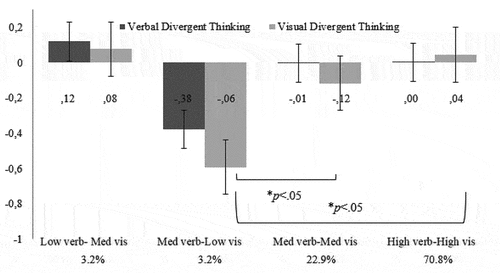
After obtaining the different profiles, students’ profiles were related to their verbal and visual divergent thinking using the three-step BCH method. A model was specified in which verbal and visual divergent thinking were compared across the profiles. The BCH method can estimate differences between classes on an outcome variable by comparing each class to every other class in a chi-square test. These chi-square tests showed that the profiles did not differ from each other in terms of verbal divergent thinking, but did differ in terms of visual divergent thinking. Specifically, students in the medium verbal – low visual profile showed significantly lower visual divergent thinking than students in the high verbal – high visual profile, χ2(3) = 9.51, p = .002, but also significantly lower visual divergent thinking than students in the medium verbal – medium visual profile, χ2(3) = 4.04, p = .044. The highest verbal and visual divergent thinking scores were found for the low verbal – medium visual profile. displays the mean scores on verbal and visual divergent thinking for every profile and indicates statistically significant differences.
Figure 2. Standardized mean scores (negative values indicate a score below average, positive values a score above average) for verbal and visual divergent thinking per class, including standard error bars.
Working memory profile as a moderator
In the last step of the analyses, it was examined whether the relationship of verbal and visual divergent thinking with mathematics and reading comprehension differed between students in the four WM profiles. First, four multigroup path models were specified, each with the four profiles as groups: one for verbal divergent thinking and mathematics, one for visual divergent thinking and mathematics, one for verbal divergent thinking and reading comprehension, and one for visual divergent thinking and reading comprehension. Thus, each time a model with one path was tested across four groups. The parameters of the relations between divergent thinking measures and achievement measures were constrained to be equal across the four groups, and the constraints were released one-by-one and the change in model fit was assessed. In this way, differences between the profiles for each relation between divergent thinking and achievement could be tested independent of possible differences in the other relations. For all four models, the differences in chi-square, SRMR, RMSEA and CFI/TLI were small (difference CFI 0–.56, TLI 0–.28, difference SRMR 0–.01, RMSEA 0.08). This was also reflected in the chi-square difference tests, which were not significant and therefore pointed to the most parsimonious model (i.e., no differences between the profiles) as the best model for all four paths between divergent thinking and academic achievement. Thus, models including equality constraints for all profiles were preferred. These constrained models all fitted the data well, with a non-significant chi-square, SRMR of <.05, RMSEA of <.05, and CFI/TLI of >.95. Both verbal and visual divergent thinking were positively related to mathematics and reading comprehension, and no moderating effect of WM profile was found.
Next, a combined model was specified including all relationships of verbal and visual divergent thinking with mathematics and reading comprehension in order to take into account the covariances between verbal and visual divergent thinking and mathematics and reading comprehension. Thus, one model with four paths was tested across four groups. No differences were allowed between any of the profiles in this model. This final model fitted the data well, χ2(12)5.90, p = .921, SRMR = 0.020, RMSEA = <.010, CFI = 1.00, TLI = 1.11 (Geiser, Citation2013; Schermelleh-Engel et al., Citation2003). Using this model, estimates for the relationship of verbal and visual divergent thinking with mathematics and reading comprehension were computed. The unstandardized model estimates for the whole model are shown in . Besides, standardized estimates per profile are shown between brackets as indication of effect size since unstandardized estimates give no information about the strength of the relation.
Figure 3. Unstandardized path coefficients for the combined path model (i.e., one model with four paths across the four groups). The model was fully constrained, thus allowing no differences between the groups. Standardized estimates are shown between brackets as an indication of effect size. Note. * p < .05, ** p < .01.Standardized estimates are shown as a range because the estimates are standardized per profile.
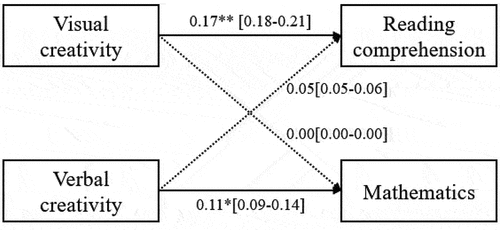
The association between verbal divergent thinking and mathematics was positive as well as the association between visual divergent thinking and reading comprehension. However, this was not found for verbal divergent thinking and reading comprehension. Also, visual divergent thinking was not significantly related to mathematics. It can be seen that most associations were small (around .10), except for the association between visual divergent thinking and reading comprehension, which is of medium strength.
Discussion
This study aimed to investigate which combinations of verbal and visuo-spatial WM can be found among primary school students, how these WM profiles are related to divergent thinking, and whether these profiles moderate the relationship between divergent thinking and academic achievement.
Working memory profile and divergent thinking
Four profiles could be distinguished. Two large groups of students were found with relatively balanced WM profiles: medium verbal- medium visual and high verbal-high visual. Moreover, two smaller groups of students were found with more discrepant profiles: low verbal-medium visual and medium verbal-low visual. The profiles we found were consistent with previous research on WM profiles by Kell and colleagues (Kell et al., Citation2013) and Pickering and Gathercole (Citation2004), that showed mostly balanced profiles, regardless of the level of WM.
However, in line with previous research, we also found a smaller subset of children with a more discrepant profile. Despite the fact that this discrepant profile is identified in only a small group of children, this may actually be a very interesting group of children because of the discrepant nature of their WM profile. This finding illustrates that WM is not a unitary construct, but verbal and visuo-spatial WM represent separate systems (Jarvis & Gathercole, Citation2003). Children may demonstrate different performance in each system, which also underlines the importance of investigating within-person WM differences.
Regarding divergent thinking, the profiles differed in visual, but not verbal divergent thinking. For visual divergent thinking, students in the medium verbal – low visual profile showed significantly lower visual divergent thinking than students in the high – verbal high visual profile and students in the medium verbal – medium visual profile. This finding seems to indicate that good visual WM skill can facilitate visual divergent thinking. Likely, updating the visuo-spatial working memory with information helps children to generate different ideas, as it facilitates a range of information from which ideas can be formed (Benedek et al., Citation2014). More specifically, it might be that higher visuo-spatial WM enables students to activate more visual objects mentally (Palmiero et al., Citation2010). This would lead to a higher flexibility, which could allow students to produce a drawing which for example contains more new elements or use of elements in a new way, thus resulting in a higher visual divergent thinking score. Importantly, students do not seem to be able to compensate for a weakness in visuo-spatial WM with verbal WM when it comes to visual divergent thinking, as students with higher visuo-spatial WM scores also demonstrate higher visual divergent thinking. This is in line with a study by Palmiero et al., (Citation2010) that found visual divergent thinking to depend mostly on visuo-spatial WM.
On the other hand, Palmiero et al., (Citation2010) found that verbal divergent thinking was sensitive to both verbal and visuo-spatial WM. However, we found no differences between WM profiles in verbal divergent thinking performance. A possible explanation for this finding can be found in the way that participants mentally manipulate information when presented with creativity tasks. Lu et al. (Citation2022) suggest that upon seeing a visual creativity task, visual information is mentally manipulated to generate new ideas using visuospatial representations. When confronted with a verbal creativity task, participants might first shortly use verbal WM to semantically encode information. However, this is likely followed by the formation of a visual image of the presented information. Thus, higher visuo-spatial WM is an important force driving development of visual divergent thinking, while verbal divergent thinking might depend on more diffuse characteristics. These diffuse characteristics might not have been captured completely using a WM profile, explaining why we did not find differences in verbal divergent thinking performance for different WM profiles.
The relation between divergent thinking and academic achievement
As mentioned previously, no moderation effect of WM profile was found for the relation between divergent thinking and academic achievement. Regarding the absence of this moderation effect, both substantive and methodological explanations can be given. From a substantive point of view, it might be that the relation between divergent thinking and academic achievement is moderated by different cognitive skills, such as executive functions. Executive functions can be defined as “basic cognitive processes that control thought and action” (Benedek et al., Citation2014, p. 74). Examples of executive functions are inhibition, shifting and cognitive flexibility (McCabe et al,, Citation2010). In this study, we focused on WM because strong relations have been found between WM, divergent thinking and measures of academic achievement (Benedek et al, Citation2014; Nouwens et al., Citation2016; Stolte et al., Citation2020; Van der Ven, Boom et al., Citation2012). If one focuses on academic achievement specifically, one meta-analysis finds WM to be the executive function that correlates most strongly with achievement (Cortés Pascual et al., Citation2019), while a different meta-analysis finds no difference between the strength of the relation with academic achievement for different executive functions (Jacob & Parkinson, Citation2015). Either way, more than one executive function seems to play a role. Thus, one might consider that an executive function profile, or at least multiple executive functions, could affect the relation between divergent thinking and academic achievement. Researching various executive functions simultaneously likely allows one to explain a larger part of the variance in the relationship between divergent thinking and academic achievement. Furthermore, other cognitive characteristics might (also) moderate the relationship between divergent thinking and academic achievement, such as intelligence. Although results are mixed, some studies suggest that a certain base-level intelligence is necessary to come to creative ideas, above which the influence of intelligence becomes smaller (Jauk et al., Citation2013). Therefore, students with a relatively low intelligence probably show a stronger relationship between divergent thinking and academic achievement, because they can depend less on their intelligence to perform well on either divergent thinking or academic achievement tasks. Methodologically, it could also be that the profiles were too unequal in size to demonstrate differences in the relationship between divergent thinking and academic achievement. Previous research has stressed the importance of WM for divergent thinking and academic achievement, but more research is needed to unravel how WM is positioned in this relationship, especially regarding verbal and visual divergent thinking (Alloway & Alloway, Citation2010).
However, it was found that verbal and visual divergent thinking were significantly related to academic achievement. Notably, verbal divergent thinking predicted mathematics, while visual divergent thinking predicted reading comprehension, which is an interesting finding that (partly) differs from previous research. Statistically, this finding might be related to the fact that mathematics and reading comprehension achievement were highly correlated in our sample, and we tested their associations with divergent thinking in a model in which we controlled for all interrelations between aspects. Furthermore, as for mathematics, previous research has found both verbal divergent thinking and visual divergent thinking to be predictive of mathematics achievement, specifically problem solving (Yuan & Sriraman, Citation2011). In contrast, only verbal divergent thinking was found to predict mathematics in this study. Visual divergent thinking in mathematics enables children to generate numerous unique solutions to a mathematical problem (Pitta-Pantazi et al., Citation2013), while verbal skills allow for better solving of mathematical problems in different contexts (Hickendorff, Citation2013). The test that was used to measure mathematics is a standardized test of achievement, which might mostly call upon problem solving in different contexts, and thus more so on verbal skills like verbal divergent thinking. Furthermore, many of the problems in the mathematics test are presented in a verbal format. This might explain why only verbal divergent thinking was found to be predictive of mathematics achievement. Future research should investigate this assumption, and investigate the link between verbal and visual divergent thinking and achievement as a function of the tests used to measure achievement.
In terms of reading comprehension, no previous research to our knowledge has investigated verbal and visual divergent thinking in relation to achievement. Although one might expect an effect from verbal divergent thinking, based on the importance of verbal skills for reading comprehension (Cain, Oakhill, & Bryant, Citation2004), no such effect was found. Divergent thinking can be beneficial for reading comprehension, because it helps students to notice, connect and integrate knowledge elements (Karwowski, Citation2017). However, rather than doing this verbally, most students might have done this visually. Reading comprehension skill is linked to one’s capacity to imagine what was read (i.e. make a visual representation in the mind), as a mental model is made of the text (Glenberg, Citation2011; Woolley, Citation2011). Therefore, visual divergent thinking might be related to reading comprehension as it facilitated integrating different elements through visual imagination.
Implications
The findings of the present study have several implications for educational research and practice. As for educational research, this study demonstrated the benefits of a person-centered approach, which allows for investigating individual differences in more detail by comparing constructs across and within students. By investigating verbal and visuo-spatial WM simultaneously in relation to divergent thinking and academic achievement, this study demonstrated the multidimensionality of WM as a cognitive construct. As such, this study can serve as input for future research on individual differences in WM, divergent thinking and academic achievement. As for educational practice, determining a student’s WM profile could provide valuable information that can be used to direct classroom practice. Unexpected failure in school could be explained by a deficit in a student’s WM capacity, irrespective of their intellectual functioning (Maehler & Schuchardt, Citation2016). Pickering and Gathercole (Citation2004) recommend reducing WM load for these students, for example by using external memory support or frequently repeating instructions. By determining a student’s WM profile, it becomes apparent whether WM load should be reduced overall, or whether a student has specific WM strengths that could be capitalized on. Moreover, students with different WM profiles could also differ in terms of their divergent thinking capabilities. We found differences in visual divergent thinking performance for students with different WM profiles. Kell, Lubinski, Benbow, and Steiger (Citation2013) showed that such creative differences could remain until later in life and have an effect on someone’s career (e.g., affecting the chance of securing a patent). Thus, being aware of WM profile provides the opportunity to get more insight into fields a student might excel at, as well as chances for growth. Furthermore, we found that divergent thinking is positively associated with achievement. This finding is correlational in nature, and thus we cannot assume that an increase in divergent thinking leads to an increase in academic achievement. However, several studies have shown that students’ academic performance may benefit from encouraging divergent thinking in school (Gajda et al., Citation2017; Niaz et al., Citation2000). If teachers want do want to promote verbal or visual divergent thinking, they can for example have students generate slogans for advertisements and write these down or use visual imagery and encouraging students to form a visual mental image of the task at hand (Fink et al., Citation2018; Palmiero, Nori, & Piccardi, Citation2016).
Limitations and future research
Future research needs to investigate exactly how WM profiles can affect divergent thinking and academic achievement. In the current study, sample sizes for different profiles were unequal, with two small profile groups. Although the total sample was adequately powerful for profile analysis, future research might want to use a larger sample to further explore characteristics of unique profiles. Such a sample would also allow for multilevel analysis, which could shed light on how distribution of WM profiles across classes and schools affect relationships with divergent thinking and academic achievement. Another limitation of the current study is its cross-sectional design as it does not allow us to draw firm conclusions about causality like an experimental or longitudinal design does. Thus, we cannot be certain that the differences we found in visual divergent thinking are the result of students’ WM profile. However, based on previous research it is more likely that WM affects divergent thinking and academic achievement than the other way around (Alloway & Alloway, Citation2010;Gathercole & Pickering, Citation2000; Gathercole et al., Citation2004; St.Clair-Thompson & Gathercole, Citation2006; Takeuchi et al., Citation2011).
A different limitation of the current study concerns the “impurity problem,” which refers to the fact that measures of executive functions, including WM, measure not only the intended construct, but also lower-level cognitive abilities (Miyake et al., Citation2000; Van der Ven et al., Citation2011). To avert this effect, it is recommended to use several measures for executive functions that are supposed to differ in the lower-level abilities they measure (Van der Ven et al., Citation2012). However, in this study verbal and visuo-spatial WM were measured with one task and therefore it cannot be checked whether lower-level abilities (i.e. non-WM abilities), such as visual search efficiency or processing speed, might have influenced performance. Although the WM tasks used in this study have shown good validity (Van de Weijer-Bergsma et al, Citation2016; Van de Weijer-Bergsma et al., Citation2015), the difference we found between WM might be partly based on differences in non-WM abilities. Future research that looks at WM profiles might want to compose profiles based on several WM tasks. Lastly, a limitation of this study is that the mathematics task we used contained predominantly verbal items as opposed to visual items, which might explain why only verbal divergent thinking was found to be related to mathematics achievement.
In conclusion, the aim of this study was to shed light on individual differences in WM and divergent thinking and how these can impact the relationship with academic achievement by taking a person-centered approach. This study was one of the first to investigate profiles of verbal and visuo-spatial WM, and how they can affect divergent thinking and academic achievement. As such, this research can serve as input for a wider line of research on individual differences, for example research that tries to unravel how individual differences interact with the instruction environment. This study has shown that it is important to be mindful of differences in verbal and visual WM and divergent thinking amongst students, as well as the multidimensionality of these constructs. Lastly, the findings of this study indicate that these characteristics should not be investigated in isolation, but that WM, divergent thinking and academic achievement are important factors to study simultaneously.
Disclosure statement
No potential conflict of interest was reported by the authors.
References
- Ackerman, P. L., Beier, M. E., & Boyle, M. O. (2005). Working memory and intelligence: The same or different constructs? Psychological Bulletin, 131(1), 30–60. doi:10.1037/0033-2909.131.1.30
- Allen, P., & Bennett, K. (2010). PASW Statistics by SPSS: A practical guide. Cengage.
- Alloway, T. P., & Alloway, R. G. (2010). Investigating the predictive roles of working memory and IQ in academic attainment. Journal of Experimental Child Psychology, 106(1), 20–29. doi:10.1016/j.jecp.2009.11.003
- Alloway, T. P., Gathercole, S. E., & Pickering, S. J. (2006). Verbal and visuospatial short term and working memory in children: Are they separable? Child Development, 77(6), 1698–1716. doi:10.1111/j.1467-8624.2006.00968.x
- Anderson, D., & Burnham, K. (2004). Model selection and multi-model inference. Springer.
- Ansburg, P. I., & Hill, K. (2003). Creative and analytic thinkers differ in their use of attentional resources. Personality and Individual Differences, 34(7), 1141–1152. doi:10.1016/S0191-8869(02)00104-6
- Asparouhov, T., & Muthén, B. (2014). Auxiliary variables in mixture modelling: 3-step approaches using Mplus. Structural Equation Modelling: A Multidisciplinary Journal, 21(3), 329–341. doi:10.1080/10705511.2014.915181
- Baddeley, A. (1992). Working memory. Science, 255(5044), 556–559. doi:10.1126/science.1736359
- Baddeley, A. (2000). The episodic buffer: A new component of working memory? Trends in Cognitive Sciences, 4(11), 417–423. doi:10.1016/S1364-6613(00)01538-2
- Baddeley, A. (2003). Working memory: Looking back and looking forward. Nature Reviews Neuroscience, 4(10), 829–839. doi:10.1038/nrn1201
- Barbot, B., Besancon, M., & Lubart, T. I. (2015). Creative potential in educational settings: Its nature, measure, and nurture. Education 3–13, 43(3), 371–381. doi:https://doi.org/10.1080/03004279.2015.1020643
- Bayliss, D. M., Jarrold, C., Gunn, D. M., & Baddeley, A. D. (2003). The complexities of complex span: Explaining individual differences in working memory in children and adults. Journal of Experimental Psychology General, 132(1), 71–92. doi:10.1037/0096-3445.132.1.71
- Beghetto, R. A. (2016). Creative learning: A fresh look. Journal of Cognitive Education and Psychology, 15(1), 6–23. doi:10.1891/1945-8959.15.1.6
- Benedek, M., Jauk, E., Sommer, M., Arendasy, M., & Neubauer, A. C. (2014). Intelligence, creativity, and cognitive control: The common and differential involvement of executive functions in intelligence and creativity. Intelligence, 46, 73–83. doi:10.1016/j.intell.2014.05.007
- Bolck, A., Croon, M., & Hagenaars, J. (2004). Estimating latent structure models with categorical variables: One-step versus three-step estimators. Political Analysis, 12(1), 3–27. doi: 10.1093/pan/mph001
- Brophy, D. R. (2001). Comparing the attributes, activities, and performance of divergent, convergent, and combination thinkers. Creativity Research Journal, 13(3–4), 439–455. doi:10.1207/S15326934CRJ1334_20
- Cain, K., Oakhill, J., & Bryant, P. (2004). Children’s reading comprehension ability: Concurrent prediction by working memory, verbal ability, and component skills. Journal of Educational Psychology, 96(1), 31–42. doi:10.1037/0022-0663.96.1.31
- Chooi, W. T. (2012). Working memory and intelligence: A brief review. Journal of Educational and Developmental Psychology, 2(2), 42. doi:10.5539/jedp.v2n2p42
- Clapham, M. M. (2004). The convergent validity of the Torrance tests of creative thinking and divergent thinking interest inventories. Educational and Psychological Measurement, 64(5), 828–841. doi:10.1177/0013164404263883
- Clements, D. H. (1991). Enhancement of creativity in computer environments. American Educational Research Journal, 28(1), 173–187. doi:10.3102/00028312028001173
- Cohen, J. (1988). Statistical power analysis for the behavioral sciences (2nd ed.). Erlbaum.
- Collard, P., & Looney, J. (2014). Nurturing creativity in education. European Journal of Education, 49(3), 348–364. doi:10.1111/ejed.12090
- Cortés Pascual, A., Moyano Muñoz, N., & Quilez Robres, A. (2019). The relationship between executive functions and academic performance in primary education: Review and meta-analysis. Frontiers in Psychology, 10(1582), 1–18. doi:10.3389/fpsyg.2019.01582
- Cramond, B., Matthews-Morgan, J., Bandalos, D., & Zuo, L. (2005). A report on the 40-year follow-up of the Torrance tests of creative thinking: Alive and well in the new millennium. The Gifted Child Quarterly, 49(4), 283–291. doi:10.1177/001698620504900402
- Crockett, L., Moilanen, K., Raffaelli, M., & Randall, B. (2006). Psychological profiles and adolescent adjustment: A person-centered approach. Development and Psychopathology, 18(1), 195–214. doi:10.1017/S0954579406060111
- Dodge, Y. (2008). The concise encyclopedia of statistics: Least significant difference test. doi:10.1007/978-0-387-32833-1
- Enders, C. K., & Bandalos, D. L. (2001). The relative performance of full information maximum likelihood estimation for missing data in structural equation models. Structural Equation Modeling, 8(3), 430–457. doi:10.1207/S15328007SEM0803_5
- Fink, A., Benedek, M., Koschutnig, K., Papousek, I., Weiss, E. M., Bagga, D., & Schöpf, V. (2018). Modulation of resting-state network connectivity by verbal divergent thinking training. Brain and Cognition, 128, 1–6. doi:10.1016/j.bandc.2018.10.008
- Gajda, A., Karwowski, M., & Beghetto, R. A. (2017). Creativity and academic achievement: A meta-Analysis. Journal of Educational Psychology, 109(2), 269–299. doi:10.1037/edu0000133
- Gathercole, S. E., & Pickering, S. J. (2000). Working memory deficits in children with low achievements in the national curriculum at 7 years of age. The British Journal of Educational Psychology, 70(2), 177–194. doi:10.1348/000709900158047
- Gathercole, S. E., Pickering, S. J., Knight, C., & Stegmann, Z. (2004). Working memory skills and educational attainment: Evidence from national curriculum assessments at 7 and 14 years of age. Applied Cognitive Psychology, 18(1), 1–16. doi:https://doi.org/10.1002/acp.934
- Geiser, C. (2013). Data analysis with Mplus. New York, NY: The Guildford Press.
- Glenberg, A. M. (2011). How reading comprehension is embodied and why that matters. International Electronic Journal of Elementary Education, 4(1), 5–18. http://www.iejee.com/index.php/IEJEE/article/download/210/206
- Grigorenko, E. L., Jarvin, L., Diffley, R., Goodyear, J., Shanahan, E. J., & Sternberg, R. J. (2009). Are SSATs and GPA enough? A theory-based approach to predicting academic success in secondary school. Journal of Educational Psychology, 101(4), 964–981. doi:10.1037/a0015906
- Habibollah, N., Rohani, A., Tengku Aizan, H., Jamaluddin, S., & Kumar, V. (2010). Relationship between creativity and academic achievement: A study of gender differences. Journal of American Science, 6(1), 181–190.
- Heitjan, D. F., & Basu, S. (1996). Distinguishing “missing at random” and “missing completely at random”. The American Statistician, 50(3), 207–213. doi:10.1080/00031305.1996.10474381
- Hickendorff, M. (2013). The language factor in elementary mathematics assessments: Computational skills and applied problem solving in a multidimensional IRT framework. Applied Measurement in Education, 26(4), 253–278. doi:10.1080/08957347.2013.824451
- Holm, S. (1979). A simple sequential rejective multiple test procedure. Scandinavian Journal of Statistics, 6(2), 65–70. https://www.jstor.org/stable/pdf/4615733.pdf
- Hop, M., Scheltens, F., Janssen, J., & Engelen, R. (2016). Wetenschappelijke Verantwoording Rekenen-Basisbewerkingen voor groep 3 tot en met 8 van het primair onderwijs [Scientific justification of mathematics-basic calculations for Grade 1 to 6]. Cito.
- Jacob, R., & Parkinson, J. (2015). The potential for school-based interventions that target executive function to improve academic achievement: A review. Review of Educational Research, 85(4), 512–552. doi:10.3102/0034654314561338
- Jarvis, H. L., & Gathercole, S. E. (2003). Verbal and non-verbal working memory and achievements on national curriculum tests at 11 and 14 years of age. Educational and Child Psychology, 20(3), 123–140. https://www.researchgate.net/publication/250928054Therelationshipbetweenworkingmemoryandearlywritingatthewordsentenceandtextlevel#page=125
- Jauk, E., Benedek, M., Dunst, B., & Neubauer, A. C. (2013). The relationship between intelligence and creativity: New support for the threshold hypothesis by means of empirical breakpoint detection. Intelligence, 41(4), 212–221. doi:https://doi.org/10.1016/j.intell.2013.03.003
- Karwowski, M. (2017). Subordinated and rebellious creativity at school. In R. A. Beghetto & B. Sriraman (Eds.), Creative contradictions in education (pp. 89–113). Springer.
- Karwowski, M., & Soszynski, M. (2008). How to develop creative imagination?: Assumptions, aims and effectiveness of role play training in creativity (RPTC). Thinking Skills and Creativity, 3(2), 163–171. doi:10.1016/j.tsc.2008.07.001
- Kell, H. J., Lubinski, D., Benbow, C. P., & Steiger, J. H. (2013). Creativity and technical innovation spatial ability’s unique role. Psychological Science, 24(9), 1831–1836. doi:10.1177/0956797613478615
- Kim, K. H. (2005). Can only intelligent people be creative? A meta-analysis. Journal of Secondary Gifted Education, 16(2–3), 57–66. doi:10.4219/jsge-2005-473
- Kim, K. H. (2011). The creativity crisis: The decrease in creative thinking scores on the Torrance tests of creative thinking. Creativity Research Journal, 23(4), 285–295. doi:10.1080/10400419.2011.627805
- Kozhevnikov, M., Kozhevnikov, M., Yu, C. J., & Blazhenkova, O. (2013). Creativity, visualization abilities, and visual cognitive style. The British Journal of Educational Psychology, 83(2), 196–209. doi:10.1111/bjep.12013
- Kroesbergen, E. H., & Schoevers, E. M. (2017). Creativity as predictor of mathematical abilities in fourth graders in addition to number sense and working memory. Journal of Numerical Cognition, 3(2), 417–440. doi:10.5964/jnc.v3i2.63
- Leikin, R. (2009). Exploring mathematical creativity using multiple solution tasks. In R. Leikin, A. Berman, & B. Koichu (Eds.), Creativity in mathematics and the education of gifted students (pp. 129–145). Rotterdam, the Netherlands: Sense Publishers.
- Lin, W. L., & Lien, Y. W. (2013). The different role of working memory in open-ended versus closed-ended creative problem solving: A dual-process theory account. Creativity Research Journal, 25(1), 85–96. 10.1080/10400419.2013.752249.
- Liu, L. M. (2007). The relationships between creativity, drawing ability, and visual/spatial intelligence: A study of Taiwan’s third-grade children. Asia Pacific Education Review, 8(3), 343–352. doi:10.1007/BF03026464
- Lu, R., Zhang, Y., Bao, N., Su, M., Zhang, X., & Shi, J. (2022). Visuospatial, rather than verbal working memory capacity plays a key role in verbal and figural creativity. Thinking & Reasoning, 28(1), 29–60. doi:10.1080/13546783.2021.1911848
- Maehler, C., & Schuchardt, K. (2016). The importance of working memory for school achievement in primary school children with intellectual or learning disabilities. Research in Developmental Disabilities, 58, 1–8. doi: 10.1016/j.ridd.2016.08.007
- McCabe, D. P., Roediger, H. L., III, McDaniel, M. A., Balota, D. A., & Hambrick, D. Z. (2010). The relationship between working memory capacity and executive functioning: Evidence for a common executive attention construct. Neuropsychology, 24(2), 222–243. doi:10.1037/a0017619
- Melby-Lervåg, M., Redick, T. S., & Hulme, C. (2016). Working memory training does not improve performance on measures of intelligence or other measures of “far transfer” evidence from a meta-analytic review. Perspectives on Psychological Science, 11(4), 512–534. doi:10.1177/1745691616635612
- Miyake, A., Friedman, N. P., Emerson, M. J., Witzki, A. H., Howerter, A., & Wager, T. D. (2000). The unity and diversity of executive functions and their contributions to complex ‘‘frontal lobe’’ tasks: A latent variable analysis. Cognitive Psychology, 41(1), 49–100. doi:10.1006/cogp.1999.0734
- Muthén, B., & Asparaouhov, T. (2002). Using Mplus Monte Carlo simulations in practice: A note on non-normal missing data in latent variable models. http://www.statmodel.com/download/webnotes/mc2.pdf
- Muthén, B. O., & Muthén, L. K. (2017). Mplus (8.0). Author.
- Niaz, M., Núñez, G. S., & Pineda, I. R. (2000). Academic performance of high school students as a function of mental capacity, cognitive style, mobility-fixity dimension, and creativity. The Journal of Creative Behavior, 34(1), 18–29. doi:https://doi.org/10.1002/j.2162-6057.2000.tb01200.x
- Nouwens, S., Groen, M. A., & Verhoeven, L. (2016). How storage and executive functions contribute to children’s reading comprehension. Learning and Individual Differences, 47, 96–102. doi:10.1016/j.lindif.2015.12.008
- Nylund, K. L., Asparouhov, T., & Muthén, B. O. (2007). Deciding on the number of classes in latent class analysis and growth mixture modeling: A monte carlo simulation study. Structural Equation Modeling, 14(4), 535–569. doi:10.1080/10705510701575396
- Palmiero, M., Nakatani, C., Raver, D., Belardinelli, M. O., & van Leeuwen, C. (2010). Abilities within and across visual and verbal domains: How specific is their influence on creativity? Creativity Research Journal, 22(4), 369–377. doi:10.1080/10400419.2010.523396
- Palmiero, M., Nori, R., & Piccardi, L. (2016). Visualizer cognitive style enhances visual creativity. Neuroscience Letters, 615, 98–101. doi:10.1016/j.neulet.2016.01.032
- Pickering, S. J., & Gathercole, S. E. (2004). Distinctive working memory profiles in children with special educational needs. Educational Psychology, 24(3), 393–408. doi:10.1080/0144341042000211715
- Pitta-Pantazi, D., Sophocleous, P., & Christou, C. (2013). Spatial visualizers, object visualizers and verbalizers: Their mathematical creative abilities. ZDM, 45(2), 199–213. doi:https://doi.org/10.1007/s11858-012-0475-1
- Popov, A. (1992). Creativity and reading comprehension. The Journal of Creative Behavior, 26(3), 206–212. doi:10.1002/j.2162-6057.1992.tb01177.x
- Portney, L. G., & Watkins, M. P. (2000). Foundations of clinical research: Applications to practice. Prentice Hall.
- Ritchie, S. J., Luciano, M., Hansell, N. K., Wright, M. J., & Bates, T. C. (2013). The relationship of reading ability to creativity: Positive, not negative associations. Learning and Individual Differences, 26, 171–176. doi:10.1016/j.lindif.2013.02.009
- Runco, M. A. (2010). Divergent thinking, creativity, and ideation. In Eds., J. C. Kaufman & R. J. Sternberg The Cambridge handbook of creativity (pp. 413–446). doi:10.1017/CBO9780511763205.026
- Runco, M. A., & Jaeger, G. J. (2012). The standard definition of creativity. Creativity Research Journal, 24(1), 92–96. doi:10.1080/10400419.2012.650092
- Ruscio, J., Whitney, D. M., & Amabile, T. M. (1998). Looking inside the fishbowl of creativity: Verbal and behavioral predictors of creative performance. Creativity Research Journal, 11(3), 243–263. doi:10.1207/s15326934crj1103_4
- Schacter, J., Thum, Y. M., & Zifkin, D. (2006). How much does creative teaching enhance elementary school students’ achievement? The Journal of Creative Behavior, 40(1), 47–72. doi:10.1002/j.2162-6057.2006.tb01266.x
- Schermelleh-Engel, K., Moosbrugger, H., & Muller, H. (2003). Evaluating the fit of structural equation models: Test of significance and descriptive goodness-of-fit measures. Methods of Psychological Research Online, 8(2), 23–74.
- Shaheen, R. (2010). Creativity and education. Creative Education, 1(3), 166–169. doi:10.4236/ce.2010.13026
- Silvia, P. J., Kaufman, J. C., & Pretz, J. E. (2009). Is creativity domain-specific? Latent class models of creative accomplishments and creative self-descriptions. Psychology of Aesthetics, Creativity, and the Arts, 3(3), 139–148. doi:10.1037/a0014940
- St.Clair-Thompson, H. L., & Gathercole, S. E. (2006). Executive functions and achievements in school: Shifting, updating, inhibition, and working memory. The Quarterly Journal of Experimental Psychology, 59(4), 745–759. doi:10.1080/17470210500162854
- Sternberg, R. J. (2015). Teaching for creativity: The sounds of silence. Psychology of Aesthetics, Creativity, and the Arts, 9(2), 115. doi:10.1037/aca0000007
- Stolte, M., García, T., Van Luit, J. E., Oranje, B., & Kroesbergen, E. H. (2020). The contribution of executive functions in predicting mathematical creativity in typical elementary school classes: a twofold role for updating. Journal of Intelligence, 8(2), 26. doi:10.3390/jintelligence8020026
- Suijkerbuijk, A. M., Jonker, H., Van den Bos, K. P., & Kroesbergen, E. H. (2018). Image thinking: A study into visual and verbal thinking preferences and skills among children from grades 4 and 5. Pedagogische Studiën, 95, 1–19. https://pedagogischestudien.nl/search?identifier=6998330d-78ee-41ef-a627-14f2446d4c87
- Takeuchi, H., Taki, Y., Hashizume, H., Sassa, Y., Nagase, T., Nouchi, R., & Kawashima, R. (2011). Failing to deactivate: The association between brain activity during a working memory task and creativity. Neuroimage, 55(2), 681–687. doi:https://doi.org/10.1016/j.neuroimage.2010.11.052
- Tein, J., Coxe, S., & Cham, H. (2013). Statistical power to detect the correct number of classes in latent profile analysis. Structural Equation Modelling: A Multidisciplinary Journal, 20(4), 640–657. doi:10.1080/10705511.2013.824781
- Tomesen, M., Engelen, R., & Hiddink, L. (2018). Wetenschappelijke Verantwoording Begrijpend Lezen 3.0 voor Groep 7 [Scientific justification of reading comprehension grade 7]. Cito.
- Torrance, E. P. (2008). Torrance Test of Creative Thinking. Scholastic Testing Service.
- Urban, K. K. (2005). Assessing creativity: The test for creative thinking-drawing production (TCT-DP). International Education Journal, 6(2), 272–280. https://files.eric.ed.gov/fulltext/EJ854980.pdf
- Urban, K. K., & Jellen, H. G. (1996). Test for Creative Thinking– Drawing Production. Swets & Zeitlinger.
- Van der Ven, S. H., Boom, J., Kroesbergen, E. H., & Leseman, P. P. (2012). Microgenetic patterns of children’s multiplication learning: Confirming the overlapping waves model by latent growth modeling. Journal of Experimental Child Psychology, 113(1), 1–19. doi:10.1016/j.jecp.2012.02.001
- Van der Ven, S. H. G., Kroesbergen, E. H., Boom, J., & Leseman, P. P. M. (2011). The development of executive functions and early mathematics: A dynamic relationship. The British Journal of Educational Psychology, 82(1), 100–119. doi:10.1111/j.2044-8279.2011.02035.x
- Van de Weijer-Bergsma, E., Kroesbergen, E. H., Jolani, S., & Van Luit, J. E. H. (2016). The Monkey game: A computerized verbal working memory task for self-reliant administration in primary school children. Behavior Research Methods, 48(2), 756–771. doi:https://doi.org/10.3758/s13428-015-0607-y
- Van de Weijer-Bergsma, E., Kroesbergen, E. H., Prast, E., & Van Luit, J. E. H. (2015). Validity and reliability of an online visual–spatial working memory task for self-reliant administration in school-aged children. Behavior Research Methods, 47(3), 708–719. doi:10.3758/s13428-014-0469-8
- Vermunt, J. K., & Magidson, J. (2002). Latent class cluster analysis. In J. A. Hagenaars & A. McCutcheon (Eds.), Applied latent class analysis (pp. 89–106). Cambridge University Press.
- Von Eye, A., & Bergman, L. (2003). Research strategies in developmental psychopathy: Dimensional identity and the person-oriented approach. Development and Psychopathy, 15(3), 553–580. doi:10.1017/S0954579403000294
- Wiley, J., & Jarosz, A. F. (2012). Working memory capacity, attentional focus, and problem solving. Current Directions in Psychological Science, 21(4), 258–262. doi:10.1177/0963721412447622
- Willemsen, R. H., Schoevers, E. M., & Kroesbergen, E. H. (2020). The structure of creativity in primary education: An empirical confirmation of the amusement park theory. The Journal of Creative Behavior, 54(4), 1–14. doi:10.1002/jocb.411
- Wolf, E. J., Harrington, K. M., Clark, S. L., & Miller, M. W. (2013). Sample size requirements for structural equation models: An evaluation of power, bias, and solution property. Educational and Psychological Measurement, 73(6), 913–934. doi:10.1177/0013164413495237
- Woolley, G. (2011). Reading comprehension. In G. Woolley (Ed.), Reading Comprehension (pp. 15–34). Springer.
- Yuan, X., & Sriraman, B. (2011). An exploratory study of relationships between students’ divergent thinking and mathematical problem-posing abilities. In B. Sriraman & K. Lee (Eds.), The elements of creativity and giftedness in mathematics (pp. 5–28). Sense Publishers.