
ABSTRACT
Associative thinking plays a major role in creativity, as it involves the ability to link distant concepts. Yet, the neural mechanisms allowing to combine distant associates in creative thinking tasks remain poorly understood. We investigated the whole-brain functional connectivity patterns related to combining remote associations for creative thinking. Using a connectome predictive modeling approach, we examined whole-brain functional connectivity patterns related to connecting close and distant remote associates in the Combination Association Task (CAT). Brain connectivity networks predicting CAT performance showed contributions from brain functional connectivity mostly related to the Default Mode Network, likely related to associative processes required in all trials of the task. Besides, the functional connectivity pattern of associative remoteness linked to CAT trials also largely involved the Executive Control Network, Dorsal Attention Network and Somatomotor networks, suggesting that more controlled processes played an important role in trials with higher associative remoteness. Critically, the functional connectivity patterns related to higher creative demands of the task share similarities with functional connectivity patterns previously found to predict divergent thinking. Thus, our work potentially offers insights into neural mechanisms that play a role in both convergent and divergent remote thinking.
Introduction
Creative thinking allows people to solve problems, innovate, and adapt to new situations (Lopez-Persem, Bieth, Guiet, Ovando-Tellez, & Volle, Citation2021). Creativity is therefore of undeniable societal and individual interest, as it is essential for the blossoming and progress of individuals and societies. Despite its importance, the cognitive mechanisms underlying creative abilities are far from understood (Beaty, Benedek, Silvia, & Schacter, Citation2016; Benedek & Fink, Citation2019).
Two main creative thinking abilities that have been studied over the past years are divergent and convergent thinking (Kenett et al., Citation2020). Divergent thinking refers to an ideational process which involves generating a broad range of solutions or ideas to a given task and is considered the hallmark of creative ability (Acar & Runco, Citation2019; Runco & Acar, Citation2012). Conversely, convergent thinking involves exploring different ideas to select the pertinent one, or to find the correct solution to a given problem (Brophy, Citation2001; Lee & Therriault, Citation2013). While the neuroscientific research of creativity has significantly increased over the past two decades (Kenett et al., Citation2020), most of this research focuses on divergent thinking, and far less is known on the cognitive and neural mechanisms related to convergent thinking (Benedek, Christensen, Fink, & Beaty, Citation2019). The existing research on convergent thinking is largely motivated by the associative theory of creativity, and the Remote Association Task (RAT) developed to study this theory (Mednick, Citation1962).
Based on Mednick’s associative theory, creative thinking relies on combining remote associative elements in a novel and effective way. Hence, the more remote these elements are, the more creative the process of combining them is (Mednick, Citation1962). This model further hypothesizes that creative abilities partly depend on the organization of the concepts in semantic memory (e.g., Abraham & Bubic, Citation2015; He et al., Citation2021). Previous research supports the role of associative thinking in creativity showing that more creative individuals are able to link distant concepts more easily, rate unrelated words as less semantically distant and are faster in judging the relatedness of concepts (Beaty, Silvia, Nusbaum, Jauk, & Benedek, Citation2014; Benedek & Neubauer, Citation2013; Rossman & Fink, Citation2010; Vartanian, Martindale, & Matthews, Citation2009), have more flexible semantic associations and connect more distant concepts or words (Bendetowicz et al., Citation2018; Bendetowicz, Urbanski, Aichelburg, Levy, & Volle, Citation2017; Benedek, Könen, & Neubauer, Citation2012; Kenett, Anaki, & Faust, Citation2014; Volle, Citation2018). These findings suggest that remote elements in memory may be more strongly interconnected in creative individuals. In addition, brain-damaged patients have shown more rigid semantic associations related to poor creative abilities (Bendetowicz et al., Citation2018; Ovando-Tellez, Bieth, Bernard, & Volle, Citation2019; Paulin, Roquet, Kenett, Savage, & Irish, Citation2020). Overall, associative thinking has been related to creative abilities as measured by different framework-based tasks (Beaty, Silvia, Nusbaum, Jauk, & Benedek, Citation2014; Benedek, Jurisch, Koschutnig, Fink, & Beaty, Citation2020; Benedek, Könen, & Neubauer, Citation2012; Mednick, Citation1962).
Despite the importance of associative thinking in creativity, the neural mechanisms allowing to connect and combine distant associates in creative tasks remain poorly understood. Importantly, it is still unclear how the process of making associative combinations is reflected at the level of the brain, and how it depends on varying levels of associative remoteness between concepts. In the current study, we examine this issue by applying a machine learning approach to examine how whole-brain neural functional connectivity patterns predict different aspects of a creative associative task, based on the original RAT (Mednick, Citation1962), and how these brain patterns are similar or differ when predicting the successful combination of associates with lower or higher associative remoteness.
In the RAT, participants are presented with three unrelated cue words and are required to find a fourth word offering a semantic link to all cues (e.g., blue, cottage, cake; response: cheese). While still debated whether the RAT more strongly relates to intelligence or creativity (Lee & Therriault, Citation2013), recent studies are applying state-of-the-art methods to unpack the cognitive processes and neural mechanisms involved in performing this task, focusing on automatic, spontaneous, and controlled, executive, cognitive processes (Becker, Davis, & Cabeza, Citation2022; Becker, Kühn, & Sommer, Citation2020). For example, process analyses of RAT performance have shown that it involves incrementally constrained search processes, where participants make an association to one cue and then evaluate its fit to the other cues (Smith, Huber, & Vul, Citation2013). Conversely, RAT has been also highly related to insight problem solving (Bowden & Jung-Beeman, Citation2003; Kounios & Beeman, Citation2014). Over the years, variations of the original RAT have been developed. For example, the compound RAT focuses on the formation of compound words by combining the cues and the target words (Bowden & Jung-Beeman, Citation2003). More recently, Bendetowicz and colleagues (Bendetowicz et al., Citation2018; Bendetowicz, Urbanski, Aichelburg, Levy, & Volle, Citation2017) developed the combined association task (CAT). This task measures the ability to find associative links between three cue words, and trials differ as a function of the cues’ associative remoteness (or associative distance) to the solution. To this aim, the authors varied and controlled the semantic distance (or measured based on French associative norms; http://dictaverf.nsu.ru/pages/dict_sanfn.php?lang=fr) between the expected solution and the three cue words. The CAT was developed to test Mednick’s hypothesis, according to which the more remote the elements to be combined, the more creative the process (Mednick, Citation1962). Indeed, Bendetowicz et al. (Citation2018) showed that a difference in performance between distant (i.e., higher semantic distance between cue words and solution) and close (i.e., shorter semantic distance between cue words and solution) trials of the CAT correlated with other creativity measures such as divergent thinking. Compared to classic RAT versions, this task allows to assess the effect of associative remoteness on the successful combination of cue words, and to study the brain correlates of this effect. However, while associative abilities are widely acknowledged as playing a major role in creative thinking (Benedek, Könen, & Neubauer, Citation2012), performance in such remote association tasks (standard, compound, or combined) is far from understood. One way to further elucidate performance in such associative tasks in relation to creativity is by studying the neural correlates of performance in such tasks.
Existing MRI-based neuroimaging studies have identified a large set of brain regions involved in creative cognition (Beaty et al., Citation2018; Beaty, Seli, & Schacter, Citation2019; Boccia et al., Citation2015; Gonen-Yaacovi et al., Citation2013; Volle, Citation2018). A growing body of creativity neuroscience research has highlighted the importance of functional interactions within and between several brain networks, including the executive control network (ECN), salience network and the default mode network (DMN) (Zabelina & Andrews-Hanna, Citation2016). Additionally, semantic and episodic memory regions (Benedek et al., Citation2018; Cogdell‐brooke, Sowden, Violante, & Thompson, Citation2020; Gonen-Yaacovi et al., Citation2013; Liu et al., Citation2021; Madore, Thakral, Beaty, Addis, & Schacter, Citation2019), and the motor and premotor regions have been shown to play a role in creative cognition (Gonen-Yaacovi et al., Citation2013; Matheson & Kenett, Citation2020; Ovando-Tellez et al., Citation2022). The advantage of a whole-brain functional connectivity approach over a localization-based approach is to provide a holistic and functional view of how brain networks relate to creative thinking. For example, resting-state functional connectivity as well as task-based functional connectivity within and between these networks were shown to predict individual-differences in creative abilities (Beaty et al., Citation2018; Chen et al., Citation2014; Frith et al., Citation2021; Wei et al., Citation2012).
Only a few studies have so far examined the neural substrates related to associative thinking as assessed with the RAT, and most studies using the RAT-like tasks focused on the insight phenomenon (Wu, Huang, Chen, & Chen, Citation2020). These studies include structural (Bendetowicz, Urbanski, Aichelburg, Levy, & Volle, Citation2017; Tu, Kuan, Li, & Su, Citation2017), task-based (Becker, Kühn, & Sommer, Citation2020; Becker, Sommer, & Kühn, Citation2020a, Citation2020b; Benedek, Jurisch, Koschutnig, Fink, & Beaty, Citation2020; Tik et al., Citation2018; Wu & Chen, Citation2021b; Wu, Chan, & Chen, Citation2021; Wu, Tsai, & Chen, Citation2020) and resting-state (Wu & Chen, Citation2021a) functional MRI, patient (Bendetowicz et al., Citation2018) and neural modeling (Kajić, Gosmann, Stewart, Wennekers, & Eliasmith, Citation2017) research. The structural and functional MRI studies consistently demonstrate the role of the left inferior frontal gyrus – a key region of the ECN also involved in semantic control – in such association tasks, (Becker, Kühn, & Sommer, Citation2020; Becker, Sommer, & Kühn, Citation2020a; Benedek, Jurisch, Koschutnig, Fink, & Beaty, Citation2020) and is considered to be critical in retrieving remote associations or link remote concepts (Evans, Krieger-Redwood, Alam, Smallwood, & Jefferies, Citation2020; Krieger-Redwood et al., Citation2022; Vatansever, Smallwood, & Jefferies, Citation2021). In addition, performance in the RAT has been related to higher efficiency of the DMN (Wu & Chen, Citation2021a, Citation2021b; Wu, Tsai, & Chen, Citation2020), a network that has been broadly associated with heightened associative abilities (Benedek, Jurisch, Koschutnig, Fink, & Beaty, Citation2020; Marron et al., Citation2018; Marron, Berant, Axelrod, & Faust, Citation2020). Finally, performance in the RAT has been related to strong bilateral activation in the insula (Becker, Sommer, & Kühn, Citation2020b), a key region of the salience network, a network related to orienting and attention to stimuli (Uddin, Citation2015). Critically, all three brain networks have been strongly linked to performance in divergent thinking tasks (Beaty et al., Citation2018; Beaty, Seli, & Schacter, Citation2019).
Using the CAT, Bendetowicz, Urbanski, Aichelburg, Levy, and Volle (Citation2017) found that higher performance in combining remote associates was related to lower gray matter volume in the left rostrolateral prefrontal cortex (PFC) and in the left inferior parietal lobule. In a follow-up study, Bendetowicz et al. (Citation2018) examined patients with focal frontal lesions as they performed the CAT. The authors found that damage to the right medial PFC in the DMN affected patients’ ability to generate remote associations, whereas damage to the left rostrolateral PFC in the ECN spared remote association ability but impaired the combination ability required by the CAT. These results converge with recent findings (Evans, Krieger-Redwood, Alam, Smallwood, & Jefferies, Citation2020) showing that forming remote associations involves intra-DMN regions (including the rostromedial PFC) while combining remote associates recruits the functional connectivity between DMN and ECN regions, in particular in the inferior frontal gyrus (IFG). They also are consistent with recent evidence (Becker, Kühn, & Sommer, Citation2020) showing that increased semantic distance during compound RAT recruit IFG control-related regions, indicating that the DMN may not be sufficient during RAT-like associative thinking tasks. Overall, existing findings indicate that RAT performance depends on the remoteness of the solution word and requires both associative and controlled combination processes supported by distinct regions and networks (Bendetowicz et al., Citation2018, see also Becker, Davis, & Cabeza, Citation2022; Smith, Huber, & Vul, Citation2013). This data also highlights the need for whole-brain functional connectivity studies to further elucidate the interaction of these networks in combining remote associates.
A recent approach in neuroimaging research is connectome-based predictive modeling (CPM; Shen et al., Citation2017), which uses machine learning methods to identify patterns of functional connectivity that predict complex cognitive functions, including divergent thinking ability (Beaty et al., Citation2018; Frith et al., Citation2021; Goldfarb, Rosenberg, Seo, Constable, & Sinha, Citation2020; P. Liu et al., Citation2021; Ren et al., Citation2021; Rosenberg et al., Citation2016; Shen et al., Citation2017). The relationship of individual differences in brain functional organization and creative abilities using a CPM approach has so far only been investigated with divergent thinking tasks (Beaty et al., Citation2018; Frith et al., Citation2021), while more convergent tasks such as the RAT or CAT have not yet been explored with this connectome-based approach.
In this study, we used a CPM approach to examine the functional connectivity patterns predicting individual differences in creative performance as measured by the CAT. We analyzed task-based functional brain connectivity under well-defined conditions while participants performed a semantic relatedness judgment task. This approach allowed us to assess brain connectivity while all participants were performing the same task but yet independent of task-related brain activation (see Methods). Importantly, the functional connectivity patterns during task conditions improves the predictions beyond resting-state functional connectivity (Cole, Ito, Cocuzza, & Sanchez-Romero, Citation2021). Finally, we applied the predictive model built on task-related functional connectivity data to the resting-state data of the participants as an internal validation and evaluation of the generalization of the predictive model to rest data.
The advantage of using the CAT, rather than the classic RAT, is that creative performance in trials with lower and higher associative remoteness can be assessed separately by varying associative distance between cue and solution words across CAT trials. We hypothesize that, similar to divergent thinking, the associative mechanisms recruited for performing in the CAT can be predicted by whole-brain functional connectivity patterns. Specifically, we predict that such functional connectivity patterns will involve, in particular, connections within and between the DMN, ECN, and salience networks (Beaty et al., Citation2018; Beaty, Benedek, Kaufman, & Silvia, Citation2015; Becker, Sommer, & Kühn, Citation2020b; Bendetowicz et al., Citation2018). Moreover, based on previous results (Bendetowicz et al., Citation2018) showing the recruitment of the executive control network for distant trials, we expected to observe a higher involvement of control networks for trials with higher associative remoteness.
Materials and methods
Participants
Data collected for this study were part of a larger study examining the role of neural and cognitive networks in creative thinking (Ovando-Tellez et al., Citation2022, Citation2022). We recruited 101 healthy right-handed participants (48 women, aged 22–40 years, mean age 25.6 ± SD 3.7) without neurological disorder, cognitive disability or medication affecting the central nervous system. All participants were French native speakers and had normal or corrected-to-normal vision. Eight participants were excluded from the fMRI analysis due to the discovery of MRI brain abnormalities (6 participants), falling asleep during the acquisition of the data (1 participant) and claustrophobia episode at the beginning of the MRI scanning (1 participant). The participant that experienced the episode of claustrophobia performed the task outside the scanner and this data was included in the behavioral analysis. In total, the data collected from 94 participants (44 women, mean age 25.4 ± 4.2) were considered for the behavioral analyses, and the data from 93 participants were considered for the fMRI analyses (44 women, mean age 25.4 ± 3.4). The study was approved by a national ethical committee (CPP Number 180,103; ID-RCB 2017-A03109-44). Participants gave written informed consent and received a monetary compensation for their participation.
Materials
General procedure
After being informed about the experiment and overall visit, the participants first completed the fMRI session while performing semantic relatedness judgments, followed by a resting-state session. Then, outside the scanner, and after a self-paced break, they completed the CAT.
Combined associates task (CAT)
The CAT (Bendetowicz et al., Citation2018; Bendetowicz, Urbanski, Aichelburg, Levy, & Volle, Citation2017) is an adaptation of the RAT (Mednick, Citation1962) and measures the ability to combine remotely associated words. In this task, three cue words with no obvious link are presented to the participants and they have to come up with a fourth word that is semantically related to all the three cue words. CAT trials vary according to the mean associative distance between each of the three cue words and the expected solution, based on French association norms (Debrenne, Citation2011). This database enables to compute an associative strength (or frequency) that quantifies the percentage of native French speakers (n > 450) who produced the word B when they were given the word A in a free word association task. Therefore, each trial had a value measuring the mean associative strength between the cues and the expected solution, where lower values represent higher remoteness (i.e., lower associative strength between the cue words and the solution), while higher values represent lower remoteness (i.e., higher associative strength between the cue words and the solution). The task consisted of 100 trials, half of which could be categorized as either close or distant trials based on a median split of the mean associative strength (median value 6.5; range from 0.3 to 38.8).
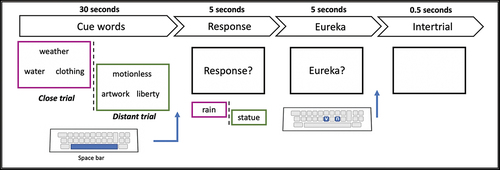
The time course of the task consisted of presenting the 100 trials successively to the participants on the computer screen, including a self-paced break after 50 trials (). The sequence of trials counterbalanced quasi-randomly across the participants. For each trial, the three cue words were displayed on the computer screen and participants had 30 s to come up with the response. They were asked to press the space bar once they had its answer and to type in the word response via a keyboard. After the participants wrote their response, they were asked to report whether the solution was found by insight (Eureka) or not (Kounios & Beeman, Citation2014; Topolinski & Reber, Citation2010) by pressing either the key V (insight) or N (no-insight) on the keyboard. The written instructions were as follows: “After finding the solution, please indicate whether you solved the problem with a Eureka phenomenon. That is, if the solution came to your mind suddenly, like an illumination. This phenomenon corresponds to a solution that appeared all of a sudden, without effort. It is the opposite of finding the solution via progressive steps where several possible answers are successively tested. The question is therefore about the feeling you had in the moment before you gave your answer.” If the participant did not find the solution within the 30 s, a new trial was proposed.
Figure 1. Time course of a CAT trial. CAT trials are presented for close (magenta frame) and distant (green frame) trials. Each trial starts with the presentation of the cue words for either a close or a distant trial for up to 30 seconds. Once the participant thinks of a solution, they press the space bar and type the response using a keyboard within a time limit of 5 seconds. Then, if the participant provides a response, they are asked whether they experienced a Eureka. The response is provided using the ‘v’ (yes) or the ‘n’ key (no). Trials were separated by an intertrial of 0.5 seconds.
For each trial, participants could provide only one solution. A given response was considered as correct when it was related to each of the three cues of the trial, based on the French dictionary of associative norms (Dictaverf; http://dictaverf.nsu.ru/pages/dict_sanfn.php?lang=fr). Responses that were lexically similar to responses considered as correct were also accepted (i.e., words with a same root, such as, “STOP” and “STOPPER”).
For each participant, we computed seven different CAT scores: 1) The solving performance was quantified by the percentage of correct responses in total (CAT_all), and for close (CAT_close) and distant (CAT_distant) trials, separately; 2) The mean reaction time for correct responses considered the time from the onset of cue words to the moment when the participant pressed the space bar, in total (CAT_all_RT), in close (CAT_close_RT) and distant (CAT_distant_RT) trials, separately; and 3) To account for the processes carried out by the participants to solve the CAT trials, we calculated the percentage of correct responses that were solved through a Eureka phenomenon (CAT_eureka).
Finally, in order to examine the effect of the associative remoteness of CAT trials on the individual’s performance, we assessed individual differences in the ability of performing CAT at varying levels of associative remoteness. We took advantage of the associative strength value of each CAT trial and examined the effect of this variable on the probability of solving the CAT trials at the individual level via a logistic regression analysis (Bieth et al., Citation2021). As we expected the associative strength of the trials to be correlated with the individual’s RTs, we controlled for RTs in the regression analysis. For each individual, we estimated the intercept and the slope of the regression analysis. We assumed that the intercept reflects the predicted mean probability of solving the CAT trial and labeled it CAT_ability, and the slope, reflects the predicted change in the probability of solving CAT trials when the associative strength varies, and labeled it CAT_sensitivity. Since the slope shows the relationship between performance and associative remoteness, a negative slope indicates higher probability of solving CAT trials when the associative remoteness increases (i.e., lower strength of association between cue words and solution), while a positive slope indicates a lower probability when the associative remoteness increases. Overall, the CAT_ability represents the probability of finding the solution of the CAT trials and therefore, the ability to successfully perform the task. We expect CAT_all and CAT_ability to both capture overall performance in CAT. CAT_sensitivity represents how much the probability of solving the CAT trials decreases as the remoteness of the trials increases. Therefore, CAT_sensitivity should reflect individual sensitivity of performance to associative remoteness. We expect that it relates to the difference in performance between close and distant trials. A summary of all the CAT scores is provided in the .
Table 1. Description of CAT scores.
Relatedness judgment task (RJT)
Participants underwent the RJT task during a multi-echo fMRI acquisition. Before the performance of the RJT, participants underwent a motor and a task training. The motor training consisted of 25 trials, in which participants were presented with a number in the center of the screen, along with a visual scale going from 0 to 100. Using a trackball, they were instructed to localize the number into the scale and to validate their response. At the end of each trial, participant received a feedback indicating the value within the visual scale corresponding to the position of the trackball at the moment of the validation. The task training consisted of 15 trials, and the instructions given to the participants were the same than the actual task. The difference between the training and the actual tasks were the pairs of words used as stimuli. Both trainings considered the same parameters of time than the actual task, as detailed below.
The task consisted of judging the relatedness between 595 pairs of words (Benedek et al., Citation2017; He et al., Citation2021; Ovando-Tellez et al., Citation2022). These pairs of words consisted of all possible pair word combinations from a set of 35 words. The set of 35 words was selected via computational methods which allowed controlling for semantic and linguistic properties of the words, and the proportion of the theoretical semantic distance between all possible pairings between two different words. The theoretical semantic distance was measured based on French verbal association norms (http://dictaverf.nsu.ru/pages/dict_sanfn.php?lang=fr). For further details of the building of the RJT see Bernard, Kenett, Ovando-Tellez, Benedek, and Volle (Citation2019).
The 595-word pairs were used as trials for the RJT. The 595 trials were presented successively to the participants, and they were asked to judge the relatedness between the words. Each trial began with the display of the pair words with a visual scale below ranging from 0 (unrelated words) to 100 (strongly related words). Each trial consisted of the reflection period, the response period and an inter-interval trial period. During the reflection period, participants were given 2 s to think about the relatedness between the words. After this time, during the response period, a cursor appeared in the middle of the visual scale and participants were able to move the slider, using an MRI-compatible trackball, to give their response. Participants had 2 s to move the slider and to localize it on any of the values of the visual scale according to their relatedness judgment. Participants were asked to validate their response by clicking on the trackball. We registered the position of the slider at the moment of the validation or at the end of the response period, that was considered as the relatedness judgment value between words given by the participant. Each trial included an inter-trial interval jittered ranging from 0.3 to 0.7 s (interval = .05).
We distributed the 595 trials in six runs composed by 100 trials each, except for the last run with only 95 trials. Each run lasted 530 s and was composed by four blocks of 25 trials (20 trials for the last run of the sixth run) separated by 20 s of cross fixation. At the beginning and at the end of each run, a 10-s cross fixation was displayed on the screen. The last 2 s of the rest period, the cross changed of color to warn the participants the beginning or continuation of the task. Between runs, participants stayed inside the scanner and had a self-paced break. For each participant, we computed the mean relatedness judgment across all RJT trials (meanRJT).
MRI data acquisition and preprocessing
Participants completed the RJT task in six separated runs during the fMRI acquisition data. FMRI data were collected on a 3T MRI scan (Siemens Prisma, Germany) with 64-channel head coil using multi-echo echo-planar imaging (EPI) sequences. Each run included 335 whole-brain volumes acquired with parameters as follows: repetition time (TR) = 1,600 ms, echo times (TE) for echo 1 = 15.2 ms, echo 2 = 37.17 ms and echo 3 = 59.14 ms, flip angle = 73°, 54 slices, slice thickness = 2.50 mm, isotropic voxel size 2.5 mm, field of view (FoV) = 210 mm, Ipat acceleration factor 2, multi-band 3 and interleaved slice ordering. At the end of the six functional runs, a T1-weighted structural image was acquired with the parameters as follows: TR = 2,300 ms, TE = 2.76 ms, flip angle = 9°, 192 sagittal slices with a 1 mm thickness, isotropic voxel size 1 mm, FoV = 256 mm, Ipat acceleration factor 2 and interleaved slice ordering. A 15-min resting scan was collected after the T1 acquisition. No dummy scan was recorded during the acquisition; therefore, we did not discard any volume.
The fMRI data was preprocessed in three different steps. First, we preprocessed the fMRI data for each run separately using the afni_proc.py pipeline from AFNI (Cox, Citation1996). The AFNI pipeline included despiking, slice timing correction, and realignment to the first volume (computed on the first echo). The second preprocessing step consisted of denoising the data using the TE-dependent analysis of multi-echo fMRI data (TEDANA), version 0.0.9 (Kundu et al., Citation2013; Kundu, Inati, Evans, Luh, & Bandettini, Citation2012). The acquisition of multi-echo EPI sequences allowed us to preprocess the data by assessing the BOLD and non-BOLD signal through the ICA-based denoising method. This method improves the cleaning of the data and the reliability of the functional connectivity-based measurement (Lynch et al., Citation2020). Using the TEDANA pipeline, we first performed an optimally combination of the single-echo time series across echoes. The dimensionality of the combined data was then reduced using a principal component analysis (PCA) and independent component analysis (ICA) to decompose the multi-echo BOLD data. Similar ICA-based approaches have been previously used as a robust strategy for removing motion artifacts from fMRI data (Pruim et al., Citation2015). Finally, the resulting components were classified as BOLD or non-BOLD, and the exclusion of the non-BOLD components allowed the removal of thermal and physiological noise such as the artifacts generated by the movements, respiration and cardiac activity.
The last step of the preprocessing was performed with the Statistical Parametric Mapping (SPM) 12 package running in Matlab (Matlab R2017b, The MathWorks, Inc.,USA). The denoised data was co-registered on the T1-weighted structural image 12 package running in Matlab (Matlab R2017b, The MathWorks, Inc., USA). We then normalized the data to the Montreal Neurological Institute (MNI) template brain, using the transformation matrix computed from the normalization of the T1-weighted structural image, performed with the default settings of the computational anatomy toolbox http://dbm.neuro.uni-jena.de/cat/ (CAT 12; Gaser, Dahnke, Thompson, Kurth, & Luders, Citation2022) implemented in SPM 12. To covary out the task-related signal from each run, we entered the data in a general linear model (GLM) in SPM. For the GLM analysis, we entered the 24 motion parameters (standard motion parameters, first temporal derivatives, standard motion parameters squared and first temporal derivatives squared) and the onsets and durations of the task-related events as confounds to be regressed from the BOLD signal. Finally, we concatenated the residuals of each task run and we standardized and detrended the resulting data before concatenating the six runs. The rest periods between runs (6 volumes in total) were removed from the concatenation. This method follows the background connectivity approach (Cole et al., Citation2019). This choice was motivated by previous studies showing subtle differences in intrinsic networks during task performance compared to rest, which are largely individual-specific (Gratton et al., Citation2018) and facilitate the prediction of individual traits and differences in brain–behavior relationships (Cole, Ito, Cocuzza, & Sanchez-Romero, Citation2021; Greene, Gao, Scheinost, & Constable, Citation2018; Jiang et al., Citation2020). The final dataset composed of the concatenated residuals of the six task-runs was used as input for the subsequent task-based functional connectivity analyses.
As an internal validation, we additionally explored whether the predictive models based on the task-based functional connectivity are generalizable to participants’ resting-state functional connectivity. Note that “task-based functional connectivity” refers to the functional connectivity explored during the performance of the RJT following the background connectivity approach (Cole et al., Citation2019).
Building the task-based functional connectivity matrices
We estimated the task-based functional connectivity matrices of each participant using Nilearn v0.3 (Abraham et al., Citation2014) in Python 2.7. To define the region of interest (ROIs), we used the Schaefer brain atlas consisting of 200 ROIs distributed into 17 functional subnetworks across 8 main functional networks (Schaefer et al., Citation2017). We selected the Schaefer atlas because the definition of the different parcels was based on resting-state functional connectivity by integrating two approaches of local gradient and global similarity, and because it has more functionally homogeneous brain parcellations than other atlases, both when exploring resting-state and task-based functional connectivity data (Schaefer et al., Citation2017). We extracted the BOLD signal during the RJT task for each ROI separately (averaged across voxels) and computed the Pearson correlation coefficients between all pair of ROIs. For each participant, we built a 200 × 200 matrix in which the rows and columns represented the ROIs and the convergent cell between ROIs represented the correlation coefficients between them. This matrix corresponds to the functional connectivity network of each participant in which ROIs are the nodes, and correlation coefficients the links. These matrices were Z- Fisher-transformed and rescaled to the maximum value for the subsequent analyses.
Connectome-based predictive modeling (CPM)
The CPM analyses were performed using Matlab Statistical Toolbox (Matlab R2020a, The MathWorks, Inc., USA). The pipeline for the CPM is adapted from the Shen protocol (Shen et al., Citation2017). Using the CPM approach (Beaty et al., Citation2018; Rosenberg, Hsu, Scheinost, Todd Constable, & Chun, Citation2018; Shen et al., Citation2017), we explored whether creativity scores measured by the CAT task can be predicted from patterns of functional connectivity during the RJT task.
We performed independent CPM-based predictions of the CAT scores (CAT_all, CAT_close, CAT_distant, CAT_all_RT, CAT_close_RT, CAT_distant_RT and CAT_eureka) and of the individual’s intercept (CAT_ability) and slope (CAT_sensitivity) estimated from the logistic regression analysis. By following the method described in Citation2017), we used the leave-one-out cross-validation that consisted in building the predictive model iteratively on N-1 participants (training) and test the prediction on the left-out participant. To ensure that motion patterns were not increasing artifactually the prediction of the CAT measures, we estimated the mean framewise displacement (meanFD), that is the sum of the absolute values of the derivatives of the six realignment parameters (Power et al., Citation2014), and added the meanFD value as a regressor in the predictive model.
We performed independent CPM computations for each CAT measure. The CPM analysis consisted of four different steps. In the first step, the significant features of brain connectivity were selected to build the model brain networks (). In the training set (N-1) we performed Spearman correlations to select the links of the functional connectivity matrix (correlation coefficients between the ROIs) that correlated (threshold p < .01) either positively (the positive model network) or negatively (the negative model network) to a given CAT measure across participants. Since we performed the selection of the significant features on each N-1 training set, each iteration can account for a slightly different number of significant links. The selection of the p-value threshold was motivated by previous studies using a p-value < .01 to capture the most significant edges related to different cognitive behaviors (Beaty et al., Citation2018; Finn et al., Citation2015; Rosenberg et al., Citation2016). To ensure that our selection represents the optimal threshold (Shen et al., Citation2017), we assessed which p-value threshold led to the greatest overall brain-behavioral predictive efficacy for all CAT measures (as in Ren et al., Citation2021). We considered four thresholds: .05, .01, .005, and .001; and used the r between the predicted and the observed values for each variable as the evaluation index. Among these four thresholds for determining edge selection, the correlation between the predicted and observed CAT scores was highest for p < .01. This result supported the selection of the p < .01 for our study.
Figure 2. CPM-based prediction of the CAT scores. (a) We defined 200 brain ROIs based on the Schaefer atlas. For each participant, we measured the BOLD activity during the relatedness judgement task (RJT) and built a 200 by 200 functional connectivity matrix. The columns and rows represent the 200 ROIs, and each cell (links) is the coefficient of correlation between ROIs during the RJT task. Since we ran a leaving-out-one cross-validation, each of the CPM steps were analyzed in N-1 subjects. First, the values in each cell in the functional connectivity matrix were correlated to the creativity scores of each participant using Spearman correlations. We retained the links that were either positively or negatively correlated to the CAT scores (p < .01) in a positive and a negative model network, respectively. (b) We computed the strength of functional connectivity of the positive and the negative model networks. (c) the network connectivity computed in the positive and the negative model network were used as regressors to build the predictive linear model. (d) We calculated the positive and negative model network properties in the left-out participant. These values were the input in the predictive model estimated in (c) to predict its creativity scores.
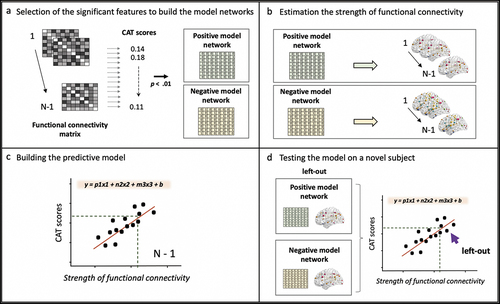
The second step of the CPM analysis consists in estimating the strength of functional connectivity within the positive and negative model networks for each participant (Shen et al., Citation2017); (). These values were the input in the third step to build the predictive model and apply it to a novel participant (the one left out for each iteration) (Shen et al., Citation2017) in the last step. We built a single linear model combining the strength of functional connectivity of the positive and negative model networks as predictors of the CAT measures. The meanFD motion parameter was included in the model to avoid any possible effect of the head motion related to fMRI acquisition on the CPM process (). Finally, we estimated the strength of connectivity of the positive and the negative model networks in the left-out participant, entered these values in the linear model and computed the predicted value of the CAT measure tested ().
To evaluate the power of the predictive model, we performed Spearman correlations between the predicted and the observed CAT measure values (Shen et al., Citation2017). When the predictions were positively significant (p < .05) we used a permutation testing to assess the statistical significance of the results. To this end, we randomly shuffled the values of the CAT measures 1,000 times, and we ran the new random data through the pipeline of our predictive model in order to estimate the distribution of the test statistic. The calculation of the p-value of the permutation test is reported for the significant CAT measures predictions.
Exploring the brain model network
To explore the functional connectivity patterns predicting the CAT measures, we characterized the brain substrates of the CPM-based model network. Considering that each iteration within the leave-one-out cross-validation resulted in slightly different links to build the model networks, we considered the links that were selected in all the leave-one-out iterations. We explored the distribution of the connections at the intrinsic network level (within and between the 8 main functional networks defined by the Schaefer atlas). In addition, for descriptive purposes, we highlight the nodes (i.e., ROIs) with a highest degree, that are the nodes with the highest number of functional connections to it (k), and we explored its location within the intrinsic networks. Note that, the identification of the highest degree nodes was based on the number of connections to the other nodes into the predictive networks and was not based on statistical analyses. To better describe the model networks predicting the performance of close and distant trials, we characterize the links that were common or distant-specific in the positive and negative model networks. Then, we identified the most connected nodes and most important links at the intrinsic functional networks level. Note that distant-specific links refers to the brain edges of the predictive models of the distant trial performance that were not observed in the predictive model of the close trial performance.
Internal validation: prediction of the CAT performance from resting-state functional connectivity
We applied the predictive model built on the task-based fMRI data to participants’ resting-state data. We used the strength of functional connectivity within the positive and negative model networks during the resting-state acquisition to predict our CAT measures. We evaluated the validity of the model with the Spearman correlations between the predicted and the observed CAT performance values.
Results
Combined associates task (CAT) performance
Descriptive statistics for the different CAT measures are provided in . We compared the accuracy and RTs for close and distant trials. Shapiro-Wilk test was performed and showed that the distribution of CAT_close departed significantly from normality, W = .95, p = .002. A Wilcoxon signed rank test indicated higher accuracy in close compared to distant trials, W = 4278, p < .001 (). A students’ independent samples t-test was performed to compare RTs in correct close and distant trials showing that RTs for distant trials were significantly longer than in close trials, t(93) = 8.4, p < .001 ().
Figure 3. Combined Associates Task (CAT) performance in trials with lower and higher associative remoteness. Boxplots with jittered points are shown for the a) accuracy and b) RTs in close (purple) and distant (green) trials. Dots symbolize individual accuracy and mean RTs, respectively. Bars show the median across participants. c) CAT_ability and CAT_sensitivity values obtained from the individual logistic regressions of four individuals were used to plot their fitting curves. The continuous lines represent a lower (red) and higher (black) CAT_ability and the dashed lines represent a lower (red) and higher (black) CAT_sensitivity. We used a range of [−10 10] in the x-axis for visualization purposes. *** p < .001.
![Figure 3. Combined Associates Task (CAT) performance in trials with lower and higher associative remoteness. Boxplots with jittered points are shown for the a) accuracy and b) RTs in close (purple) and distant (green) trials. Dots symbolize individual accuracy and mean RTs, respectively. Bars show the median across participants. c) CAT_ability and CAT_sensitivity values obtained from the individual logistic regressions of four individuals were used to plot their fitting curves. The continuous lines represent a lower (red) and higher (black) CAT_ability and the dashed lines represent a lower (red) and higher (black) CAT_sensitivity. We used a range of [−10 10] in the x-axis for visualization purposes. *** p < .001.](/cms/asset/907d44e3-3fd4-4b76-93a7-826cb30212b3/hcrj_a_2192563_f0003_oc.jpg)
Table 2. Descriptive statistics of CAT scores. Data are shown for CAT scores, including accuracy and RTs for the entire task (CAT_all; CAT_all_RT), and for close (CAT_close; CAT_close_RT) and distant (CAT_distant; CAT_distant_RT) trials separately, Eureka performance (CAT_eureka), CAT_ability and CAT_sensitivity.
We examined how the associative remoteness relate to solving CAT trials by computing CAT_ability (mean = −0.098, SD = 0.61) and CAT_sensitivity (mean = 0.35, SD = 0.24) for each participant using a logistic regression analysis (). These variables were used for the following analyses. The correlations between the different CAT performance measures and the behavioral measures of RJT are provided in the Supplementary Table S1.
Prediction of creative ability from brain connectivity
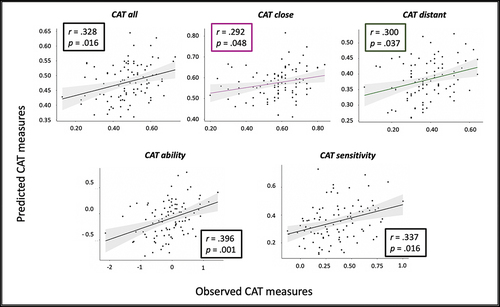
We applied the CPM approach to explore whether task-based functional connectivity patterns can predict the CAT performance measuring creative abilities. We computed the CPM-based prediction for the CAT measurements, estimating the strength of connectivity of the brain model networks. Independent CPM-predictive models were performed using the strength of connectivity of the positive and negative brain model networks to predict the CAT performance. The CPM prediction was significant for the CAT_all, r = .328, p = .016; CAT_close, r = .292, p = .048; CAT_distant, r = .300, p = .037; CAT_ability, r = .396, p = .001; and CAT_sensitivity, r = .337, p = .016, ) but not for the other CAT scores (all p’s > .05). Thus, CPM analyses show that individual’s ability in solving CAT trials, the performance in CAT, and the sensitivity to associative remoteness (more close or distant trials) can be reliably predicted from the task-based functional connectivity patterns related to semantic relatedness judgments.
Figure 4. CPM predicted CAT measures. Different CPM-based analyses were performed to predict the CAT measures. Each analysis considered the computation of the strength of functional connectivity in both the positive and the negative model network. Results with significant Spearman correlations between the predicted values (y-axis) and the observed values (x-axis) are shown for CAT_all (black), CAT_close (magenta) and CAT_distant (green) at the top, and for CAT_ability and CAT_sensitivity at the bottom. In the upper-left side or the lower right side of each graph, we provide the coefficient of correlation and the p values after permutation test.
Functional anatomy of the predictive brain connectivity patterns
We characterized the positive and negative model networks, whose functional connectivity is correlated to a lower and higher creativity based on CAT performance, respectively. To understand the role of associative distance in CAT performance, we first examined the results for the overall task performance (CAT_all), and later compared results separately for the close (CAT_close) and distant (CAT_distant) CAT trials in a descriptive way. As the descriptive comparison between the predictive networks of close and distant CAT trial performance prevented us from making statistical inference, we characterized the positive and negative model networks predicting the individual’s logistic regression values CAT_ability and CAT_sensitivity. The first representing the ability of performing CAT trials and the latter of solving the CAT trials when increasing the associative remoteness, which allowed statistical inference on functional connectivity patterns that relate to associative distance in CAT performance. The names of the brain regions (i.e., nodes) provided in the characterization of the predictive model networks are the node names given in the Schaefer atlas (Schaefer et al., Citation2017).
Brain correlates of overall task performance
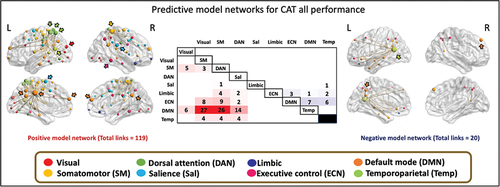
We characterized the positive and negative model networks whose functional connectivity is correlated to a lower and higher creativity score, respectively. For the prediction of the overall performance in CAT (CAT_all score) the analyses revealed that 119 links positively correlated with a higher CAT_all score connecting 73 different nodes (total of possible links = 19,900 links). The model network predicting higher CAT_all score (i.e., correlated to a higher creativity score) had a whole brain distribution. When exploring the network model at the functional networks level, most of the links belong to default, somatomotor and dorsal attention, followed by control and salience networks. The highest number of links were between default and somatomotor networks, between default and dorsal attention network, and between default and salience networks. The highest degree nodes were mainly in the left hemisphere being part of the default mode network (precuneus posterior cingulate cortex, k = 30; dorsal prefrontal cortex, k = 5), dorsal attention network (post central, k = 18; superior parietal lobe, k = 8), temporoparietal network (temporoparietal, k = 10), salience network (frontal medial, k = 5) and visual network (extrastriate cortex, k = 5). In the right hemisphere, highest degree nodes were found in regions of the somatomotor network (somatomotor, k = 21) and default mode network (medial prefrontal cortex, k = 6; precuneus posterior cingulate cortex, k = 6).
The negative model network of the CAT_all score was composed of 20 links connecting 20 different nodes with a whole-brain distribution mainly in the left hemisphere. At the functional networks level, most of the links connect to brain regions that belong to DMN and ECN (). The highest degree nodes were localized in the right hemisphere being part of the temporoparietal networks (temporoparietal, k = 9) and DMN (dorsal PFC, k = 5) and in the left hemisphere in regions of the DMN (precuneus posterior cingulate, k = 3, temporal, k = 2; ventral PFC, k = 2) and ECN (intraparietal sulcus, k = 2) ().
Figure 5. Functional anatomy of the CPM-based predicted CAT performance. the links of the positive model network predicting CAT_all is described. The positive (left) and negative (right) model networks of the CAT_all representing higher creative abilities are overlapped on the brain. The color of the nodes represents the different functional networks showed inside the brown frame. For descriptive display purposes, the size of the nodes is proportional to their degree, and the highest degree nodes are indicated by arrows representing the functional network to which they belong. The highest degree nodes were found mainly in the dorsal attention network (dark green arrows) in the left hemisphere and in the default mode network (orange arrows) in both hemispheres. Middle: The distribution of the links examined at the intrinsic functional networks level is presented in the correlation matrix. Each cell represents the number of links within and between the 8 main functional networks defined in the Schaefer atlas, in red colors for the positive model network and in blue colors for the negative model network. SM: somatomotor network, DAN: dorsal attention network, Sal: salience network, ECN: executive control network, DMN: default mode network, Temp: temporoparietal network.
Brain correlates of close and distant trial performance
Starting with the prediction of CAT_close, the analyses revealed that 29 links connecting 27 different nodes positively correlated with the performance in CAT close trials (total of possible links = 19,900 links). This positive model network had a whole brain distribution with most of the links connecting brain regions between DMN and somatomotor networks, between DMN and post central regions of the dorsal attention network (DAN), and between the precuneus/posterior cingulate region of the DMN and medial frontal and parietal operculum regions of the salience network. No links were observed within DMN, within ECN or between DMN and ECN. The highest degree nodes were mainly localized in the left hemisphere being part of the DMN (precuneus posterior cingulate cortex, k = 10; temporal, k = 3), DAN (post central, k = 8) and somatomotor networks (somatomotor, k = 2). In the right hemisphere, highest degree nodes were found in regions of the somatomotor networks (somatomotor, k = 8) and DMN (precuneus posterior cingulate cortex, k = 2; medial PFC, k = 2) ().
Figure 6. Positive and negative predictive networks of CAT solving of close and distant trials. the positive (left) and the negative (right) predictive model networks are superimposed on a volume rendering of the brain with a lateral and medial views for (a) close and (b) distant trials. For descriptive display purposes, the size of the nodes is proportional to their degree, and we indicate the highest degree nodes with arrows. The color of the nodes and arrows represent the functional network they belong to and are color coded as indicated at the bottom of the figure (brown frame). For the (a) close and (b) distant trials, the matrix represents the number of links within the model network occurring within and between the eight intrinsic brain networks. In red colors are presented the number of links that belong to the positive network and in blue are the links of the negative network. SM: somatomotor network, DAN: dorsal attention network, Sal: salience network, ECN: executive control network, DMN: default mode network, Temp: temporoparietal network.
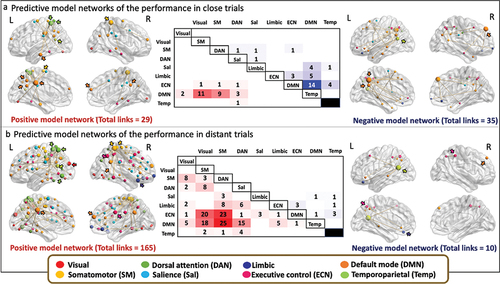
The negative model network, reflecting functional connectivity correlated with lower performance in close trials was composed of 35 links connecting 37 different nodes with a whole-brain distribution. At the functional networks level, most of the links connected brain regions that belong to DMN and ECN networks (). The highest number of links were within DMN. Other links connecting DMN and ECN networks, and DMN and limbic networks were observed. Connections between intraparietal nodes within ECN also participated in the negative model network. The highest degree nodes were found in the left hemisphere being part of the DMN (precuneus/posterior cingulate cortex, k = 9), and in the right hemisphere in regions of the DMN (dorsal PFC, k = 8) and temporoparietal networks (temporoparietal, k = 5) (). The information of the main node’s location, the functional network they belong to, and MNI coordinates are provided in Supplementary Table S2.
Then, we characterized the positive and negative model networks whose functional connectivity is correlated to a higher and lower CAT score in distant trials, respectively. For the prediction of CAT_distant, the analyses revealed that 165 links positively correlated with a higher creativity score connecting 92 different nodes. The model network predicting better performance in distant trials had a whole brain distribution with most of the links connecting brain regions between DAN and DMN, DAN and ECN, and between ECN and somatomotor network. The highest degree nodes were mainly in the left hemisphere being part of the DMN (precuneus posterior cingulate cortex, k = 20), DAN (superior parietal, k = 21; post central, k = 16; temporal occipital, k = 12) and visual network (extrastriate, k = 10). In the right hemisphere, highest degree nodes were found in regions of the somatomotor (k = 27) and DMN (medial PFC, k = 10) networks ().
The negative model network predicting poor performance in distant trials was composed of 10 links connecting 12 different nodes with a whole-brain distribution. At the functional networks level, most of the links connect to brain regions that belong to DMN and ECN (). The highest number of links were within the intraparietal sulcus in the ECN, and between DMN and temporoparietal networks. The highest degree nodes were localized in the left hemisphere being part of the temporoparietal networks (temporoparietal, k = 5), limbic (orbital frontal cortex, k = 2) and ECN (intraparietal sulcus, k = 2) networks and in the right hemisphere in regions of the DMN (dorsal PFC, k = 2) and ECN (intraparietal sulcus, k = 2) (). The information of the main node’s location, the functional network they belong to, and MNI coordinates are provided in Supplementary Table S3.
Similar and different brain connectivity patterns predicting close and distant conditions
We compared the model networks predicting the performance in close and distant trials in a descriptive manner. We first identified the shared links for the positive and negative predictive networks. When comparing the positive model networks, we found 18 links connecting 17 different nodes that were common in predicting better performance in close and distant trials. Most of these links connected DMN and the somatomotor network, and also DMN and post central regions of DAN. A connection between precuneus/posterior cingulate region of the DMN and medial frontal regions of the salience network also contributed to the shared model network. The highest degree nodes were localized in the right hemisphere in regions that belong to somatomotor networks (somatomotor, k = 8) and DMN (precuneus posterior cingulate cortex, k = 2; medial PFC k = 2), and in the left hemisphere in regions of the DMN (precuneus posterior cingulate cortex, k = 7) and DAN (postcentral, k = 5) ().
Figure 7. Shared and distant-specific patterns of prediction for CAT solving of close and distant trials. the positive (left) and the negative (right) predictive model networks are superimposed on a volume rendering of the brain with a lateral and medial views for (a) the common links between prediction models for solving CAT in close and distant trials, and (b) links that were uniquely found in prediction networks for solving CAT in the distant trials. For descriptive display purposes, the size of the nodes is proportional to their degree, and we indicate the highest degree nodes with arrows. The color of the nodes and arrows represent the functional network they belong to and are color coded as indicated at the bottom of the figure (brown frame). The matrix represents the number of links within the model network occurring within and between the eight intrinsic brain networks. In red colors are presented the number of links that belong to the positive network and in blue are the links of the negative network for the common (a) and distant-specific (b) networks. SM: somatomotor network, DAN: dorsal attention network, Sal: salience network, ECN: executive control network, DMN: default mode network, Temp: temporoparietal network.
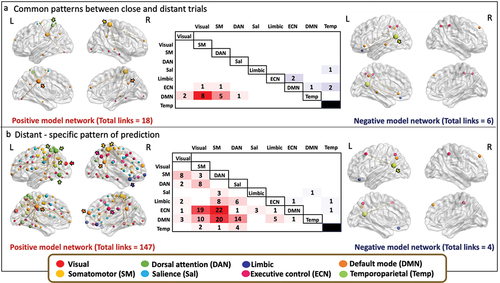
Similarly, we identified 6 common edges connecting 10 different nodes in the negative predictive networks. These links connect brain regions within left intraparietal sulcus and within right left intraparietal sulcus of the ECN, between DMN and temporoparietal networks, between limbic and temporoparietal networks and between precuneus posterior cingulate cortex and ventral PFC within DMN. Most of these nodes were localized in the left hemisphere with a highest degree node found in the temporoparietal region of the temporoparietal networks (k = 3) (). The information of the main node’s location, the functional network they belong to, and MNI coordinates is provided in Supplementary Tables S2 and S3.
Finally, we identified the brain connectivity patterns that were only observed in the predictive model of better performance in the distant trials, considered as the more creative ones. We identified 147 distant-only links connecting 90 different nodes in the positive predictive network. Most of the links connect brain regions between DAN and ECN, DAN and DMN, and between ECN and somatomotor networks. Connections within DMN were found between ventral PFC and parahippocampal cortex, and within ECN between temporal and cingulate posterior regions. The mid-cingulate region of the ECN connected to the medial frontal region of the salience network. A lateral PFC region partly overlapping the IFG of the ECN connected to the precuneus posterior cingulate cortex of the DMN. The highest degree nodes were mainly localized in the left hemisphere being part of the DAN (superior parietal lobe, k = 21; temporal occipital k = 12; post central k = 11), DMN (precuneus posterior cingulate cortex, k = 13), visual (extrastriate, k = 10), and temporoparietal (k = 7) networks. In the right hemisphere highest degree nodes were found in regions of the somatomotor networks (somatomotor, k = 19, k = 8), ECN (mid-cingulate, k = 8; inferior parietal, k = 7), limbic (orbital frontal cortex, k = 8), and DMN (medial PFC, k = 8) networks ().
Similarly, we observed 4 edges connecting 7 different nodes in the negative predictive network of the performance in the distant trials that were not observed on the predictive network of the close trial performance. These links connect brain regions between left and right intraparietal sulcus of the ECN, between inferior parietal lobule of the DMN and temporoparietal networks, between orbital frontal cortex of the limbic network and dorsal PFC of the DMN, and between lateral PFC of the ECN and temporoparietal networks. Most of these nodes were localized in the left hemisphere with a highest degree node found in the temporoparietal region of the temporoparietal networks (k = 2) (). The information of the main node’s location, the functional network they belong to, and MNI coordinates is provided in Supplementary Tables S2 and S3.
Brain correlates of the ability of performing CAT trials
We characterized the positive and negative model networks whose functional connectivity is correlated to a higher ability of solving CAT based on the logistic regression analyses. For the prediction of CAT_ability, the analyses revealed that 156 links positively correlated with a higher ability in CAT solving, connecting 79 different nodes. The model network predicting better performance in CAT trials had a whole brain distribution with most of the links connecting brain regions between DMN and DAN, DMN and salience, and between DMN and somatomotor network. The highest degree nodes in the left hemisphere were part of the DMN (precuneus posterior cingulate cortex, k = 35) and DAN (post central, k = 22; superior parietal, k = 14). In the right hemisphere, highest degree nodes were found in regions of the somatomotor (k = 28) and DMN (medial PFC, k = 10; precuneus posterior cingulate cortex, k = 8) networks ().
Figure 8. Positive and negative predictive networks of the individual’s ability of CAT solving. the positive (left) and the negative (right) predictive model networks are superimposed on a volume rendering of the brain with a lateral and medial views for (a) CAT_ability and (b) CAT_sensitivity values. For descriptive display purposes, the size of the nodes is proportional to their degree, and we indicate the highest degree nodes with arrows. The color of the nodes and arrows represent the functional network they belong to and are color coded as indicated at the bottom of the figure (brown frame). For the (a) CAT_ability and (b) CAT_sensitivity values, the matrix represents the number of links within the model network occurring within and between the eight intrinsic brain networks. In red colors are presented the number of links that belong to the positive network and in blue are the links of the negative network. SM: somatomotor network, DAN: dorsal attention network, Sal: salience network, ECN: executive control network, DMN: default mode network, Temp: temporoparietal network.
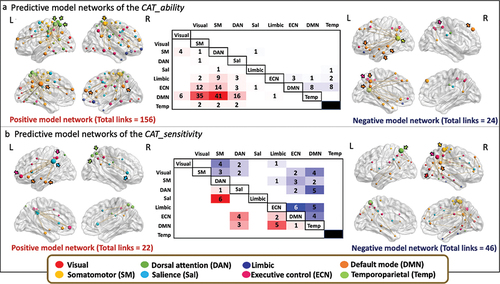
The negative model network predicting lower ability to perform CAT trials was composed of 24 links connecting 25 different nodes with a whole-brain distribution. At the functional networks level, most of the links connect to brain regions that belong to DMN and temporoparietal network (). The highest degree nodes were localized in the left hemisphere being part of the temporoparietal networks (temporoparietal, k = 11), DMN (precuneus posterior cingulate, k = 4; temporal, k = 2; ventral PFC, k = 2) and ECN (intraparietal sulcus, k = 2), and in the right hemisphere in regions of the DMN (dorsal PFC, k = 5) and ECN (intraparietal sulcus, k = 2) networks (). The information of the main node’s location, the functional network they belong to, and MNI coordinates is provided in Supplementary Table S4.
Brain correlates of the effect of associative remoteness on CAT trial performance
Finally, we characterized the positive and negative model networks whose functional connectivity was correlated to CAT_sensitivity. The positive model network predicting lower ability to perform more distant CAT trials was composed of 22 links connecting 39 different nodes with a whole-brain distribution. At the functional networks level, most of the links connect to brain regions that belong to salience and DAN networks. The highest degree nodes were localized in the left hemisphere being part of the salience network (inferior parietal, k = 6), DMN (ventral PFC, k = 3; temporal, k = 3) and ECN (lateral ventral PFC, k = 4; inferior parietal, k = 3) networks, and in the right hemisphere in regions of the DAN (superior parietal, k = 3) and salience network (insula, k = 3) ().
Note that a higher CAT_sensitivity value indicates a greater difference in performance between close and distant trials, i.e., more sensitivity to remoteness. Thus, the negative network may be relevant to examine since it indicates better performance in CAT trials with higher associative remoteness. The predictive analyses revealed that 46 links negatively correlated with CAT_sensitivity connecting 48 different nodes. The model network had a whole brain distribution with most of the links connecting brain regions between DMN and ECN, DMN and salience, and within ECN. The highest degree node was found in the left hemisphere being part of the DAN (superior parietal, k = 9). All other highest degree nodes were found in the right hemisphere being part of the somatomotor network (k = 8), ECN (inferior parietal, k = 7), DMN (inferior parietal, k = 5) and visual (extrastriate cortex, k = 3) networks (). The information of the main node’s location, the functional network they belong to, and MNI coordinates is provided in Supplementary Table S5.
Internal validation: prediction of the CAT performance from resting-state functional connectivity
As an internal validation, we explored whether the predictive models of CAT performance - CAT_all, CAT_close, CAT_distant, CAT_ability and CAT_sensitivity – trained in the task-related fMRI data can be generalized to independent resting state connectivity data. We observed significant predictions of the CAT performance when applying the predictive model to the resting state data. The Spearman correlations between the predicted values and the observed values showed significant predictions for CAT_all, r = .267, p = .010; CAT_close, r = .314, p = .002; CAT_distant, r = .267, p = .006; CAT_ability, r = .312, p = .003; and CAT_sensitivity, r = .541, p < .001, variables. These significant predictions suggest that predictive models based on task-based fMRI patterns of connectivity essentially generalize to functional connectivity during resting-state data, and that the abilities of combining remote associates as measured in CAT are reflected in intrinsic connectivity.
Discussion
This study investigated the whole-brain neural functional connectivity pattern related to performance in combining remote associations, a process critical for creative thinking. We found that global performance in the CAT task (CAT_all and CAT_ability) and the impact of associative remoteness on solving CAT trials (CAT_distant, CAT_close, and CAT_sensitivity) can be reliably predicted from task-based functional connectivity patterns measured during word relatedness judgments. While characterizing the respective predictive network models of close and distant trials allowed us to describe brain functional connectivity patterns related to CAT performance in trials with low and higher strength of association, CAT_sensitivity allowed us to identify brain regions related to the effect of associative remoteness on CAT trial performance. Importantly, these predictions were generalizable to resting-state functional connectivity data.
At the behavioral level, close CAT trials resulted in higher accuracy and shorter RTs compared to distant CAT trials. This result replicates the results of Bendetowicz, Urbanski, Aichelburg, Levy, and Volle (Citation2017) when exploring creativity with the CAT in a group of healthy participants. Although RTs are usually associated with task difficulty, here we demonstrate using individual logistic regressions that success in solving CAT trials can be predicted from the associative remoteness of the trials regardless of individual’s RTs. These findings are consistent with the associative theory of creativity (Mednick, Citation1962), stating that the more remote the elements to be combined, the more creative the process. It is assumed that solving close and distant trials depend on associative processes involving the activation of semantic memory (Beaty, Silvia, Nusbaum, Jauk, & Benedek, Citation2014; Beaty, Zeitlen, Baker, & Kenett, Citation2021; Benedek, Könen, & Neubauer, Citation2012; Gray et al., Citation2019; He et al., Citation2021; Marron et al., Citation2018; Marron, Berant, Axelrod, & Faust, Citation2020), and that solving distant trials additionally requires more controlled processes (Bendetowicz et al., Citation2018; Benedek & Fink, Citation2019; Gupta, Jang, Mednick, & Huber, Citation2012; Smith, Huber, & Vul, Citation2013; Taft & Rossiter, Citation1966). Our behavioral findings provide further empirical support to this notion. These behavioral results were further supported by the brain analyses discussed below.
We did not observe correlations between CAT performance when trials were solved via insight (CAT_eureka) and the associative remoteness of the CAT trials (CAT_close and CAT_distant). Previously, Becker, Wiedemann, and Kühn (Citation2020) developed a modified version of the compound remote associates (CRA) and found that higher trial difficulty (i.e., lower similarity between cues and solution) decreased the probability of solving trials via insight. However, Bieth et al. (Citation2021) examined the EEG activity while participants performed CAT trials and did not find correlations between the associative remoteness of the trials and CAT_eureka. Based on Bieth et al. (Citation2021), we did not expect correlations between CAT_eureka and the associative remoteness of our trials. Compared to Becker, Wiedemann, and Kühn (Citation2020), the current study provides different instructions to the participants when asking to report if the trials were solved via Eureka which may prevent the relationship between associative remoteness of the trials and insight problem solving. These inconclusive findings indicate that further research should be done to explore these relationships.
In our neural CPM analyses, we explored the functional connectivity patterns positively predicting CAT solving (CAT_ability). We found the involvement of the DMN, somatomotor and DAN, followed by salience and ECN networks in predicting CAT solution rate. The highest number of functional connectivity links were found between DMN and somatomotor, DMN and DAN, and DMN and salience networks. These functional connectivity patterns were very similar to the patterns predictive of CAT performance (CAT_all), and also to the predictive network models of both CAT close and distant trials. Previous results showed that RAT performance correlated with higher efficiency in DMN (Wu & Chen, Citation2021a). A few studies have recently linked the DMN to free association abilities (Bendetowicz et al., Citation2018; Marron et al., Citation2018; Marron, Berant, Axelrod, & Faust, Citation2020). Altogether, these findings suggest the role of associative processes required for generating different associates to each cue word. Interestingly, CAT performance was predicted by a lower connectivity within DMN and a higher connectivity between DMN and other networks, including the DAN and the sensorimotor networks.
The relevance of the sensorimotor network in the positive model network related to better CAT performance echoes a recent general view on the role of motor simulations in creative thinking (Matheson & Kenett, Citation2020) and showing the recruitment of the sensorimotor regions in functional MRI during divergent thinking. In their review, Matheson and Kenett (Citation2020) argue that generating alternative uses for objects utilizes mental simulations of the affordances of the objects. Our results may thus indicate that actively trying to identify associates that link different cue words involves mental simulations and activation of the affordances of the cue words (see also Benedek, Jurisch, Koschutnig, Fink, & Beaty, Citation2020) that involve interactions between DMN and sensorimotor networks.
In the positive model networks related to better CAT performance in the whole task, CAT ability and in close and distant trials, we observed the contribution of nodes overlapping the bilateral precuneus, posterior cingulate cortex and right medial PFC of the DMN (Supplementary Table S2). This finding is in line with previous studies showing that higher functional connectivity of the posterior cingulate cortex, in interaction with other networks contribute to the prediction of higher divergent thinking abilities (Beaty et al., Citation2018). In addition, the right medial PFC has been identified as a critical brain region for the CAT in a voxel-based lesion study in patients and was shown to support spontaneous associative thinking in a word association task (Bendetowicz et al., Citation2018). In line with this study, our current findings may indicate that the shared model network reflects, at least in part, spontaneous associative thinking processes. Supporting this idea, the right medial PFC also contributed to the prediction of lower sensitivity of CAT performance to associative remoteness. This brain region shows brain links uniquely within the DMN, a network that has been associated with increased associative abilities (Benedek, Jurisch, Koschutnig, Fink, & Beaty, Citation2020; Marron et al., Citation2018; Marron, Berant, Axelrod, & Faust, Citation2020).
The predictive model networks of the impact of the associative remoteness when solving CAT trials (CAT_sensitivity) showed a different pattern compared to the positive networks predicting CAT performance (CAT_all and CAT_ability). We characterized the negative predictive network of CAT_sensitivity which we assume reflect a better ability of solving more remote trials. To examine this assumption, we compared these patterns to the ones that were only observed in the predictive networks of the distant CAT trials (distant -specific links; Similar and different brain connectivity patterns predicting close and distant conditions section). The prediction of the CAT_sensitivity involved brain links that mostly connected brain regions between DMN and ECN, DMN and salience, and within ECN. The links between ECN and DMN and within ECN, were part of the negative predictive network of CAT_sensitivity () and only observed in the CAT_distant positive model network (). These findings indicate that, as expected, trials with higher associative remoteness related to a higher involvement of the ECN and support the role of controlled processes in interaction with associative processes for solving remote CAT trials (Bendetowicz et al., Citation2018; Bendetowicz, Urbanski, Aichelburg, Levy, & Volle, Citation2017). The interaction between DMN and ECN is also consistent with a previous study showing that the coupling of these functional networks benefits the integration of information in a similar task than CAT (Evans, Krieger-Redwood, Alam, Smallwood, & Jefferies, Citation2020). Overall, the involvement of ECN in interaction with the DMN may support executive control processes acting over the semantic memory structure for combining and integrating words with higher associative remoteness and thus, to meet demands of the task (Jefferies & Lambon Ralph, Citation2006; Noonan, Jefferies, Visser, & Lambon Ralph, Citation2013).
Additionally, most of the distant-specific brain links involved connections between DAN and ECN, between DAN and DMN, and between ECN and somatomotor networks. Although the identification of distant-specific brain links had descriptive purposes, it may reflect additional prominent involvement of DAN, ECN, DMN, and somatomotor networks when more distant trials are solved. The global integration of DAN, ECN, DMN, in addition to the salience network, has been shown to be related to higher retrieval flexibility related to creativity, which has an important role when solving more remote trials in CAT (Bendetowicz et al., Citation2018). The dynamic between DMN and DAN has been previously shown to be correlated with verbal creativity, and may indicate the role of the adjustment of attention when solving RAT-like trials (Vartanian, Citation2009; Sun et al., Citation2018).
Based on previous findings (Bendetowicz et al., Citation2018), we expected to find the contribution of prefrontal brain regions of the ECN to the prediction of the combination of words with higher associative remoteness. We observed a prefrontal ECN contribution to the predictive model network of distant-specific (Supplementary Table S3, line 61). The left prefrontal part of the ECN has been shown a critical brain region for solving CAT distant trials (Bendetowicz et al., Citation2018; Bendetowicz, Urbanski, Aichelburg, Levy, & Volle, Citation2017). The role of the left IFG in CAT is consistent with existing data, as its activation in fMRI has been associated with verbal restructuring during and before solution in RAT trials (Becker, Kühn, & Sommer, Citation2020). This key region of the ECN is also involved in controlled retrieval of weakly associated word pairs (Vatansever, Smallwood, & Jefferies, Citation2021) and in retrieving nondominant aspects of knowledge (Whitney, Kirk, O’sullivan, Lambon Ralph, & Jefferies, Citation2011). Regarding the rostrolateral PFC, in healthy participants, the gray matter volume of this region correlated with performance in distant CAT trials (Bendetowicz, Urbanski, Aichelburg, Levy, & Volle, Citation2017), and in patients, damage to this region and to its connections was shown to impair CAT performance (Bendetowicz et al., Citation2018).
We identified a higher contribution of prefrontal brain regions of the ECN in the positive model network of higher CAT_sensitivity, via connections to other regions within the ECN (to intraparietal sulcus and inferior parietal regions) and to the salience network (to inferior parietal regions and insula). Brain links between the ECN and DMN, and between DAN and salience networks were also predictive of higher CAT_sensitivity, indicating that people with higher connectivity in this positive network had more sensitivity to the associative remoteness of the CAT trials and were less able to solve distant trials. Although we controlled for RTs in the CAT_sensitivity analyses, we cannot discard that the involvement of prefrontal brain regions of the ECN may be related to higher difficulty of the distant trials at the semantic level, as these regions, and in particular the IFG has been also related to semantic control in previous studies (Lambon -Ralph, Jefferies, Patterson, & Rogers, Citation2017). This finding may also reflect how heightened inhibition/attention over more spontaneous activations related to DMN connectivity (Benedek, Jurisch, Koschutnig, Fink, & Beaty, Citation2020; Marron et al., Citation2018; Marron, Berant, Axelrod, & Faust, Citation2020) leads to lower performance in CAT distant trials. This finding may be interpreted as that a loosened top-down regulatory control could favor solving trials with higher associative remoteness, as proposed by the hypofrontality hypothesis (Chrysikou, Weber, & Thompson-Schill, Citation2014), or that people are likely to involve more cognitive control in more distant trials where no spontaneous idea comes to mind, so that controlled retrieval is more strongly needed to compensate for poor associative abilities.
We observed the contribution of connections with the superior parietal lobule of the DAN, mid cingulate and inferior parietal lobule of the ECN and DMN in the prediction of solving more distant trials. In particular, most of the links between DMN and ECN, and within ECN in the negative predictive network of CAT_sensitivity, were localized in the inferior parietal region, a brain region that has been previously associated with semantic integration (Thompson et al., Citation2007). The inferior parietal region has been also related to the generation of novel compared to recalled ideas during divergent thinking tasks (Benedek et al., Citation2014, Citation2018). In addition, previous findings have shown the role of this region in episodic memory and future thinking related to creative thinking, suggesting that RAT-like tasks involve episodic memory processes possibly to find the link between the unrelated cue words (Benedek, Jurisch, Koschutnig, Fink, & Beaty, Citation2020). Overall, brain regions that contributed to the negative CAT_sensitivity predictive network have been related to creativity in different domains (Boccia et al., Citation2015; Gonen-Yaacovi et al., Citation2013) and may reflect the semantic processing related to associative thinking involved in creativity.
Altogether, the results of the present study allowed us to examine the whole-brain functional connectivity patterns related to associative remoteness in solving RAT-like trials. A previous study using functional MRI explored brain activity in close versus remote trials in a RAT-like task (Wu, Chan, & Chen, Citation2021). As a difference to our CAT, in this study remoteness was measured based on the frequency of occurrence of the target words or responses, rather than associative distance between cue and target words. The authors have shown that close and remote trials involved the posterior cingulate cortex, while remote trials recruited rostromedial PFC, precuneus, and middle temporal gyrus. In our study, these three brain regions contributed to the performance in close and distant trials, but with also an additional contribution of nodes in these regions in distant trials. This finding suggests that the involvement of these regions may increase with remoteness of CAT but may not be unique to remote trials.
Although we did not observe the involvement of prefrontal brain regions of the ECN in the prediction of solving CAT close trials, we identified temporal regions that partly overlap with the middle temporal gyrus in the common positive network of close and distant trials. These links were also observed in the prediction of better ability in more remote trials as captured by the CAT_sensitivity. The middle temporal gyrus has been identified as a key brain region of the semantic control, in addition to the IFG in the context of the controlled semantic cognition framework (Noonan, Jefferies, Visser, & Lambon Ralph, Citation2013; Whitney, Kirk, O’sullivan, Lambon Ralph, & Jefferies, Citation2011). In addition, functional connectivity linking the temporal lobe and in particular, the temporal pole to the rest of the brain were predictors of solving CAT trials with higher associative remoteness (CAT_sensitivity). Since we also found the contribution of nodes that overlap the left angular gyrus of the DMN for the prediction of solving CAT close and distant, a key region of the semantic representation in semantic cognition (Lambon -Ralph, Jefferies, Patterson, & Rogers, Citation2017), we suggest that semantic retrieval and controlled processes related to semantic cognition may be common for trials with lower and higher associative remoteness. Overall, while some form of semantic control might be involved in close and distant trials, additional cognitive control subserved by connections within brain regions of the ECN may be recruited when the remoteness between remote associates to be combined increases.
Taken together, our results also parallel findings from previous CPM studies on divergent thinking, suggesting a similar optimal functional connectivity pattern driving the performance in combining remote associations and divergent thinking. Beaty, Benedek, Kaufman, and Silvia (Citation2015) examined the functional connectivity pattern between the DMN, ECN, and salience networks across different time windows of a divergent thinking task. The authors show how in early stages of the divergent thinking tasks, the DMN is coupled with the salience network, potentially related to heightened associative, stimulus driven, processes related to generation of responses. At later stages, the DMN is coupled with the ECN, potentially related to heightened top-down cognitive control processes related to evaluation of responses (Beaty, Benedek, Kaufman, & Silvia, Citation2015). Thus, our results showing the interaction between DMN, ECN, and salience network for the distant CAT trials and the negative predictive network of CAT_sensitivity potentially shared cognitive demands between combining semantically distant concepts and divergent thinking performance (Volle, Citation2018). Our findings correspond CPM findings linking the DMN, ECN, and salience network in relation to divergent thinking (Beaty et al., Citation2018; Frith et al., Citation2021).
As such, our findings potentially highlight a general whole-brain functional connectivity pattern linking different aspects of creative thinking – namely both divergent and convergent thinking. Smith, Huber, and Vul (Citation2013) conducted an analysis of the RAT based on participants verbal reports of their guesses while trying to solve RAT trials. The authors demonstrate a two-stage processes during the RAT: An initial divergent search process, where participants focus on one cue word and generate alternative associates to it, and then a convergent process, where such associative alternatives are examined if they correspond to the additional cue words. Our CPM results thus can be viewed to strengthen this two-process model assuming divergent and convergent processes in generating associative combinations, and support the notion that linking concepts also plays a central role in divergent thinking performance.
Some limitations of this study should be mentioned. First, the sample is relatively small, especially for conducting the CPM approach. However, the results are robust to statistical procedures based on permutation testing and cross-validation using restring-state data. Second, besides the correlation-based predictions at the brain level, we did not observe significant correlations between the CAT scores and the RJT ratings behaviorally which may suggest that CAT performance involves more cognitive processes than those captured when judging the relatedness of word pairs as evaluated in the RJT task. Further analyses should be done to better understand the relationships between judging the semantic relatedness and CAT performance.
Finally, the instructions provided to the participants when describing the Eureka phenomenon may only capture the suddenness of the phenomenon. Instructions that also include emotional and uncertainty components of this phenomenon should be considered in future studies.
In conclusion, the current study is the first task-based whole-brain functional connectivity study aimed at elucidating the neural patterns related to creativity during a remote association task. We found that whole-brain functional connectivity predicts performance in the combined association task, and characterize optimal whole-brain functional connectivity patterns that predict performance in more distant associative combination trials. While predictive patterns involving the DMN are likely related to associative processes required in all trials of the task, more controlled processes played an important role in trials with higher associative remoteness supported by brain connections within the ECN. The functional connectivity patterns related to higher creative demands of the task share similarities with functional connectivity patterns previously found to predict divergent thinking. Thus, our work potentially offers insights into neural mechanisms that play a role in both convergent and divergent thinking.
Author Contributions
E.V., M.O.T designed the study. M.O.T., M.BER., and J.B. collected the data; M.O.T. analyzed the data with contribution from B.B., M.BER, T.B., J.B., E.V., and Y.N.K.; Y.N.K and M.O.T. wrote the first draft of the article; M.O.T., Y.N.K., M.BEN., B.B. and E.V. wrote and revised the manuscript. All authors revised and approved the manuscript.
Code availability
Analyses were conducted using open software and toolboxes available online as described in the Methods section (SPM 12: https://www.fil.ion.ucl.ac.uk/spm/software/spm12/; AFNI: https://afni.nimh.nih.gov); Nilearn: https://nilearn.github.io/stable/index.html; TEDANA: https://tedana.readthedocs.io/en/stable/; CPM: https://www.nitrc.org/projects/bioimagesuite/; Network metrics computation: https://sites.google.com/site/bctnet/Home/functions). The scripts written for this paper are available upon request from the corresponding author.
Supplemental Material
Download MS Word (97.4 KB)Acknowledgments
The research was supported by “Agence Nationale de la Recherche” [grant number ANR-19-CE37-0001-01] (E.V., M. BEN., and Y.N.K.), the “Fondation pour la recherche medicale” [grant number: DEQ20150331725] (E.V.), and received infrastructure funding from the French program “Investissements d’avenir” ANR-10-IAIHU-06 (E.V.). This work was also funded by Becas-Chile of ANID-CONICYT (M.O.T.). The funders had no role in study design, data collection and analysis, decision to publish, or preparation of the manuscript. We thank the participants for making this work possible.
Disclosure statement
No potential conflict of interest was reported by the authors.
Data availability statement
All data needed to evaluate the conclusions in the paper are present in the paper and/or the Supplementary Materials, or are available at https://osf.io/vp9s8/?view_only=91b4dd63fc2f4d2481612e802881fdb2.
Supplementary material
Supplemental data for this article can be accessed online at https://doi.org/10.1080/10400419.2023.2192563.
Additional information
Funding
References
- Abraham, A., & Bubic, A. (2015). Semantic memory as the root of imagination. Frontiers in Psychology, 6, 325. doi:10.3389/fpsyg.2015.00325
- Abraham, A., Pedregosa, F., Eickenberg, M., Gervais, P., Mueller, A., Kossaifi, J. … Varoquaux, G. (2014). Machine learning for neuroimaging with scikit-learn. Frontiers in Neuroinformatics, 8, 14. doi:10.3389/fninf.2014.00014
- Acar, S., & Runco, M. A. (2019). Divergent thinking: New methods, recent research, and extended theory. Psychology of Aesthetics, Creativity, and the Arts, 13(2), 153–158. doi:10.1037/aca0000231
- Beaty, R. E., Benedek, M., Kaufman, S. B., & Silvia, P. J. (2015). Default and executive network coupling supports creative idea production [Article]. Scientific Reports, 5(1), 10964. doi:https://doi.org/10.1038/srep10964
- Beaty, R. E., Benedek, M., Silvia, P. J., & Schacter, D. L. (2016). Creative cognition and brain network dynamics. Trends in Cognitive Sciences, 20(2), 87–95. doi:10.1016/j.tics.2015.10.004
- Beaty, R. E., Kenett, Y. N., Christensen, A. P., Rosenberg, M. D., Benedek, M., Chen, Q. … Silvia, P. J. (2018). Robust prediction of individual creative ability from brain functional connectivity. Proceedings of the National Academy of Sciences, 115(5), 1087–1092. doi:10.1073/pnas.1713532115
- Beaty, R. E., Seli, P., & Schacter, D. L. (2019). Network neuroscience of creative cognition: Mapping cognitive mechanisms and individual differences in the creative brain. Current Opinion in Behavioral Sciences, 27, 22–30. doi:10.1016/j.cobeha.2018.08.013
- Beaty, R. E., Silvia, P. J., Nusbaum, E. C., Jauk, E., & Benedek, M. (2014). The roles of associative and executive processes in creative cognition. Memory & Cognition, 42(7), 1–12. doi:10.3758/s13421-014-0428-8
- Beaty, R. E., Zeitlen, D. C., Baker, B. S., & Kenett, Y. N. (2021). Forward flow and creative thought: Assessing associative cognition and its role in divergent thinking. Thinking Skills and Creativity, 41, 100859. doi:10.1016/j.tsc.2021.100859
- Becker, M., Davis, S., & Cabeza, R. (2022). Between automatic and control processes: How relationships between problem elements interact to facilitate or impede insight. Memory & Cognition, 50(8), 1719–1734. doi:https://doi.org/10.3758/s13421-022-01277-3
- Becker, M., Kühn, S., & Sommer, T. (2020). Verbal insight revisited—dissociable neurocognitive processes underlying solutions accompanied by an AHA! experience with and without prior restructuring. Journal of Cognitive Psychology, 1–26.
- Becker, M., Sommer, T., & Kühn, S. (2020a). Inferior frontal gyrus involvement during search and solution in verbal creative problem solving: A parametric fMRI study. NeuroImage, 206, 116294. doi:10.1016/j.neuroimage.2019.116294
- Becker, M., Sommer, T., & Kühn, S. (2020b). Verbal insight revisited: fMRI evidence for early processing in bilateral insulae for solutions with AHA! experience shortly after trial onset. Human Brain Mapping, 41(1), 30–45. doi:10.1002/hbm.24785
- Becker, M., Wiedemann, G., & Kühn, S. (2020). Quantifying insightful problem solving: A modified compound remote associates paradigm using lexical priming to parametrically modulate different sources of task difficulty. Psychological Research, 84(2), 528–545. doi:10.1007/s00426-018-1042-3
- Bendetowicz, D., Urbanski, M., Aichelburg, C., Levy, R., & Volle, E. (2017). Brain morphometry predicts individual creative potential and the ability to combine remote ideas. Cortex, 86, 216–229. doi:10.1016/j.cortex.2016.10.021
- Bendetowicz, D., Urbanski, M., Garcin, B., Foulon, C., Levy, R., Bréchemier, M. -L. … Volle, E. (2018). Two critical brain networks for generation and combination of remote associations. Brain: A Journal of Neurology, 141(1), 217–233. doi:10.1093/brain/awx294
- Benedek, M., Christensen, A. P., Fink, A., & Beaty, R. E. (2019). Creativity assessment in neuroscience research. Psychology of Aesthetics, Creativity, and the Arts, 13(2), 218–226. doi:10.1037/aca0000215
- Benedek, M., & Fink, A. (2019). Toward a neurocognitive framework of creative cognition: The role of memory, attention, and cognitive control. Current Opinion in Behavioral Sciences, 27, I116–122. doi:10.1016/j.cobeha.2018.11.002
- Benedek, M., Jauk, E., Fink, A., Koschutnig, K., Reishofer, G., Ebner, F., & Neubauer, A. C. (2014). To create or to recall? Neural mechanisms underlying the generation of creative new ideas. NeuroImage, 88, 125–133. doi:10.1016/j.neuroimage.2013.11.021
- Benedek, M., Jurisch, J., Koschutnig, K., Fink, A., & Beaty, R. E. (2020). Elements of creative thought: Investigating the cognitive and neural correlates of association and bi-association processes. NeuroImage, 210, 116586. doi:10.1016/j.neuroimage.2020.116586
- Benedek, M., Kenett, Y. N., Umdasch, K., Anaki, D., Faust, M., & Neubauer, A. C. (2017). How semantic memory structure and intelligence contribute to creative thought: A network science approach. Thinking & Reasoning, 23(2), 158–183. doi:10.1080/13546783.2016.1278034
- Benedek, M., Könen, T., & Neubauer, A. C. (2012). Associative abilities underlying creativity. Psychology of Aesthetics, Creativity, and the Arts, 6(3), 273–281. doi:10.1037/a0027059
- Benedek, M., & Neubauer, A. C. (2013). Revisiting Mednick’s model on creativity-related differences in associative hierarchies. Evidence for a common path to uncommon thought. The Journal of Creative Behavior, 47(4), 273–289. doi:10.1002/jocb.35
- Benedek, M., Schües, T., Beaty, R. E., Jauk, E., Koschutnig, K., Fink, A., & Neubauer, A. C. (2018). To create or to recall original ideas: Brain processes associated with the imagination of novel object uses. Cortex, 99, 93–102. doi:10.1016/j.cortex.2017.10.024
- Bernard, M., Kenett, Y. N., Ovando-Tellez, M. P., Benedek, M., & Volle, E. (2019). Building individual semantic networks and exploring thei relationship with creativity. The 41st Annual Meeting of the Cognitive Science Socie, Montreal QB, Canada.
- Bieth, T., Ovando-Tellez, M., Lopez-Persem, A., Garcin, B., Hugueville, L., Lehongre, K. … Volle, E. (2021). Time course of EEG power during creative problem-solving with insight or remote thinking. bioRxiv.
- Boccia, M. Piccardi, L., Palermo, L., Nori, R., & Palmiero, M. (2015). Where do bright ideas occur in our brain? Meta-analytic evidence from neuroimaging studies of domain-specific creativity [Original Research]. Frontiers in Psychology, 6 1195. doi:https://doi.org/10.3389/fpsyg.2015.01195
- Bowden, E. M., & Jung-Beeman, M. (2003). One hundred forty-four compound remote associate problems: Short insight-like problems with one-word solutions. Behavioral Research, Methods, Instruments, and Computers, 35(4), 634–639. doi:10.3758/BF03195543
- Brophy, D. R. (2001). Comparing the attributes, activities, and performance of divergent, convergent, and combination thinkers. Creativity Research Journal, 13(3–4), 439–455. doi:10.1207/S15326934CRJ1334_20
- Chen, Q., Yang, W., Li, W., Wei, D., Li, H., Lei, Q. … Qiu, J. (2014). Association of creative achievement with cognitive flexibility by a combined voxel-based morphometry and resting-state functional connectivity study. NeuroImage, 102(Part 2), 474–483. doi:10.1016/j.neuroimage.2014.08.008
- Chrysikou, E. G., Weber, M. J., & Thompson-Schill, S. L. (2014). A matched filter hypothesis for cognitive control. Neuropsychologia, 62, 341–355. doi:10.1016/j.neuropsychologia.2013.10.021
- Cogdell‐brooke, L. S., Sowden, P. T., Violante, I. R., & Thompson, H. E. (2020). A meta‐analysis of functional magnetic resonance imaging studies of divergent thinking using activation likelihood estimation. Human Brain Mapping, 41(17), 5057–5077. doi:10.1002/hbm.25170
- Cole, M. W., Ito, T., Cocuzza, C., & Sanchez-Romero, R. (2021). The functional relevance of task-state functional connectivity. Journal of Neuroscience, 41(12), 2684–2702. doi:10.1523/JNEUROSCI.1713-20.2021
- Cole, M. W., Ito, T., Schultz, D., Mill, R., Chen, R., & Cocuzza, C. (2019). Task activations produce spurious but systematic inflation of task functional connectivity estimates. NeuroImage, 189, 1–18. doi:10.1016/j.neuroimage.2018.12.054
- Cox, R. W. (1996). AFNI: Software for analysis and visualization of functional magnetic resonance neuroimages. Computers and Biomedical Research, 29(3), 162–173. doi:10.1006/cbmr.1996.0014
- Debrenne, M. (2011). Le dictionnaire des associations verbales du français et ses applications. Variétés, variations and formes du français, 355, 366.
- Evans, M., Krieger-Redwood, K., Alam, T. R. G., Smallwood, J., & Jefferies, E. (2020). Controlled semantic summation correlates with intrinsic connectivity between default mode and control networks. Cortex, 129, 356–375. doi:10.1016/j.cortex.2020.04.032
- Finn, E., Shen, X., Scheinost, D. (2015). Functional connectome fingerprinting: Identifying individuals using patterns of brain connectivity. Nature neuroscience, 18, 1664–1671. https://doi.org/10.1038/nn.4135
- Frith, E., Elbich, D., Christensen, A. P., Rosenberg, M. D., Chen, Q., Silvia, P. … Beaty, R. E. (2021). Intelligence and creativity share a common cognitive and neural basis. Journal of Experimental Psychology, 150(4), 609–632. doi:10.1037/xge0000958
- Gaser, C., Dahnke, R., Thompson, P. M., Kurth, F., & Luders, E. (2022). CAT – a computational anatomy toolbox for the analysis of structural MRI data. bioRxiv. 2022.2006.2011.495736. doi: 10.1101/2022.06.11.495736
- Goldfarb, E. V., Rosenberg, M. D., Seo, D., Constable, R. T., & Sinha, R. (2020). Hippocampal seed connectome-based modeling predicts the feeling of stress. Nature Communications, 11(1), 1–10. doi:10.1038/s41467-020-16492-2
- Gonen-Yaacovi, G., De Souza, L. C., Levy, R., Urbanski, M., Josse, G., & Volle, E. (2013). Rostral and caudal prefrontal contribution to creativity: A meta-analysis of functional imaging data [Original research]. Frontiers in Human Neuroscience, 7, 465. doi:10.3389/fnhum.2013.00465
- Gratton, C., Laumann, T. O., Nielsen, A. N., Greene, D. J., Gordon, E. M., Gilmore, A. W. … Schlaggar, B. L. (2018). Functional brain networks are dominated by stable group and individual factors, not cognitive or daily variation. Neuron, 98(2), 439–452. e435. doi:10.1016/j.neuron.2018.03.035
- Gray, K., Anderson, S., Chen, E. E., Kelly, J. M., Christian, M. S., Patrick, J. … Lewis, K. (2019). “Forward flow”: A new measure to quantify free thought and predict creativity. The American Psychologist, 74(5), 539–554. doi:10.1037/amp0000391
- Greene, A. S., Gao, S., Scheinost, D., & Constable, R. T. (2018). Task-induced brain state manipulation improves prediction of individual traits. Nature Communications, 9(1), 1–13. doi:10.1038/s41467-018-04920-3
- Gupta, N., Jang, Y., Mednick, S. C., & Huber, D. E. (2012). The road not taken: Creative solutions require avoidance of high-frequency responses. Psychological Science, 23(3), 288–294. doi:10.1177/0956797611429710
- He, L., Kenett, Y. N., Zhuang, K., Liu, C., Zeng, R., Yan, T. … Qiu, J. (2021). The relation between semantic memory structure, associative abilities, and verbal and figural creativity. Thinking & Reasoning, 27(2), 268–293. doi:10.1080/13546783.2020.1819415
- Jefferies, E., & Lambon Ralph, M. A. (2006). Semantic impairment in stroke aphasia versus semantic dementia: A case-series comparison. Brain: A Journal of Neurology, 129(8), 2132–2147. doi:10.1093/brain/awl153
- Jiang, R., Zuo, N., Ford, J. M., Qi, S., Zhi, D., Zhuo, C. … Turner, J. A. (2020). Task-induced brain connectivity promotes the detection of individual differences in brain-behavior relationships. NeuroImage, 207, 116370. doi:10.1016/j.neuroimage.2019.116370
- Kajić, I., Gosmann, J. A., Stewart, T. C., Wennekers, T., & Eliasmith, C. (2017). A spiking neuron model of word associations for the remote associates test [Original research]. Frontiers in Psychology, 8(99), 99. doi:10.3389/fpsyg.2017.00099
- Kenett, Y. N., Anaki, D., & Faust, M. (2014). Investigating the structure of semantic networks in low and high creative persons. Frontiers in Human Neuroscience, 8(407), 1–16. doi:10.3389/fnhum.2014.00407
- Kenett, Y. N., Kraemer, D. J. M., Alfred, K. L., Colaizzi, G. A., Cortes, R. A., & Green, A. E. (2020). Developing a neurally informed ontology of creativity measurement. NeuroImage, 221, 117166. doi:10.1016/j.neuroimage.2020.117166
- Kounios, J., & Beeman, M. (2014). The cognitive neuroscience of insight. Annual Review of Psychology, 65(1), 71–93. doi:https://doi.org/10.1146/annurev-psych-010213-115154
- Krieger-Redwood, K., Steward, A., Gao, Z., Wang, X., Halai, A., Smallwood, J., & Jefferies, E. (2022). Creativity in verbal associations is linked to semantic control. bioRxiv. 2022.2002.2008.479385. doi: 10.1101/2022.02.08.479385
- Kundu, P., Brenowitz, N. D., Voon, V., Worbe, Y., Vértes, P. E., Inati, S. J. … Bullmore, E. T. (2013). Integrated strategy for improving functional connectivity mapping using multiecho FMRI. Proceedings of the National Academy of Sciences, 110(40), 16187–16192. doi:10.1073/pnas.1301725110
- Kundu, P., Inati, S. J., Evans, J. W., Luh, W. -M., & Bandettini, P. A. (2012). Differentiating BOLD and non-BOLD signals in fMRI time series using multi-echo EPI. NeuroImage, 60(3), 1759–1770. doi:10.1016/j.neuroimage.2011.12.028
- Lambon -Ralph, M. A., Jefferies, E., Patterson, K., & Rogers, T. T. (2017). The neural and computational bases of semantic cognition. Nature Reviews, 18(1), 42–55. doi:10.1038/nrn.2016.150
- Lee, C. S., & Therriault, D. J. (2013). The cognitive underpinnings of creative thought: A latent variable analysis exploring the roles of intelligence and working memory in three creative thinking processes. Intelligence, 41(5), 306–320. doi:10.1016/j.intell.2013.04.008
- Liu, C., Ren, Z., Zhuang, K., He, L., Yan, T., Zeng, R., & Qiu, J. (2021). Semantic association ability mediates the relationship between brain structure and human creativity. Neuropsychologia, 151, 107722. doi:10.1016/j.neuropsychologia.2020.107722
- Liu, P., Yang, W., Zhuang, K., Wei, D., Yu, R., Huang, X., & Qiu, J. (2021). The functional connectome predicts feeling of stress on regular days and during the COVID-19 pandemic. Neurobiology of Stress, 14, 100285. doi:10.1016/j.ynstr.2020.100285
- Lopez-Persem, A., Bieth, T., Guiet, S., Ovando-Tellez, M., & Volle, E. (2021). Through thick and thin: Changes in creativity during the first lockdown of the Covid-19 pandemic. PsyArXiv.
- Lynch, C. J., Power, J. D., Scult, M. A., Dubin, M., Gunning, F. M., & Liston, C. (2020). Rapid precision functional mapping of individuals using multi-echo fMRI. Cell Reports, 33(12), 108540. doi:10.1016/j.celrep.2020.108540
- Madore, K. P., Thakral, P. P., Beaty, R. E., Addis, D. R., & Schacter, D. L. (2019). Neural mechanisms of episodic retrieval support divergent creative thinking. Cerebral Cortex, 29(1), 150–166. doi:10.1093/cercor/bhx312
- Marron, T. R., Berant, E., Axelrod, V., & Faust, M. (2020). Spontaneous cognition and its relationship to human creativity: A functional connectivity study involving a chain free association task. NeuroImage, 220, 117064. doi:10.1016/j.neuroimage.2020.117064
- Marron, T. R., Lerner, Y., Berant, E., Kinreich, S., Shapira-Lichter, I., Hendler, T., & Faust, M. (2018). Chain free association, creativity, and the default mode network. Neuropsychologia, 118, 40–58. doi:10.1016/j.neuropsychologia.2018.03.018
- Matheson, H. E., & Kenett, Y. N. (2020). The role of the motor system in generating creative thoughts. NeuroImage, 213, 116697. doi:10.1016/j.neuroimage.2020.116697
- Mednick, S. (1962). The associative basis of the creative process. Psychological Review, 69(3), 220–232. doi:10.1037/h0048850
- Noonan, K. A., Jefferies, E., Visser, M., & Lambon Ralph, M. A. (2013). Going beyond inferior prefrontal involvement in semantic control: Evidence for the additional contribution of dorsal angular gyrus and posterior middle temporal cortex. Journal of Cognitive Neuroscience, 25(11), 1824–1850. doi:10.1162/jocn_a_00442
- Ovando-Tellez, M., Benedek, M., Kenett, Y. N., Hills, T., Bouanane, S., Bernard, M. … Volle, E. (2022). An investigation of the cognitive and neural correlates of semantic memory search related to creative ability. Communications Biology, 5(1), 604. doi:10.1038/s42003-022-03547-x
- Ovando-Tellez, M. P., Bieth, T., Bernard, M., & Volle, E. (2019). The contribution of the lesion approach to the neuroscience of creative cognition. Current Opinion in Behavioral Sciences, 27, 100–108. doi:10.1016/j.cobeha.2018.10.011
- Ovando-Tellez, M., Kenett, Y. N., Benedek, M., Bernard, M., Belo, J., Beranger, B. … Volle, E. (2022). Brain connectivity–based prediction of real-life creativity is mediated by semantic memory structure. Science Advances, 8(5), eabl4294. doi:10.1126/sciadv.abl4294
- Paulin, T., Roquet, D., Kenett, Y. N., Savage, G., & Irish, M. (2020). The effect of semantic memory degeneration on creative thinking: A voxel-based morphometry analysis. NeuroImage, 220, 117073. doi:10.1016/j.neuroimage.2020.117073
- Power, J. D., Mitra, A., Laumann, T. O., Snyder, A. Z., Schlaggar, B. L., & Petersen, S. E. (2014). Methods to detect, characterize, and remove motion artifact in resting state fMRI. NeuroImage, 84, 320–341. doi:10.1016/j.neuroimage.2013.08.048
- Pruim, R. H. R., Mennes, M., van Rooij, D., Llera, A., Buitelaar, J. K., & Beckmann, C. F. (2015). ICA-AROMA: A robust ICA-based strategy for removing motion artifacts from fMRI data. NeuroImage, 112, 267–277. doi:10.1016/j.neuroimage.2015.02.064
- Ren, Z., Daker, R. J., Shi, L., Sun, J., Beaty, R. E., Wu, X. … Green, A. E. (2021). Connectome-based predictive modeling of creativity anxiety. NeuroImage, 225, 117469. doi:10.1016/j.neuroimage.2020.117469
- Rosenberg, M. D., Finn, E. S., Scheinost, D., Papademetris, X., Shen, X., Constable, R. T., & Chun, M. M. (2016). A neuromarker of sustained attention from whole-brain functional connectivity. Nature Neuroscience, 19(1), 165–171. doi:10.1038/nn.4179
- Rosenberg, M. D., Hsu, W. -T., Scheinost, D., Todd Constable, R., & Chun, M. M. (2018). Connectome-based models predict separable components of attention in novel individuals. Journal of Cognitive Neuroscience, 30(2), 160–173. doi:10.1162/jocn_a_01197
- Rossman, E., & Fink, A. (2010). Do creative people use shorter association pathways? Personality and Individual Differences, 49(8), 891–895. doi:10.1016/j.paid.2010.07.025
- Runco, M. A., & Acar, S. (2012). Divergent thinking as an indicator of creative potential. Creativity Research Journal, 24(1), 66–75. doi:10.1080/10400419.2012.652929
- Schaefer, A., Kong, R., Gordon, E. M., Laumann, T. O., Zuo, X. -N., Holmes, A. J. … Yeo, B. T. T. (2017). Local-global parcellation of the human cerebral cortex from intrinsic functional connectivity MRI. Cerebral Cortex, 28(9), 3093–3114. doi:10.1093/cercor/bhx179
- Shen, X., Finn, E. S., Scheinost, D., Rosenberg, M. D., Chun, M. M., Papademetris, X., & Constable, R. T. (2017). Using connectome-based predictive modeling to predict individual behavior from brain connectivity. Nature Protocols, 12(3), 506–518. doi:10.1038/nprot.2016.178
- Smith, K. A., Huber, D. E., & Vul, E. (2013). Multiply-constrained semantic search in the Remote Associates Test. Cognition, 128(1), 64–75. doi:10.1016/j.cognition.2013.03.001
- Sun, J., Liu, Z., Rolls, E. T., Chen, Q., Yao, Y., Yang, W., Qiu, J. … Qiu, J. (2019). Verbal creativity correlates with the temporal variability of brain networks during the resting state. Cerebral Cortex, 29(3), 1047–1058. doi:10.1093/cercor/bhy010
- Taft, R., & Rossiter, J. R. (1966). The remote associates test: Divergent or convergent thinking? Psychological Reports, 19(3), 1313–1314. doi:10.2466/pr0.1966.19.3f.1313
- Thompson, C. K., Bonakdarpour, B., Fix, S. C., Blumenfeld, H. K., Parrish, T. B., Gitelman, D. R., & Mesulam, M. -M. (2007). Neural correlates of verb argument structure processing. Journal of Cognitive Neuroscience, 19(11), 1753–1767. doi:10.1162/jocn.2007.19.11.1753
- Tik, M., Sladky, R., Luft, C. D. B., Willinger, D., Hoffmann, A., Banissy, M. J. … Windischberger, C. (2018). Ultra‐high‐field fMRI insights on insight: Neural correlates of the Aha!‐moment. Human Brain Mapping, 39(8), 3241–3252. doi:10.1002/hbm.24073
- Topolinski, S., & Reber, R. (2010). Immediate truth–temporal contiguity between a cognitive problem and its solution determines experienced veracity of the solution. Cognition, 114(1), 117–122. doi:10.1016/j.cognition.2009.09.009
- Tu, P. -C., Kuan, Y. -H., Li, C. -T., & Su, T. -P. (2017). Structural correlates of creative thinking in patients with bipolar disorder and healthy controls—a voxel-based morphometry study. Journal of Affective Disorders, 215, 218–224. doi:10.1016/j.jad.2017.03.036
- Uddin, L. Q. (2015). Salience processing and insular cortical function and dysfunction. Nature Reviews, 16(1), 55–61. doi:10.1038/nrn3857
- Vartanian, O. (2009). Variable attention facilitates creative problem solving. Psychology of Aesthetics, Creativity, and the Arts, 3(1), 57–59. doi:10.1037/a0014781
- Vartanian, O., Martindale, C., & Matthews, J. (2009). Divergent thinking ability is related to faster relatedness judgments. Psychology of Aesthetics, Creativity, and the Arts, 3(2), 99–103. doi:10.1037/a0013106
- Vatansever, D., Smallwood, J., & Jefferies, E. (2021). Varying demands for cognitive control reveals shared neural processes supporting semantic and episodic memory retrieval. Nature Communications, 12(1), 2134. doi:10.1038/s41467-021-22443-2
- Volle, E. (2018). Associative and controlled cognition in divergent thinking: Theoretical, experimental, neuroimaging evidence, and new directions. In R. E. Jung & O. Vartanian (Eds.), The Cambridge handbook of the neuroscience of creativity (pp. 333–362). Cambridge University Press.
- Wei, T., Liang, X., He, Y., Zang, Y., Han, Z., Caramazza, A., & Bi, Y. (2012). Predicting conceptual processing capacity from spontaneous neuronal activity of the left middle temporal gyrus. Journal of Neuroscience, 32(2), 481–489. doi:10.1523/JNEUROSCI.1953-11.2012
- Whitney, C., Kirk, M., O’sullivan, J., Lambon Ralph, M. A., & Jefferies, E. (2011). The neural organization of semantic control: TMS evidence for a distributed network in left inferior frontal and posterior middle temporal gyrus. Cerebral Cortex, 21(5), 1066–1075. doi:10.1093/cercor/bhq180
- Wu, C. -L., Chan, Y. -C., & Chen, H. -C. (2021). Neurocognitive mechanism of remote and close associations: An fMRI study. The American Journal of Psychology, 134(3), 333–346. doi:10.5406/amerjpsyc.134.3.0333
- Wu, C. -L., & Chen, H. -C. (2021a). Distinguishing the three versions of the Chinese Remote Associates Test based on default mode network connectivity. Thinking Skills and Creativity, 40, 100829. doi:10.1016/j.tsc.2021.100829
- Wu, C. -L., & Chen, H. -C. (2021b). Visual-spatial and verbal remote association: An fMRI study. Frontiers in Psychology, 3203. doi:10.3389/fpsyg.2021.672997
- Wu, C. -L., Huang, S. -Y., Chen, P. -Z., & Chen, H. -C. (2020). A systematic review of creativity-related studies applying the remote associates test from 2000 to 2019. Frontiers in Psychology, 11, 573432. doi:10.3389/fpsyg.2020.573432
- Wu, C. -L., Tsai, M. -N., & Chen, H. -C. (2020). The neural mechanism of pure and pseudo-insight problem solving. Thinking & Reasoning, 26(4), 479–501. doi:10.1080/13546783.2019.1663763
- Zabelina, D. L., & Andrews-Hanna, J. R. (2016). Dynamic network interactions supporting internally-oriented cognition. Current Opinion in Neurobiology, 40, 86–93. doi:10.1016/j.conb.2016.06.014